Real estate in the metaverse is booming. Is it really such a crazy idea?

By Theo Tzanidis, University of the West of Scotland 

The idea of spending thousands or even millions of dollars to buy fictitious “land” in a virtual world sounds, to be frank, absurd.

But in recent months, we’ve seen significant investments in virtual land within the metaverse. PwC is among the latest to dive in, having purchased real estate in The Sandbox, a virtual gaming world, for an undisclosed amount.

If other reported sales are anything to go by, it would have been a handsome sum. One person recently bought a plot of land in the Snoopverse – a virtual world rapper Snoop Dogg is developing within The Sandbox – for US$450,000 (around £332,500).

Meanwhile, the Metaverse Group, a real estate company focused on the metaverse economy, reportedly bought a piece of land in Decentraland, another virtual platform, for US$2.43 million.

Let’s refresh on what the “metaverse” is. You probably heard the term a lot when Facebook re-branded to Meta in October 2021. Other companies, such as Nike and Microsoft, have also announced they will launch into this space.

The metaverse describes a vision of a connected 3D virtual world, where real and digital worlds are integrated using technologies such as virtual reality (VR) and augmented reality (AR). This immersive environment will be accessible through the likes of VR headsets, AR glasses and smartphone apps.

Users will meet and communicate as digital avatars, explore new areas and create content. The idea is the metaverse will develop to become a collaborative virtual space where we can socialise, play, work and learn.

There are several metaverses already – for example in virtual gaming platforms like The Sandbox and virtual worlds like Decentraland. In the same way a website is part of the broader 2D world wide web, individual metaverses will form a larger, connected metaverse.

Importantly, as in the real world, it is and increasingly will be possible to buy things in the metaverse – including real estate.

Virtual land as an NFT

Transactions in the virtual world are generally monetised using cryptocurrency. Other than cryptocurrenies, non-fungible tokens (NFTs) are the primary method for monetising and exchanging value within the metaverse.

An NFT is a unique digital asset. Although NFTs are primarily items of digital art (such as videos, images, music or 3D objects), a variety of assets may constitute an NFT – including virtual real estate. On platforms like OpenSea, where people go to buy and trade NFTs, there are now plots of land, or even virtual houses.

To ensure digital real estate has value, supply is limited – a concept in economics called “scarcity value”. For example, Decentraland is made up of 90,000 pieces or “parcels” of land, each around 50 feet by 50 feet.

We’re already seeing examples where the value of virtual real estate is going up. In June 2021, a digital real estate investment fund called Republic Realm reportedly spent the equivalent of more than US$900,000 to buy an NFT representing a plot on Decentraland. According to DappRadar, a website which tracks NFT sales data, it was the most expensive purchase of NFT land in Decentraland history.

But then as we know, in November 2021, the Metaverse Group bought their plot in Decentraland for US$2.4 million. The size of this purchase was actually smaller than the former – 116 land parcels compared to 259 bought by Republic Realm.

It’s not just Decentraland seeing appreciations. In February 2021, Axie Infinity (another virtual gaming world) reportedly sold nine of their land parcels for the equivalent of US$1.5 million – a record, the company said – before one land parcel sold for US$2.3 million in November 2021.

While it appears that values are climbing, it’s important to acknowledge that real estate investment in the metaverse remains extremely speculative. No one can be certain if this boom is the next great thing or the next big bubble.

The future of metaverse real estate

Financial incentives aside, you may be wondering what companies and individuals will actually do with their virtual land.

As an example, the Metaverse Group’s purchase is in Decentraland’s fashion precinct. According to the buyer the space will be used to host digital fashion events and sell virtual clothing for avatars – another potential area for growth in the metaverse.

While investors and companies are dominating this space at the moment, not all metaverse real estate will set you back millions. But what could owning virtual land offer you? If you buy a physical property in the real world, the result is tangible – somewhere to live, to take pride in, to welcome family and friends.

While virtual property doesn’t provide physical shelter, there are some parallels. In shopping for virtual real estate, you could buy a piece of land to build on. Or you could choose a house already built that you like. You could make it your own with various (digital) objects. You could invite visitors, and visit others’ virtual homes too.

This vision is a while away. But if it seems completely absurd, we should remember that once upon a time, people had doubts about the potential significance of the internet, and then social media. Technologists predict the metaverse will mature into a fully functioning economy in the coming years, providing a synchronous digital experience as interwoven into our lives as email and social networking are now.

This is a strange fantasy come true for someone who was a gamer in a former life. Some years ago, a younger version of my conscience was telling me to stop wasting time playing video games; to go back to study and focus on my “real” life. Deep inside I always had this wish to see gaming overlapping with real life, Real Player One style. I feel this vision is inching ever closer.The Conversation

About the Author:

Theo Tzanidis, Senior Lecturer in Digital Marketing, University of the West of Scotland

This article is republished from The Conversation under a Creative Commons license. Read the original article.

Japanese Candlesticks Analysis 06.01.2022 (USDCAD, AUDUSD, USDCHF)

Article By RoboForex.com

USDCAD, “US Dollar vs Canadian Dollar”

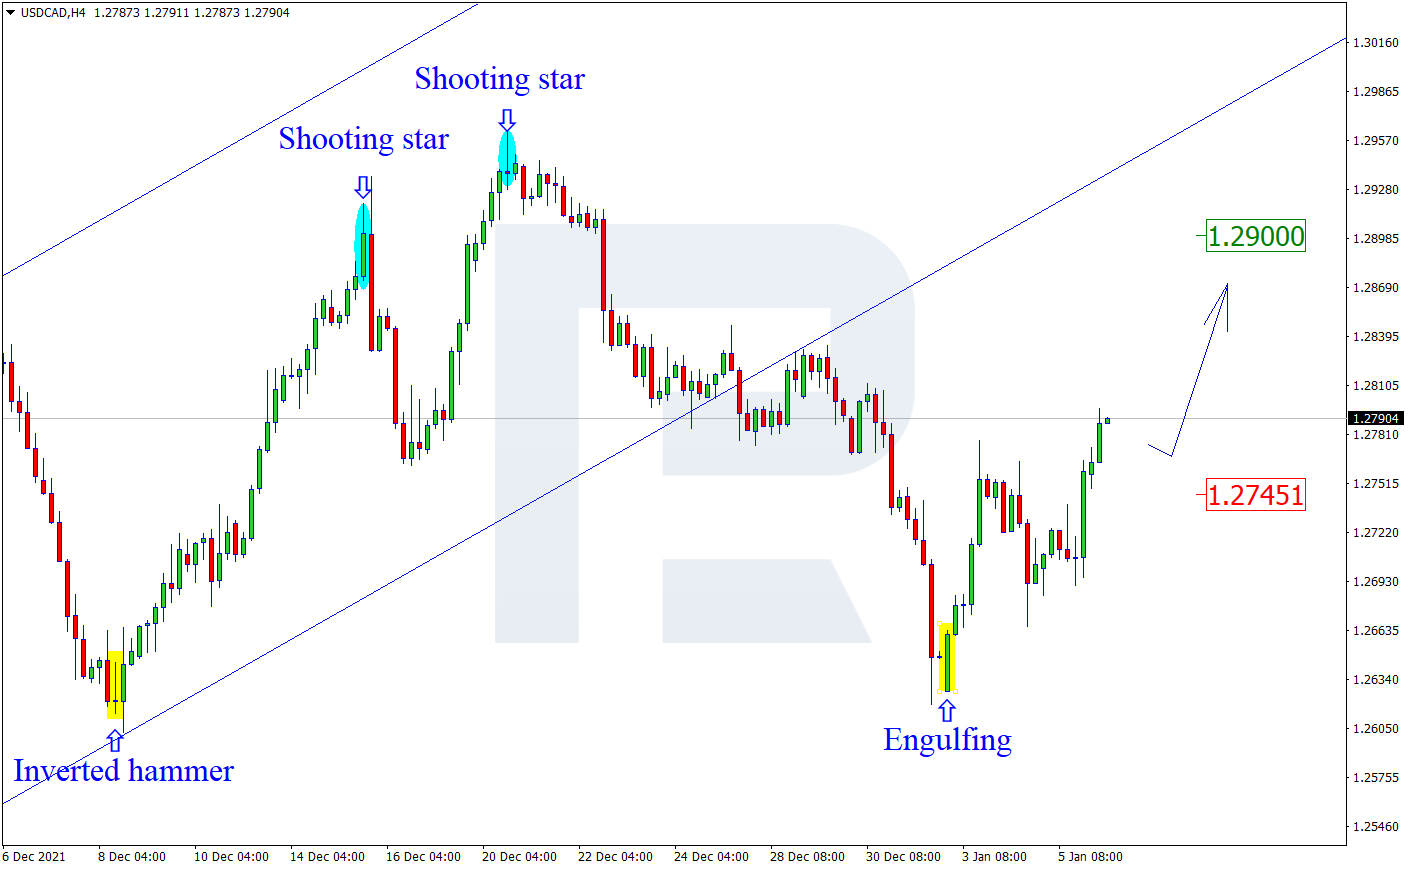
As we can see in the H4 chart, after forming several reversal patterns, including Engulfing, close to the support level, USDCAD is reversing and may resume trading upwards. In this case, the upside target may be the resistance area at 1.2900. However, an alternative scenario implies that the asset may correct to reach 1.2745 before resuming its ascending tendency.

USDCAD
Risk Warning: the result of previous trading operations do not guarantee the same results in the future

AUDUSD, “Australian Dollar vs US Dollar”

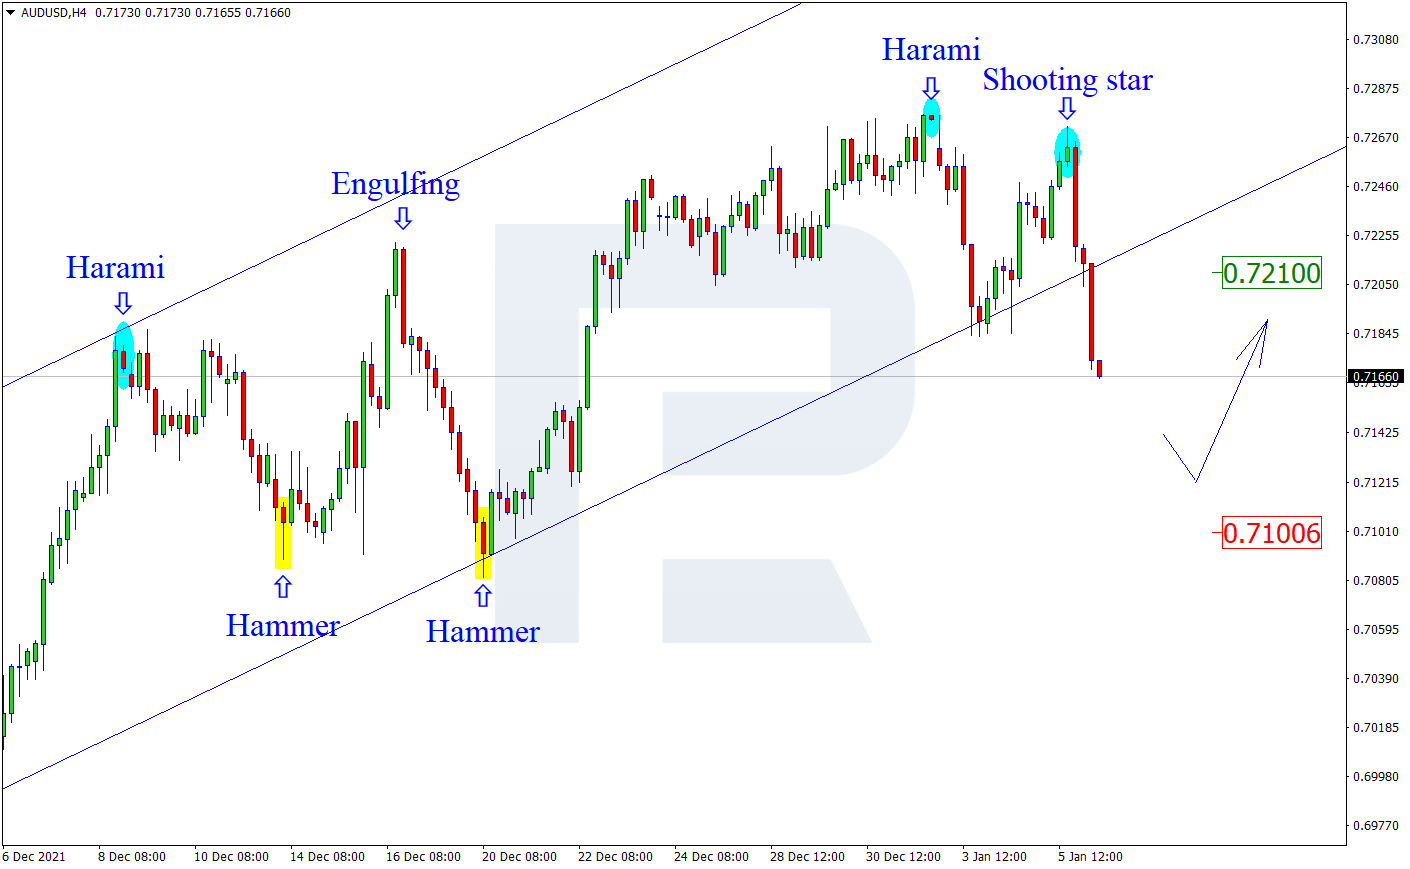
As we can see in the H4 chart, AUDUSD has formed a Shooting Star reversal pattern near the resistance area. At the moment, the asset is reversing in the form of another pullback. In this case, the downside correctional target may be the support level at 0.7100. After testing the level, the price may rebound from it and resume the ascending tendency. The upside target is at 0.7210.

AUDUSD
Risk Warning: the result of previous trading operations do not guarantee the same results in the future

USDCHF, “US Dollar vs Swiss Franc”

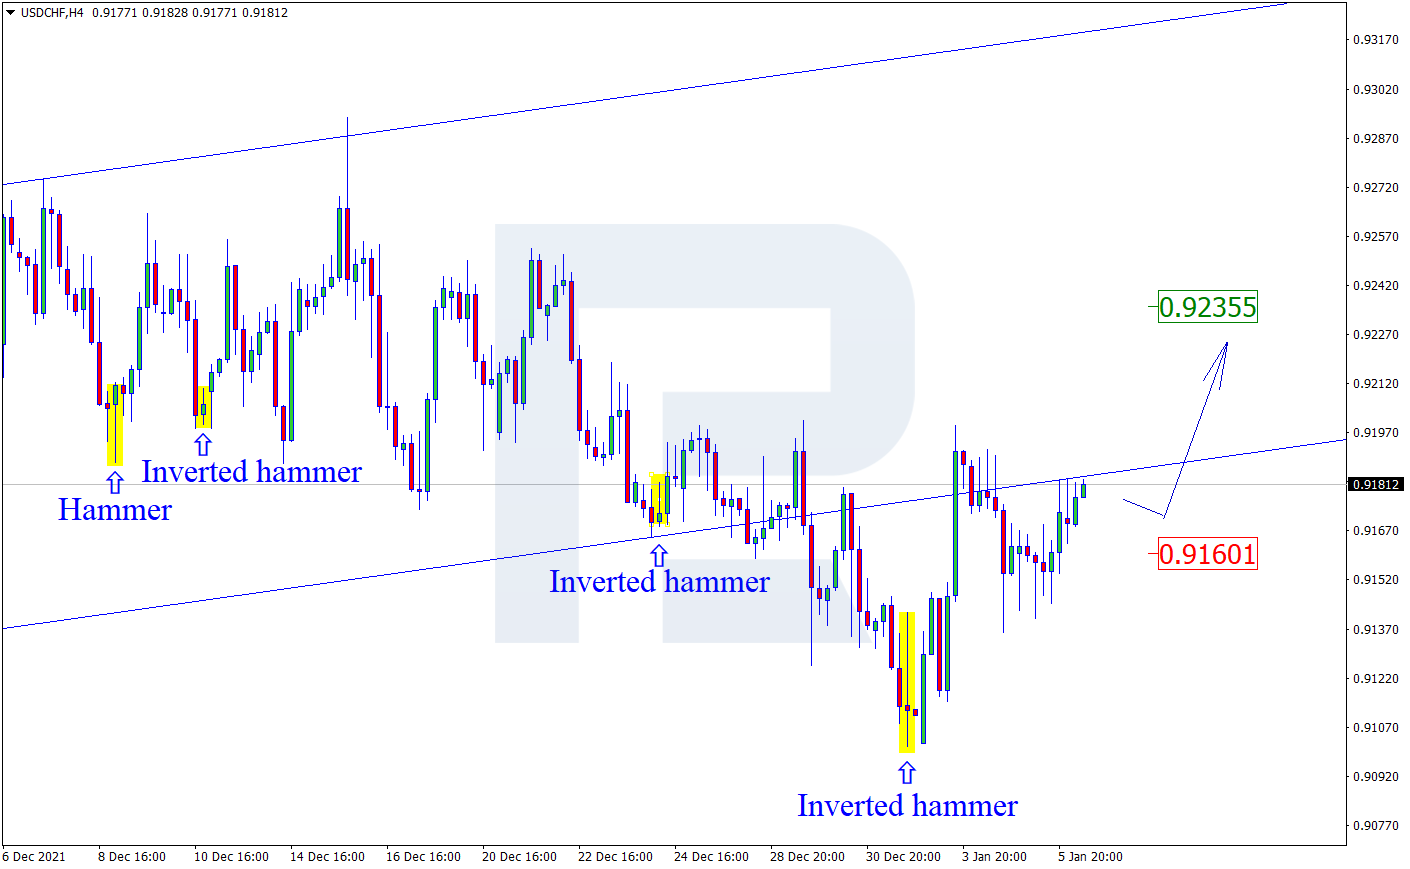
As we can see in the H4 chart, after testing the support area, the pair has formed several reversal patterns, for example, Inverted Hammer. At the moment, USDCHF may reverse in the form of a new rising wave towards the resistance level. In this case, the upside target may be at 0.9235. Still, there might be an alternative scenario, according to which the asset may correct to reach 0.9160 before resuming its ascending tendency.

USDCHF

Article By RoboForex.com

Attention!
Forecasts presented in this section only reflect the author’s private opinion and should not be considered as guidance for trading. RoboForex LP bears no responsibility for trading results based on trading recommendations described in these analytical reviews.

Murrey Math Lines 06.01.2022 (USDJPY, USDCAD)

Article By RoboForex.com

USDJPY, “US Dollar vs. Japanese Yen”

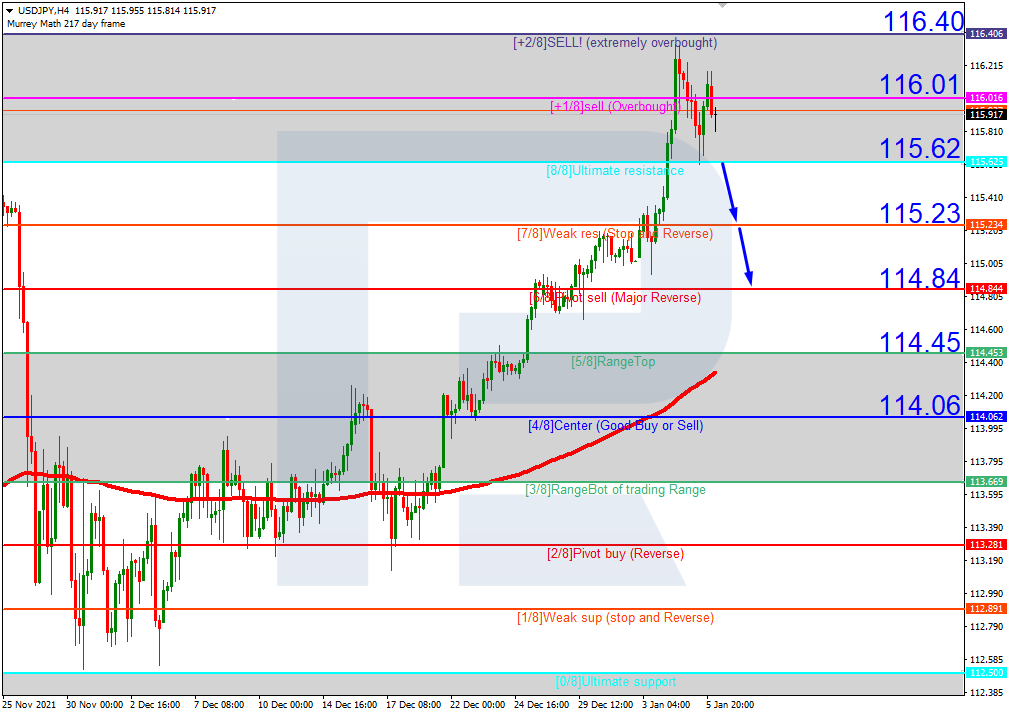
As we can see in the H4 chart, USDJPY is trading within the “overbought area”. In this case, the price is expected to test 8/8, break it, and correct downwards to reach the support at 6/8. However, this scenario may no longer be valid if the price breaks +1/8 to the upside. After that, the instrument may reverse and grow towards the resistance at +2/8.

USDJPY_H4
Risk Warning: the result of previous trading operations do not guarantee the same results in the future

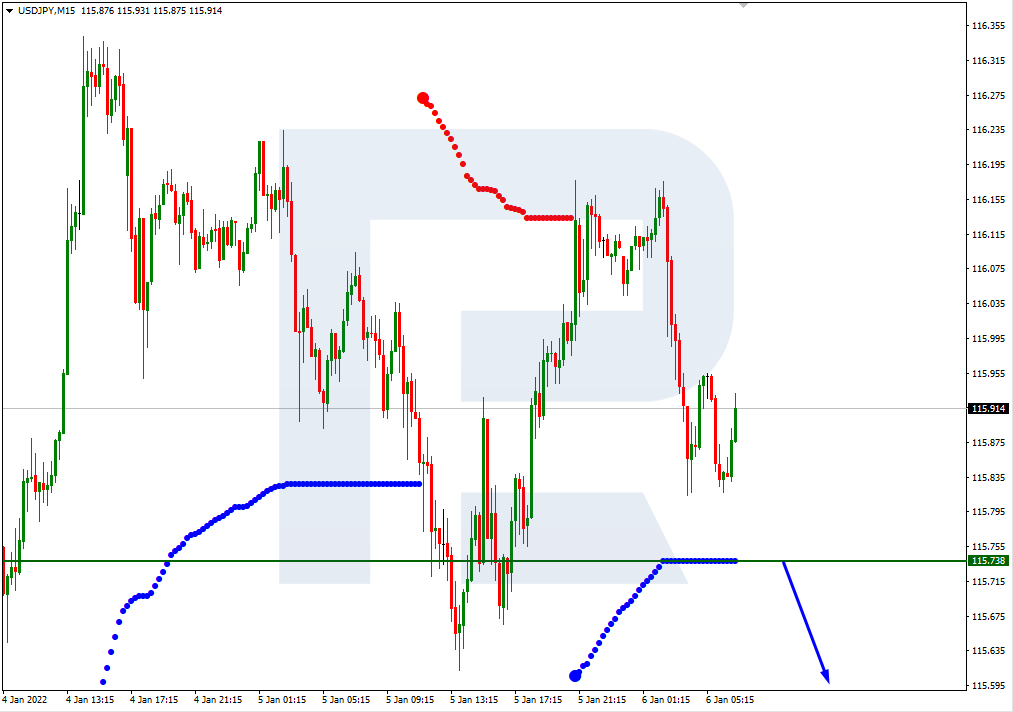
In the M15 chart, the pair may break the downside line of the VoltyChannel indicator and, as a result, continue falling.

USDJPY_M15
Risk Warning: the result of previous trading operations do not guarantee the same results in the future

USDCAD, “US Dollar vs Canadian Dollar”

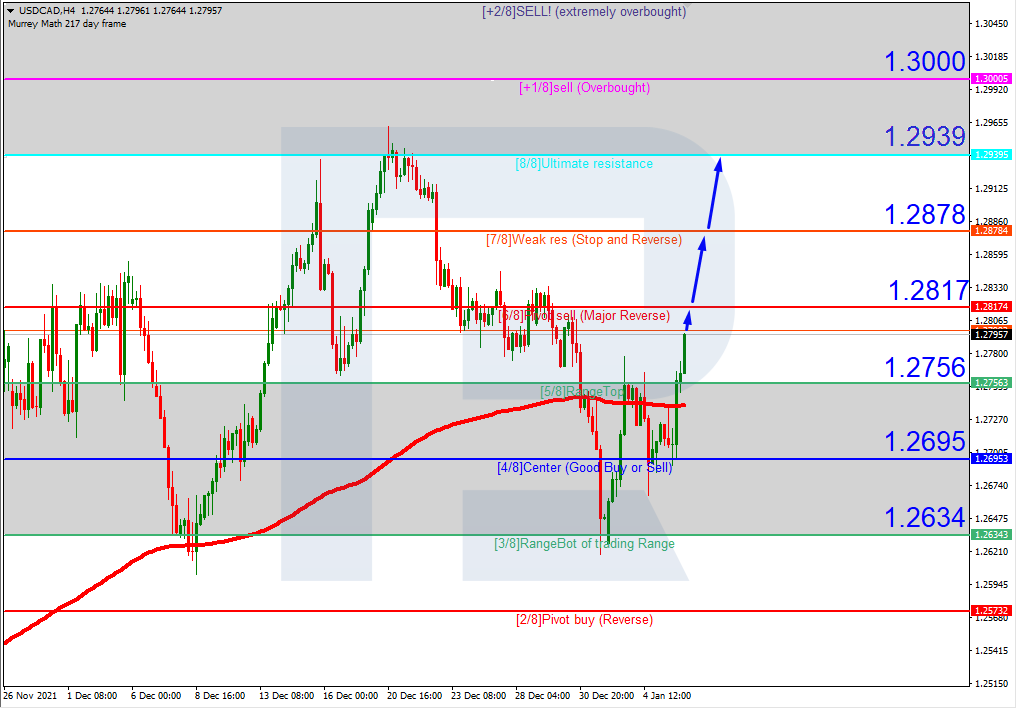
In the H4 chart, after breaking the 200-day Moving Average, USDCAD is trading above it, thus indicating an ascending tendency. In this case, the price is expected to test 6/8, break it, and continue growing towards the resistance at 8/8. Still, this scenario may no longer be valid if the price breaks the support at 5/8 to the downside. After that, the instrument may correct downwards to reach 3/8.

USDCAD_H4
Risk Warning: the result of previous trading operations do not guarantee the same results in the future

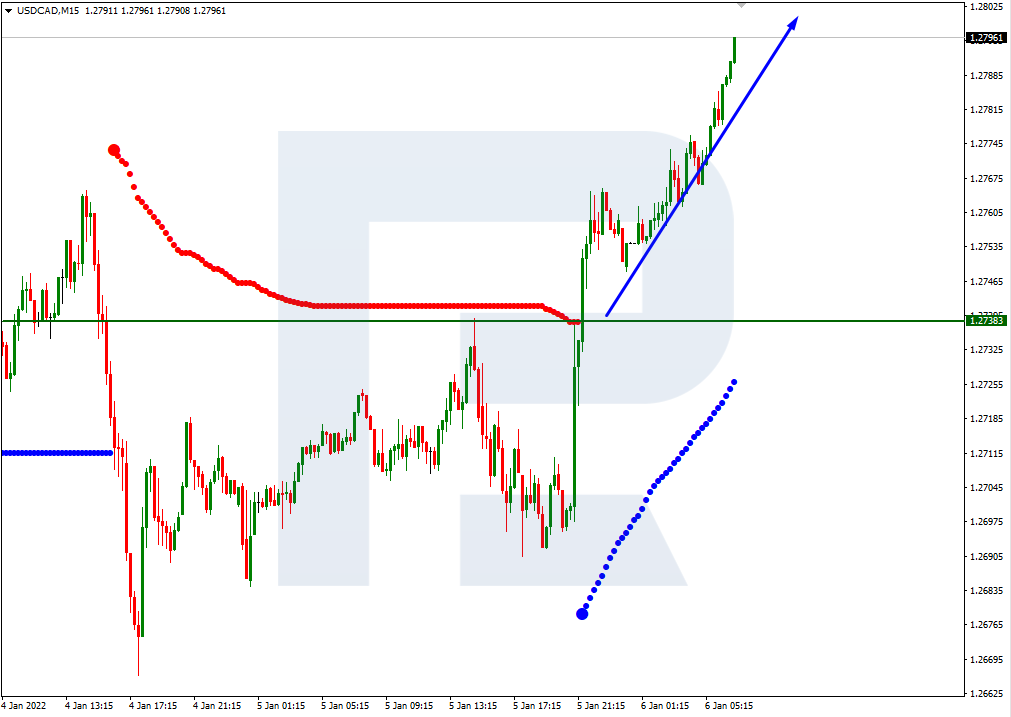
As we can see in the M15 chart, the pair has broken the upside line of the VoltyChannel indicator and, as a result, may continue trading upwards.

USDCAD_M15

Article By RoboForex.com

Attention!
Forecasts presented in this section only reflect the author’s private opinion and should not be considered as guidance for trading. RoboForex LP bears no responsibility for trading results based on trading recommendations described in these analytical reviews.

The Analytical Overview of the Main Currency Pairs on 2022.01.06

by JustForex

The EUR/USD currency pair

Technical indicators of the currency pair:
  • Prev Open: 1.1281
  • Prev Close: 1.1312
  • % chg. over the last day: +0.27%

According to preliminary information, the ECB is ready to decrease its stimulus measures and raise rates if necessary. But that hasn’t happened yet. Given the high probability of the interest rate increase by the Fed in March, the dollar index will keep being stable, which will be negatively reflected in EUR/USD quotes (decrease of EUR/USD).

Trading recommendations
  • Support levels: 1.1288, 1.1271
  • Resistance levels: 1.1336, 1.1368, 1.1369, 1.1436, 1.1535, 1.1613, 1.1667, 1.1717

From the technical point of view, the EUR/USD on the hour time frame is still bullish. After the December FOMC minutes publication, the EUR/USD quotes started a sharp decline, as a more hawkish policy of the Fed led to a rise in the dollar index. Under such market conditions, it is better to consider sell deals from the 1.1336 resistance level, but with additional confirmation. Buy trades can be considered on the lower time frames from the support level 1.1288, but only with additional confirmation in the form of the buyers’ initiative.

Alternative scenario: if the price breaks down through the 1.1288 support level and fixes below, the mid-term uptrend will be broken.

EUR/USD
News feed for 2022.01.06:
  • – US Initial Jobless Claims (w/w) at 15:30 (GMT+2);
  • – US ISM Services PMI (m/m) at 17:00 (GMT+2).

The GBP/USD currency pair

Technical indicators of the currency pair:
  • Prev Open: 1.3528
  • Prev Close: 1.3555
  • % chg. over the last day: +0.20%

The UK is approaching a daily sickness rate of 200,000. But the government is promising not to shut down the country entirely. This is a positive factor since companies have already begun to raise prices for goods and services due to concerns about inflation growth. Any additional restrictions may push inflation higher.

Trading recommendations
  • Support levels: 1.3465, 1.3396, 1.3352, 1.3257, 1.3220
  • Resistance levels: 1.3551, 1.3583, 1.3685

On the hourly time frame, the trend on GBP/USD is still bullish. But yesterday, the price formed a false breakout zone higher, which will now act as a good resistance area. The MACD indicator is still signaling divergence. Under such market conditions, traders should consider buy positions from the 1.3465 support level but only with additional confirmation in the form of a buyers’ initiative. Sell trades can be considered from the resistance level of 1.3551 or 1.3583.

Alternative scenario: if the price breaks down through the 1.3465 support level and consolidates below, the bearish scenario will likely resume.

GBP/USD
News feed for 2022.01.06:
  • – UK Services PMI (m/m) at 11:30 (GMT+2).

The USD/JPY currency pair

Technical indicators of the currency pair:
  • Prev Open: 116.13
  • Prev Close: 116.09
  • % chg. over the last day: -0.03%

Due to the rise in COVID-19 cases, Tokyo may take emergency measures and impose restrictions. Japanese Prime Minister Kishida said yesterday that once the country manages to get COVID-19 under control, the economy will see a vertical increase in all indicators.

Trading recommendations
  • Support levels: 115.64, 115.34, 115.09, 113.74
  • Resistance levels: 116.11, 116.50

The global trend on the USD/JPY currency pair is bullish. The price has started a corrective movement, and this is an excellent opportunity to open buy trades. It is best to look for buy deals from the support levels around the moving average. Sell positions are better to look from the resistance level of 116.11, but only with confirmation and short targets.

Alternative scenario: if the price fixes below 115.09, the uptrend will likely be broken.

USD/JPY
News feed for 2022.01.06:
  • – Japan Services PMI (m/m) at 02:30 (GMT+2).

The USD/CAD currency pair

Technical indicators of the currency pair:
  • Prev Open: 1.2706
  • Prev Close: 1.2755
  • % chg. over the last day: +0.38%

Economists predict three interest rate hikes from the Central Bank of Canada, starting in April. But they are confident that the Canadian economy will show a decline in the first quarter due to the Omicron strain and new restrictions. Fundamentally, both the US Fed and the Central Bank of Canada intend to tighten monetary policy this year, so both currencies will have support from the central banks. As a result, investors should not hope for medium-term trends on the currency pair USD/CAD. In annual terms, quotes will be flat.

Trading recommendations
  • Support levels: 1.2757, 1.2710, 1.2667, 1.2628
  • Resistance levels: 1.2824, 1.2903, 1.2951

From the technical point of view, the USD/CAD currency pair has changed to bullish. After the December FOMC minutes publication, the USD/CAD quotes showed a sharp increase, as a more “hawkish” policy of the Fed led to a rise in the dollar index. The MACD indicator became positive, with no signs of reversal. Under such market conditions, it is better to look for buy trades from the support level 1.2757 or 1.2710, but with an additional confirmation in the form of a buyer’s initiative. Sell trades are best to consider from the resistance levels of higher time frames.

Alternative scenario: if the price breaks down through the 1.2667 support level and fixes below, the downtrend is likely to resume.

USD/CAD
There is no news feed for today.

by JustForex


This article reflects a personal opinion and should not be interpreted as an investment advice, and/or offer, and/or a persistent request for carrying out financial transactions, and/or a guarantee, and/or a forecast of future events.

Major US stock indices began to decline sharply after FOMC minutes

by JustForex

On Wednesday, the US stocks fell sharply after the US Federal Reserve meeting minutes showed that the central bank might raise interest rates earlier than expected. Meanwhile, some Fed officials also warned that the Fed might have to reduce the number of assets on its balance sheet soon after a rate hike. The S&P 500 (US500) and NASDAQ (US100) indices fell sharply after the FOMC minutes were released. The Dow Jones index, which reached a record high at the beginning of the day, also closed lower. By the end of the trading session, the S&P 500 Index (US500) decreased by 1.94%, the Dow Jones Industrial Average (US30) fell by 1.07%, and the Nasdaq Composite Technology Index (US100) lost 3.36%.

The ADP employment report showed that the US private sector added 807,000 jobs (expectation +375,000), but still nearly 4 million below pre-pandemic levels. According to the FOMC minutes, the US labor market is now in a “tight” phase. This week’s investor focus is also on US labor market data. The weekly report on new jobless claims will be released on Thursday, and on Friday, the December non-farm data and unemployment rate will be released.

The World Health Organization (WHO) reported Wednesday 2,294,039 new coronavirus cases worldwide in a 24-hour period. This is the highest daily rate in WHO statistics recorded during the pandemic.

European stock indices mostly rose yesterday despite a decline in business activity in the region and a rise in COVID cases. At the end of the day, French index CAC 40 (FR40) gained 0.81%, German DAX (DE30) added 0.74%, British FTSE 100 (UK100) increased by 0.16%. Spanish IBEX 35 (ES35) was the exception and decreased by 0.06%. European auto manufacturers’ quotes became the leaders of the growth on Wednesday. Renault SA gained 5.3%, Daimler AG added 4%, and Stellantis NV increased by 3.9%. JPMorgan analysts stick to the recommendation to buy all three companies.

But analysts believe that European stock markets will open with a decline on Thursday, which will continue the global sell-off following the release of the “hawkish” December FOMC protocol.

Kazakhstan has declared a state of emergency across the country. An anti-terrorist operation was launched in Almaty. All the banks in Kazakhstan stopped working. Internet access is also restricted. Middle Eastern air carriers cancel flights to Kazakhstan.

Crude oil reserves showed another decline. In the previous week, inventories decreased by 2.14 Mbbl, but less than the expected -3.3 Mbbl. But gasoline reserves increased by more than 10 Mbbl, the biggest weekly increase since April 2020. This indicates that the population does not travel much by car. But this is not surprising, as the rise in incidence increases every day.

On Thursday, Asian stock indices are decreasing during trading amid a decline in the US stock market the day before. Japan’s Nikkei 225 Index (JP225) decreased by 2.88% since the opening, Australia’s ASX 200 (AU200) lost 2.74%, but Hong Kong’s Hang Seng (HK50) feels good, showing an increase of 0.33%.

Main market quotes:

S&P 500 (F) (US500) 4,700.58 −92.96 (−1.94%)

Dow Jones (US30) 36,407.11 −392.54 (−1.07%)

DAX (DE40) 16,271.75 +119.14 (+0.74%)

FTSE 100 (UK100) 7,516.87 +11.72 (+0.16%)

USD Index 96.16 −0.10 (−0.10%)

Important events for today:
  • – Japan Services PMI (m/m) at 02:30 (GMT+2);
  • – UK Services PMI (m/m) at 11:30 (GMT+2);
  • – US Initial Jobless Claims (w/w) at 15:30 (GMT+2);
  • – US ISM Services PMI (m/m) at 17:00 (GMT+2);
  • – US Natural Gas Storage (w/w) at 17:30 (GMT+2).

by JustForex


This article reflects a personal opinion and should not be interpreted as an investment advice, and/or offer, and/or a persistent request for carrying out financial transactions, and/or a guarantee, and/or a forecast of future events.

Equity bulls deflated by hawkish Fed

By Lukman Otunuga Senior Research Analyst, ForexTime

Stock markets are limping into Thursday’s session in a frightened state after the minutes from the December Federal Reserve meeting pointed to a faster than expected hike in interest rates.

Asian stocks flashed red this morning following the heavy selloff on Wall Street overnight as hawkish signals from the FOMC minutes and spread of the Omicron variant sapped investor confidence. Gold has also found itself under pressure with prices struggling to keep above the psychological $1800 support level.  In the FX space, the dollar appreciated as US Treasury yields jumped after the meeting minutes were released.

Given the market reaction to a more hawkish Fed, global equities certainly remain highly sensitive to increased rate hike expectations. With the US December jobs report around the corner, the atmosphere across the board could become tense and nervy as investors adopt a cautious stance. Whatever the outcome on Friday, the first trading week of 2022 has already kicked off with a bang.

It’s all about the US non-farm payrolls

All eyes are now firmly focused on December’s US jobs report which will be released on Friday. The pending data will be heavily scrutinised by investors for key insight into the health of the US labour market and wage growth.

Yesterday, the ADP Employment Report revealed that private sector employment surged by 807,000 in December. This figure smashed market forecasts and was a big jump from the 505,000 witnessed in November. Even though the ADP data is a poor predictor of the key non-farm payrolls report on Friday, markets may be readying themselves for a potential upbeat number. Consensus expects 425,000 jobs  to have been created by the US economy last month, with the unemployment rate falling to 4.1% from 4.2%.

One thing to keep in mind is that the US jobs report is being released at a time when the Fed has signaled interest rate hikes may be more aggressive than expected, amid concerns over soaring inflation. The March Fed meeting is now very much “live” with an 80% chance of an interest rate hike. The general consensus at the Fed also appears to be emerging that the maximum employment goal is now within reach, so NFP may play a big part in validating this thinking.

Should the jobs report exceed market expectations, this is likely to boost confidence in the US economy and reinforce expectations that the Fed will raise interest rates in the Spring. Such a development may result in a stronger dollar while pressuring equity bulls and gold further. Alternatively, a massive payroll miss similar to November may raise questions over the health of the US economy and the Fed’s ability to aggressively raise rates.

Commodity spotlight – Gold

A stronger dollar, hawkish Federal Reserve, and rising treasury yields make a poisonous cocktail for gold. The precious metal is under pressure on the daily charts with prices struggling to keep above $1800 as of writing.

Where the precious metal closes the week is likely to be heavily influenced by the key US jobs data on Friday. A strong report could cripple gold bugs, opening a path lower towards $1786 and $1770. Should $1800 prove to be reliable support, prices may rebound back towards the $1810 and $1831.

Disclaimer: The content in this article comprises personal opinions and should not be construed as containing personal and/or other investment advice and/or an offer of and/or solicitation for any transactions in financial instruments and/or a guarantee and/or prediction of future performance. ForexTime (FXTM), its affiliates, agents, directors, officers or employees do not guarantee the accuracy, validity, timeliness or completeness, of any information or data made available and assume no liability as to any loss arising from any investment based on the same.


Forex-Time-LogoArticle by ForexTime

ForexTime Ltd (FXTM) is an award winning international online forex broker regulated by CySEC 185/12 www.forextime.com

Mid-Week Technical Outlook: Keep An Eye On The Trend

Lukman Otunuga

By Lukman Otunuga Senior Research Analyst, ForexTime

It’s a new year, people!

Another 12 months of exciting opportunities and chances to profit from the financial markets.
I have my technical hat on this evening with a mission to check out various trends using multiple time frame analysis (MTFA). This is a method of analysing long-term, medium-term, and short-term timeframes to achieve an accurate entry or exit when trading the markets.

Yesterday, we discussed how the monetary policy divergence between the Fed and ECB could influence the EURUSD’s outlook this year. On the monthly timeframe, the currency pair remains bearish as there have been consistently lower lows and lower highs. Prices have been trapped within a bearish channel since the start of 2021. However, zooming back all the way to 2013 we can see a bullish channel with strong support around 1.0900. A rebound from this point may encourage a move back towards 1.1400 and 1.1700. Should 1.0900 prove to be unreliable support, a decline back towards 1.0650 could be on the cards.

On the weekly charts, bears remain in the driving seat. A strong weekly close below 1.1400 could spark a selloff towards 1.1130.

Taking a look at the daily, support can be found at 1.1200 and resistance at 1.1370. A breakout could be on the horizon. It will be interesting to see how prices behave around 1.1370, a level where the 50-day Simple Moving Average (SMA) resides. If this level gives way, prices could jump towards 1.1530. Alternatively, a decline towards 1.1200 may signal a decline towards 1.1093.

GBPUSD…time for action?

The GBPUSD remains within a pretty wide range on the monthly charts with support at 1.3300 and resistance at 1.4250. Although bulls staged a strong rebound from the 1.3300 support last month, prices remain a bearish monthly channel. A move towards 1.4250 could become reality if a strong monthly close above 1.3800 is achieved. Should prices sink back under 1.3300, the next key point may be found at 1.2800.

Things are looking interesting on the weekly charts with bulls challenging the 1.3600 weekly resistance. A strong breakout above this point could encourage an incline towards 1.3900. If bulls are unable to crack this resistance, we could see a decline back towards 1.3200.

On the daily charts, prices remain bullish with 1.3600 acting as the first barrier for bulls to break down. Beyond this point, prices may jump towards 1.3700 which can be found below the 200-day Simple Moving Average. Given how there have been consistently higher highs and higher lows with the MACD trading above 0, bulls still have steam to push prices higher. However, if 1.3600 proves to be a tough nut to crack for bulls, the currency pair could decline back toward 1.3450.

Disclaimer: The content in this article comprises personal opinions and should not be construed as containing personal and/or other investment advice and/or an offer of and/or solicitation for any transactions in financial instruments and/or a guarantee and/or prediction of future performance. ForexTime (FXTM), its affiliates, agents, directors, officers or employees do not guarantee the accuracy, validity, timeliness or completeness, of any information or data made available and assume no liability as to any loss arising from any investment based on the same.


Forex-Time-LogoArticle by ForexTime

ForexTime Ltd (FXTM) is an award winning international online forex broker regulated by CySEC 185/12 www.forextime.com

Fibonacci Retracements Analysis 05.01.2022 (GBPUSD, EURJPY)

Article By RoboForex.com

GBPUSD, “Great Britain Pound vs US Dollar”

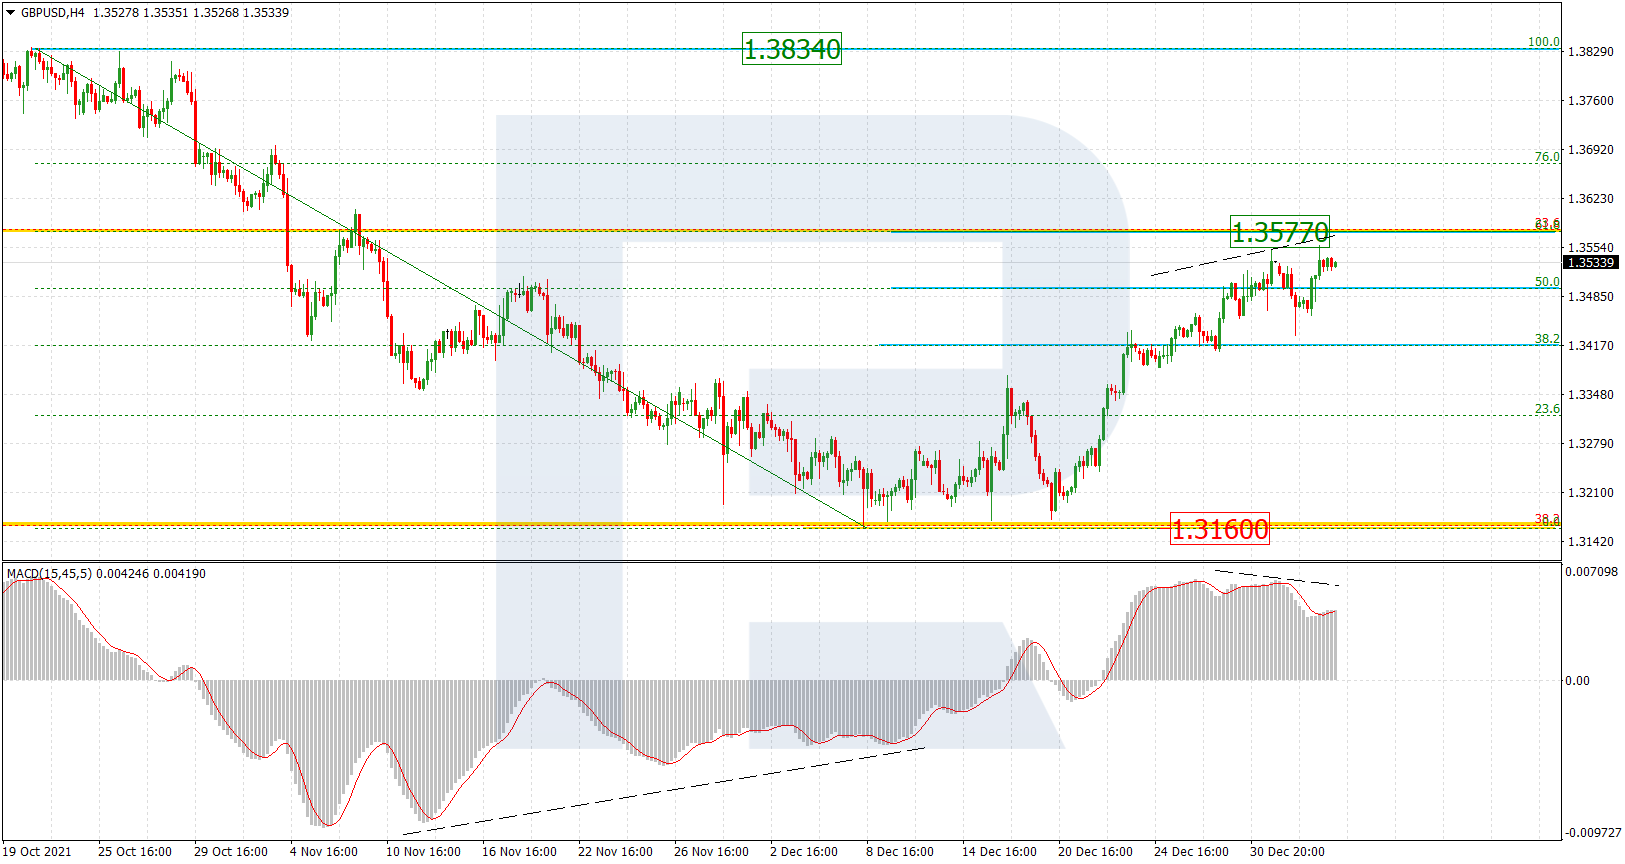
As we can see in the H4 chart, GBPUSD has reached 50.0% fibo after convergence on MACD and may boost its growth towards 61.8% fibo at 1.3577. After that, the pair may start a new decline towards the key support at 1.3160. The key resistance is the local high at 1.3834.

GBPUSD_H4
Risk Warning: the result of previous trading operations do not guarantee the same results in the future

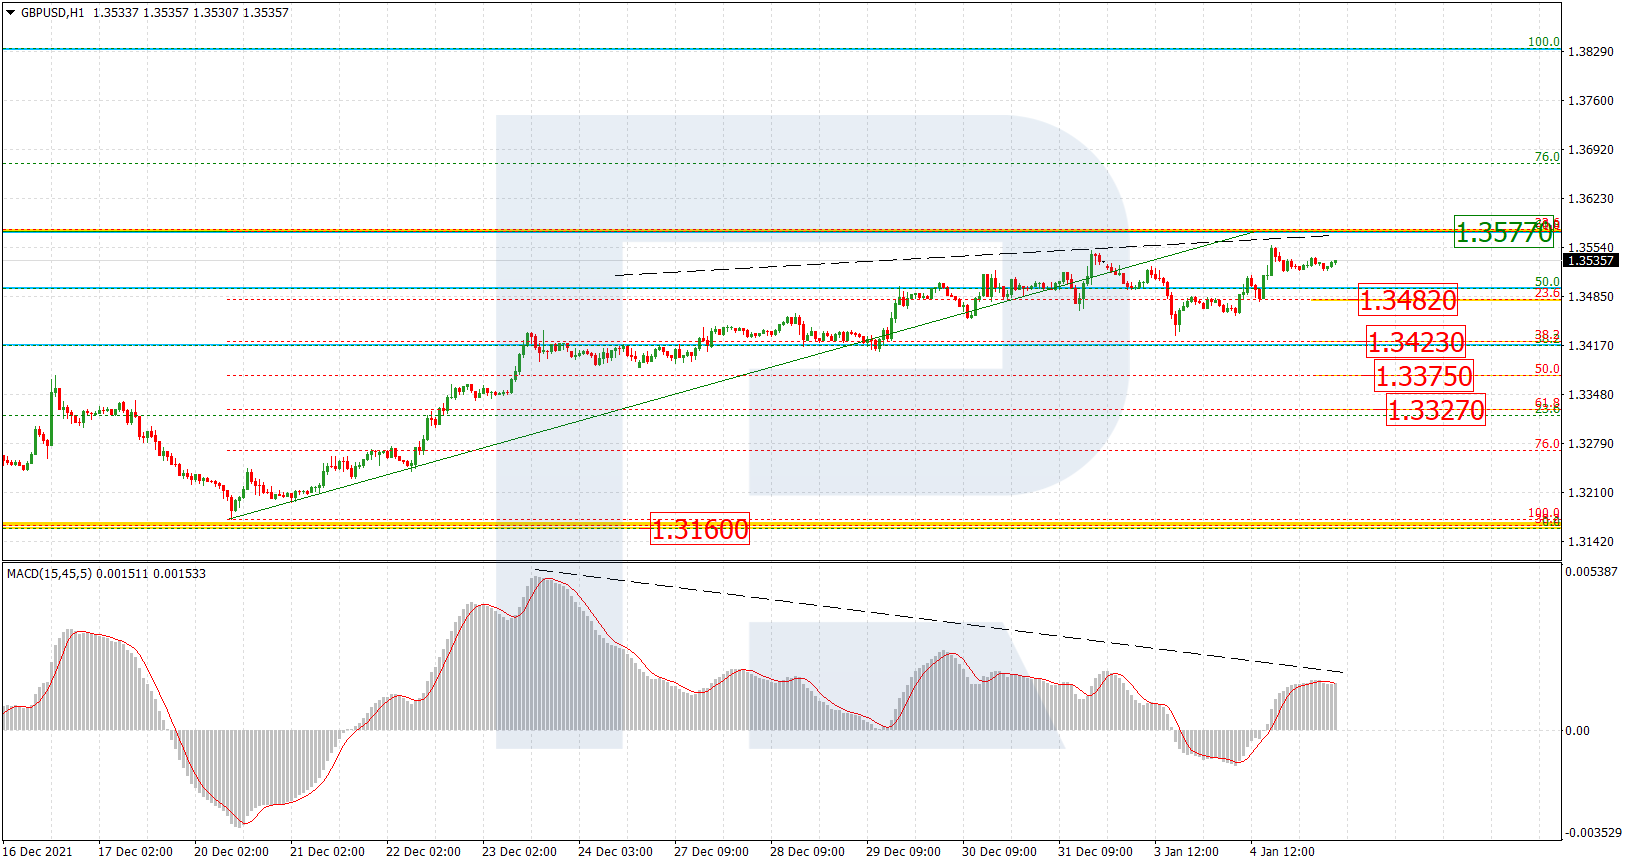
The H1 chart shows that the price is correcting to the downside after local divergence on MACD; the targets are 23.6%, 38.2%, 50.0%, and 61.8% fibo at 1.3482, 1.3423, 1.3375, and 1.3327 respectively.

GBPUSD_H1
Risk Warning: the result of previous trading operations do not guarantee the same results in the future

EURJPY, “Euro vs. Japanese Yen”

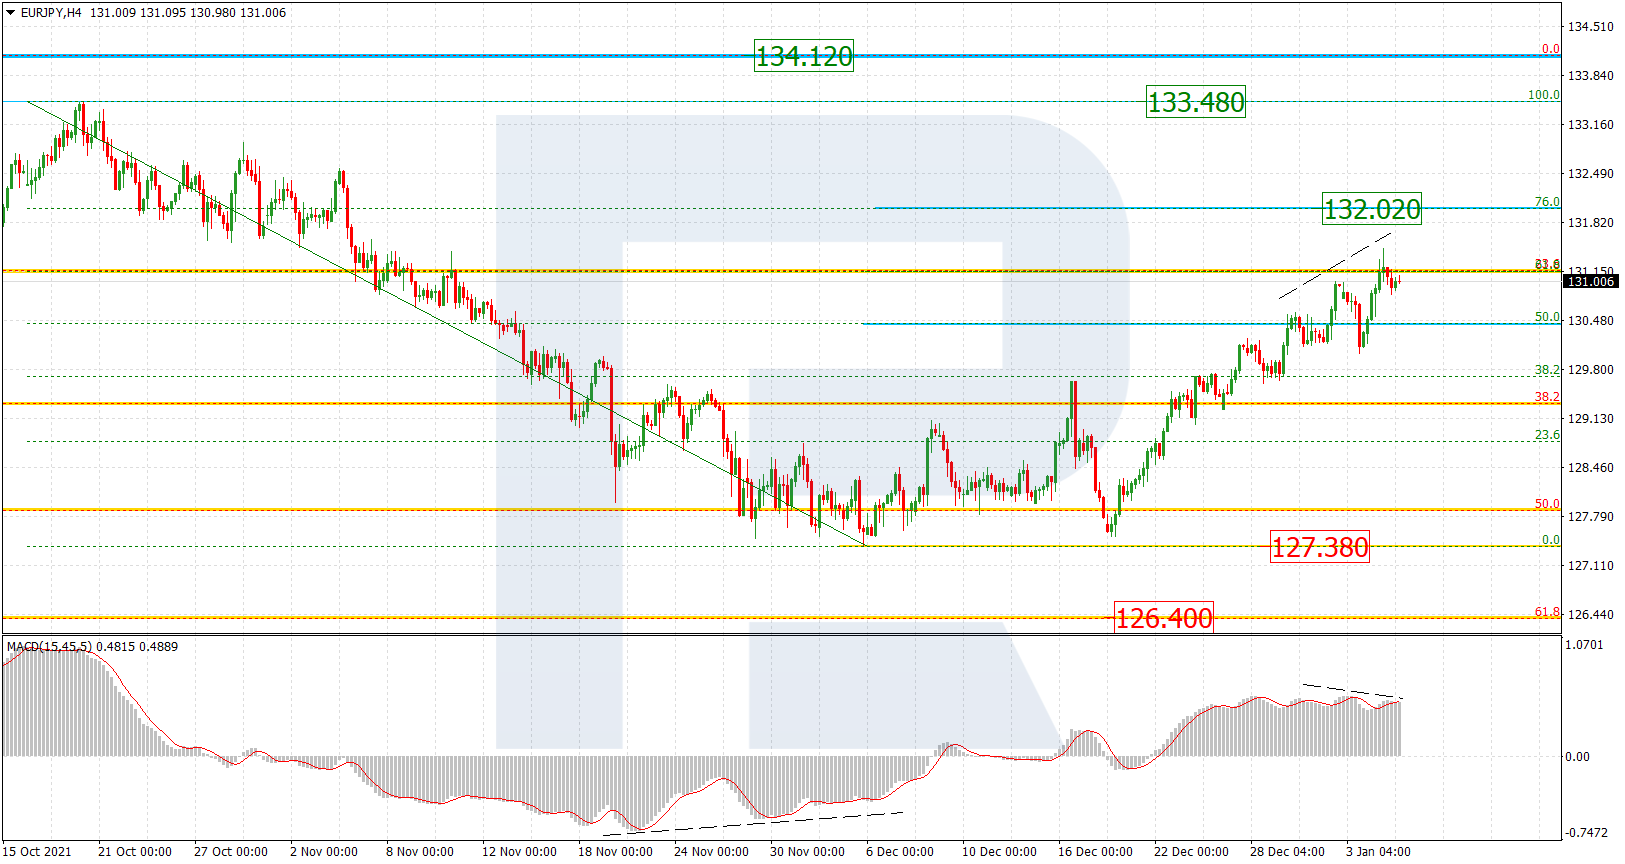
As we can see in the H4 chart, EURJPY is correcting upwards after convergence on MACD; it has already reached 61.8% fibo and may later continue towards 76.0% fibo at 132.02. After this pullback is over, the asset may resume falling to break the low at 127.38 and then reach the long-term 61.8% fibo at 126.40. The resistance is the high at 133.48.

EURJPY_H4
Risk Warning: the result of previous trading operations do not guarantee the same results in the future

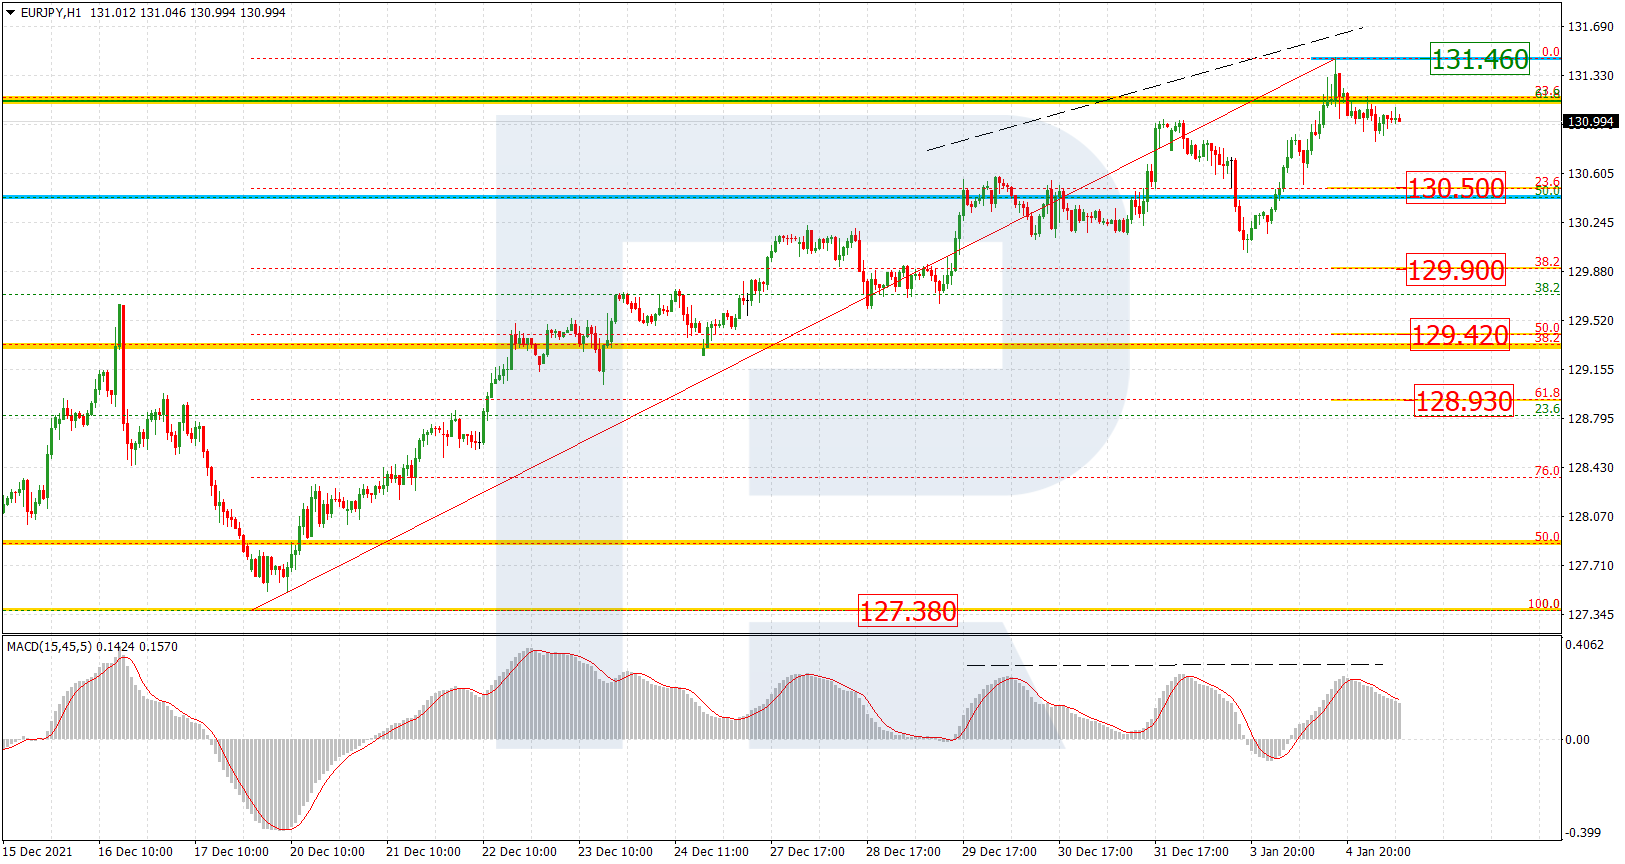
The H1 chart shows that the pair may resume falling after divergence on MACD; the downside targets are 23.6%, 38.2%, 50.0%, and 61.8% fibo at 130.50, 129.90, 129.42, and 128.93 respectively. The resistance is the high at 131.46.

EURJPY_H1

Article By RoboForex.com

Attention!
Forecasts presented in this section only reflect the author’s private opinion and should not be considered as guidance for trading. RoboForex LP bears no responsibility for trading results based on trading recommendations described in these analytical reviews.

Japanese Candlesticks Analysis 05.01.2022 (XAUUSD, NZDUSD, GBPUSD)

Article By RoboForex.com

XAUUSD, “Gold vs US Dollar”

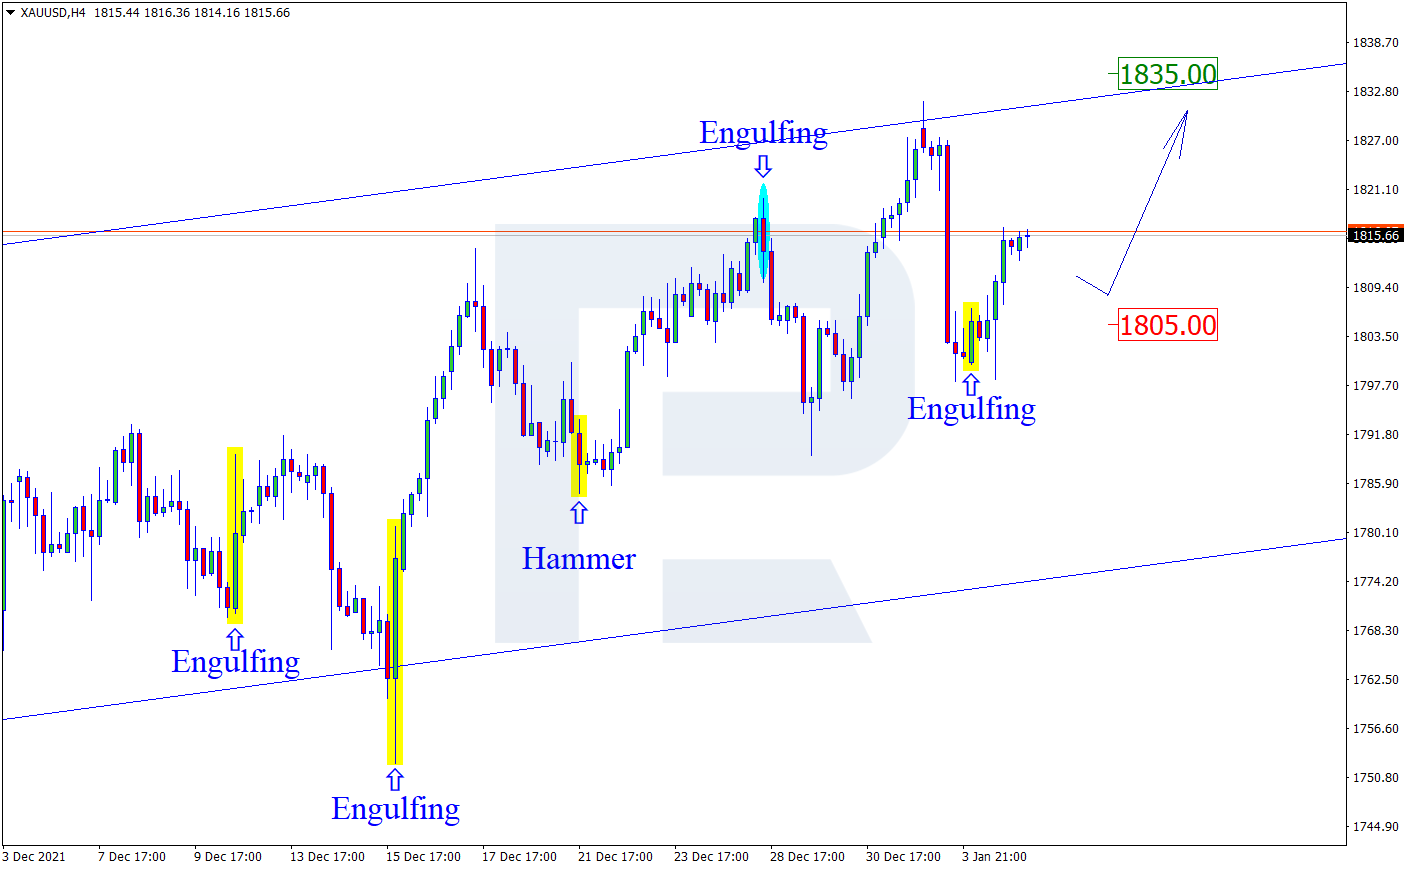
As we can see in the H4 chart, the asset is still trading upwards. After forming an Engulfing reversal pattern not far from the support level, XAUUSD is reversing and may continue forming its ascending impulse. In this case, the upside target may be the resistance area at 1835.50. At the same time, an opposite scenario implies that the price may return to 1805.00 before resuming its ascending tendency.

GOLD
Risk Warning: the result of previous trading operations do not guarantee the same results in the future

NZDUSD, “New Zealand vs US Dollar”

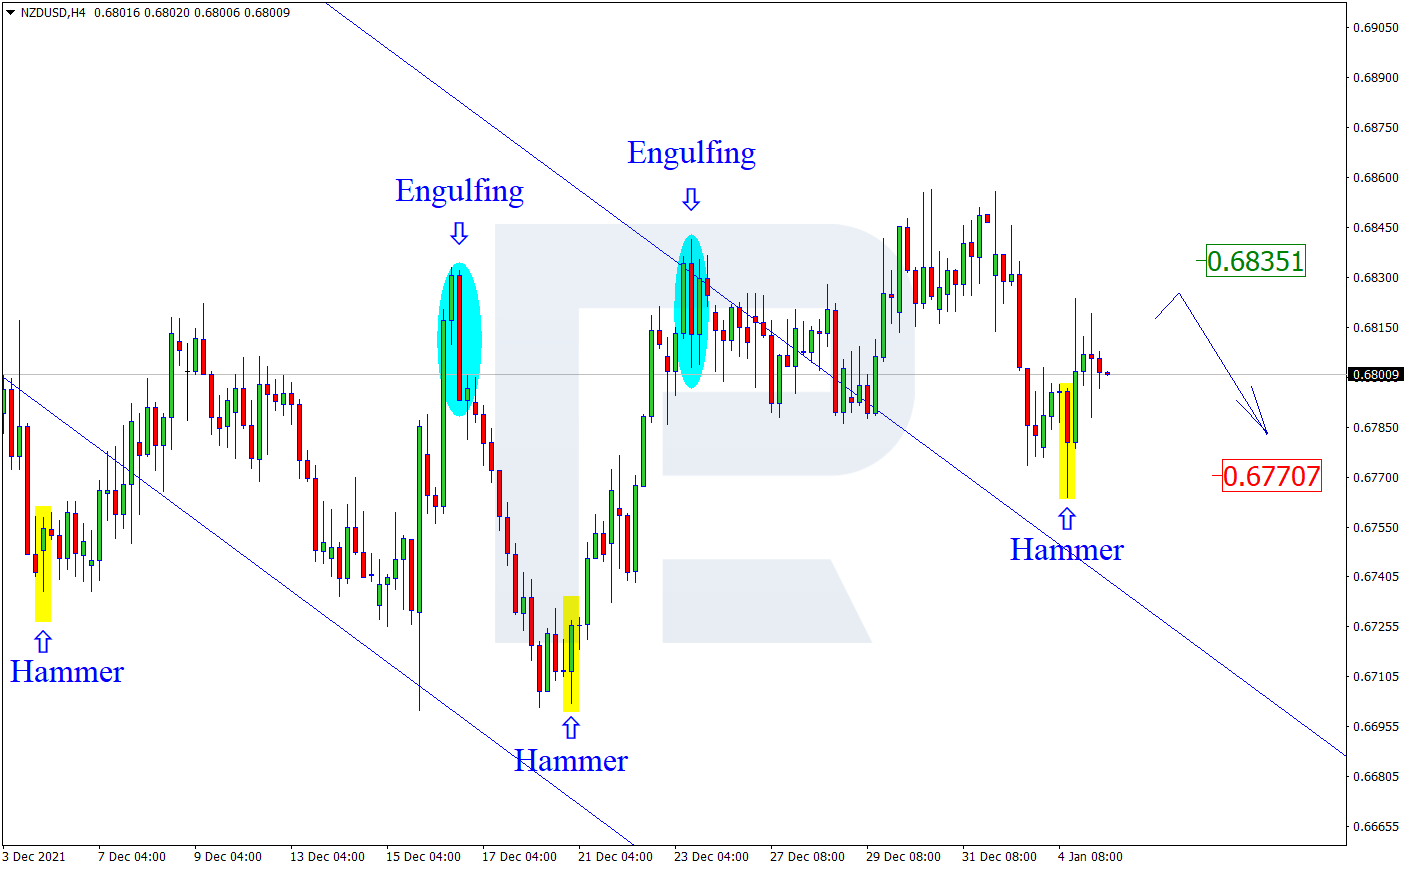
As we can see in the H4 chart, NZDUSD has formed a Hammer reversal pattern close to the support area. At the moment, the asset is reversing and may form a new ascending impulse towards the resistance level. In this case, the upside target may be at 0.6835. After that, the asset may rebound from this level and resume moving downwards. However, an alternative scenario implies that the price may fall to reach 0.6700 without any corrections towards the resistance level.

NZDUSD
Risk Warning: the result of previous trading operations do not guarantee the same results in the future

GBPUSD, “Great Britain Pound vs US Dollar”

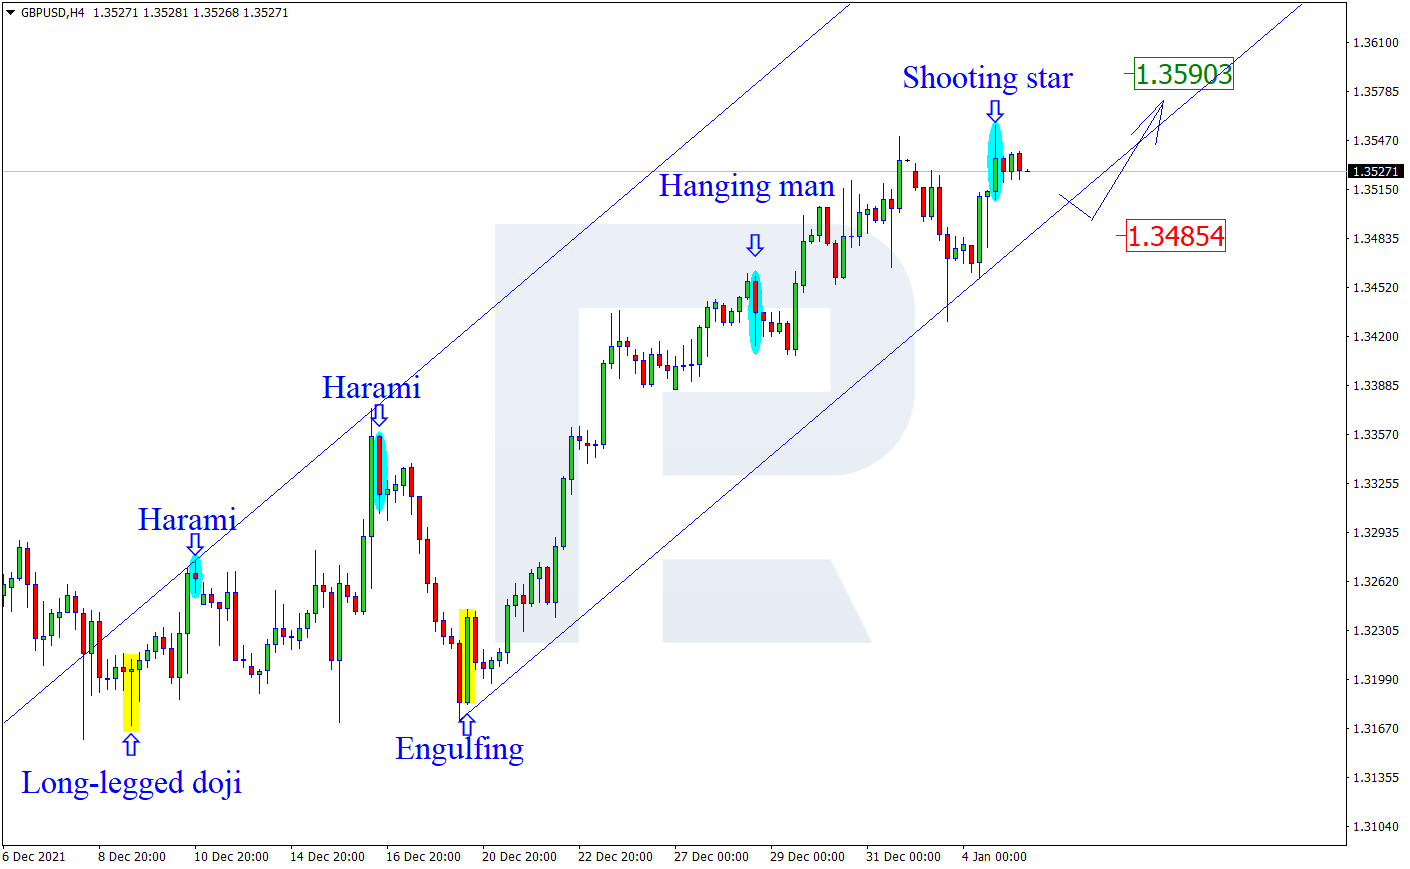
As we can see in the H4 chart, GBPUSD has formed a Shooting Star reversal pattern near the resistance area. At the moment, the pair may reverse and start a new pullback. In this case, the downside correctional target may be at 1.3485. After testing the support level, the market may rebound from it and resume trading upwards. Still, there might be an alternative scenario, according to which the asset may continue growing to reach 1.3590 without any corrections towards the support level.

GBPUSD

Article By RoboForex.com

Attention!
Forecasts presented in this section only reflect the author’s private opinion and should not be considered as guidance for trading. RoboForex LP bears no responsibility for trading results based on trading recommendations described in these analytical reviews.

The Analytical Overview of the Main Currency Pairs on 2022.01.05

by JustForex

The EUR/USD currency pair

Technical indicators of the currency pair:
  • Prev Open: 1.1296
  • Prev Close: 1.1287
  • % chg. over the last day: -0.07%

In November, German retail sales increased unexpectedly to a record annual high despite renewed COVID-19 restrictions that are holding back a recovery in consumer activity in Europe’s largest economy. The unemployment rate in Germany fell from 5.3% to 5.2%.

Trading recommendations
  • Support levels: 1.1288, 1.1271
  • Resistance levels: 1.1336, 1.1368, 1.1369, 1.1436, 1.1535, 1.1613, 1.1667, 1.1717

From the technical point of view, the EUR/USD on the hour time frame is still bullish. Due to the sharp drop in the quotes, there is a high probability that the trend will change back to bearish. Yesterday, the price tried to break through the priority change level but failed to consolidate lower. The buyers managed to push the price higher. Under such market conditions, it is better to consider sell deals from the 1.1336 resistance level, but with additional confirmation. Buy trades can be considered on the lower time frames from the support level 1.1288, but only with additional confirmation in the form of the buyers’ initiative.

Alternative scenario: if the price breaks down through the 1.1288 support level and fixes below, the mid-term uptrend will be broken.

EUR/USD
News feed for 2022.01.05:
  • – German Services PMI (m/m) at 10:55 (GMT+2);
  • – Eurozone Services PMI (m/m) at 11:00 (GMT+2);
  • – US ADP Non-Farm Employment Change (m/m) at 15:15 (GMT+2);
  • – US FOMC Meeting Minutes at 21:00 (GMT+2).

The GBP/USD currency pair

Technical indicators of the currency pair:
  • Prev Open: 1.3471
  • Prev Close: 1.3528
  • % chg. over the last day: +0.42%

In December, manufacturing growth in the UK was slightly faster than initially anticipated, and supply problems related to the pandemic eased slightly. Rob Dobson, director of IHS Markit, said the economic recovery is still lower than in mid-2021 due to continued supply chain constraints and weak exports, which have been affected by Brexit-related problems and the prospect of further COVID-19 restrictions.

Trading recommendations
  • Support levels: 1.3465, 1.3396, 1.3352, 1.3257, 1.3220
  • Resistance levels: 1.3549, 1.3575, 1.3685

On the hourly time frame, the trend on GBP/USD is still bullish. The price is now trading in a wide corridor. The MACD indicator is still signaling divergence. Under such market conditions, traders should consider buy positions from the 1.3465 support level but only with additional confirmation in the form of a buyers’ initiative. Sell trades can be considered from the resistance level of 1.3549, but only after a false breakout.

Alternative scenario: if the price breaks down through the 1.3396 support level and consolidates below, the bearish scenario will likely resume.

GBP/USD
There is no news feed for today.

The USD/JPY currency pair

Technical indicators of the currency pair:
  • Prev Open: 115.31
  • Prev Close: 116.12
  • % chg. over the last day: +0.70%

The Japanese yen fell to a 5-year low against the dollar. The medium-term uptrend on the USD/JPY currency pair will continue as the monetary policies of the Japanese and US central banks are now diametrically opposed. The tightening policy of the US Federal Reserve will help the dollar index strengthen, while the easing stimulation policy of the Central Bank of Japan will make the yen weaker.

Trading recommendations
  • Support levels: 115.78, 115.34, 115.09, 113.74
  • Resistance levels: 116.50

The global trend on the USD/JPY currency pair is bullish. Yesterday, the price easily broke through the daily resistance level and fixed higher. But at the moment, the price strongly deviated from the average values, so it is better to consider the buy deals either on the lower time frames or wait for the pullback to the support levels near the moving average. It is better to look for sell positions from the next resistance level of 116.50.

Alternative scenario: if the price fixes below 115.09, the uptrend will likely be broken.

USD/JPY
There is no news feed for today.

The USD/CAD currency pair

Technical indicators of the currency pair:
  • Prev Open: 1.2741
  • Prev Close: 1.2703
  • % chg. over the last day: -0.30%

In December, Canada’s manufacturing sector activity grew at its slowest pace in five months as material shortages, and delivery delays held back output. Canada’s PMI for the manufacturing sector declined to 56.5 from 57.2 in November. A rapidly spreading variant of the Omicron coronavirus could be an additional challenge for the industry. But since the Canadian dollar is a commodity currency, rising energy prices positively affect the national exchange rate.

Trading recommendations
  • Support levels: 1.2667, 1.2628
  • Resistance levels: 1.2723, 1.2770, 1.2824, 1.2903, 1.2951

From the technical point of view, the USD/CAD currency pair trend is bearish. The sellers managed to protect the priority change level. The MACD indicator has become inactive. Under such market conditions, it is better to look for sell deals from the resistance levels near the moving average. Buy trades can be considered from the support level of 1.2667, but with additional confirmation in the form of a buyers’ initiative.

Alternative scenario: if the price breaks out through the 1.2770 resistance level and fixes above, the downtrend will likely be broken.

USD/CAD
News feed for 2022.01.05:
  • – Canada Building Permits (m/m) at 15:30 (GMT+2);
  • – US Crude Oil Reserves (w/w) at 17:30 (GMT+2).

by JustForex


This article reflects a personal opinion and should not be interpreted as an investment advice, and/or offer, and/or a persistent request for carrying out financial transactions, and/or a guarantee, and/or a forecast of future events.