Here’s what really drives the trends of global stock markets
By Elliott Wave International
Let’s first state the obvious: war is tragic as it brings death and destruction.
But does war make the stock market go down?
Many observers seem to believe so. Here are some Feb. 22 headlines:
U.S. stocks fall sharply as Russia sends troops into breakaway Ukraine regions (Marketwatch)
Stocks fall as Russia, Ukraine fears intensify (Reuters)
The Russia Issue Is Hurting the Stock Market. (Barron’s)
The “full scale” Russian invasion of Ukraine began the next evening (Feb. 23), U.S. time.
Certainly, the stock market was headed for a big fall on Thurs., Feb. 24, or so the conventional wisdom goes.
Yes, trading was highly volatile, but by the close on Feb. 24, the NASDAQ Composite was up 3.34%. And, even though the Dow had been lower by 859 points, the senior index managed to close in positive territory by 92 points.
The next day (Fri., Feb. 25), the Dow closed higher by 835 points, even as the war intensified. And, as of this writing intraday on Feb. 28, the S&P 500 went from trading in negative territory to the plus column.
This positive market action in the face of a major global conflict may seem like a head-scratcher to many observers, yet Elliott Wave International has long held that news and events — no matter how major — do not determine the stock market’s trend.
Indeed, history shows that the stock market behaved differently during four major wars.
These charts and commentary are from Robert Prechter’s landmark book, The Socionomic Theory of Finance:
Figure 12 shows a time of war when stock prices (normalized for inflation) rose, then fell; Figure 13 shows a time when they fell, then rose; Figure 14 shows a time when they rose throughout; and Figure 15 shows a time when they fell throughout the hottest half (1965-1975) of a twenty-year conflict. Who wins the war doesn’t seem to matter. A group of allies won World War I as stock values reached fourteen-year lows; and nearly the same group of allies won World War II as stock values neared fourteen-year highs.
Many market observers also assume that economic numbers, OPEC’s actions, elections, earthquakes and many other events outside of the market cause the stock market to go up or down.
However, just like with war, the evidence shows that this is simply not the case. In other words, events — whether positive or negative — do not reverse the established trend that was already underway before the event.
The real driver of stock markets around the globe is the Wave Principle, which reflects the repetitive, hence, predictable patterns of investor psychology.
Delve into the details of the Wave Principle by reading Frost & Prechter’s Wall Street classic, Elliott Wave Principle: Key to Market Behavior.
Here’s a quote from the book:
The Wave Principle is governed by man’s social nature, and since he has such a nature, its expression generates forms. As the forms are repetitive, they have predictive value.
Sometimes the market appears to reflect outside conditions and events, but at other times it is entirely detached from what most people assume are causal conditions. The reason is that the market has a law of its own. It is not propelled by the external causality to which one becomes accustomed in the everyday experiences of life. The path of prices is not a product of news. Nor is the market the cyclically rhythmic machine that some declare it to be. Its movement reflects a repetition of forms that is independent both of presumed causal events and of periodicity.
The market’s progression unfolds in waves. Waves are patterns of directional movement.
Good news: You can read the entire online version of the book for free.
That’s right — all that’s required for free access to this definitive text on the Wave Principle is a Club EWI membership.
Club EWI is the world’s largest Elliott wave educational community and is free to join. As a Club EWI member, you’ll enjoy complimentary access to a wealth of Elliott wave resources on investing and trading without any obligation.
This article was syndicated by Elliott Wave International and was originally published under the headline Is War Negative for the Stock Market?. EWI is the world’s largest market forecasting firm. Its staff of full-time analysts led by Chartered Market Technician Robert Prechter provides 24-hour-a-day market analysis to institutional and private investors around the world.
One afternoon, a dozen Arizona State University students gathered to spend the morning cutting cardboard, taping fans and assembling filters in an effort to build 125 portable air purifiers for local schools. That same morning, staff members at a homeless shelter in Los Angeles were setting up 20 homemade purifiers of their own, while in Brookline, Massachusetts, another DIY air purifier was whirring quietly in the back of a day care classroom as children played.
The technology in all three cases – an unassuming duct tape-and-cardboard construction known as a Corsi-Rosenthal box – is playing an important part in the fight against COVID-19. The story of how it came to be also reveals a lot about communities as sources of innovation and resilience in the face of disasters.
A do-it-yourself air purifier in use in a classroom. Douglas Hannah, CC BY-ND
A simple technology with a big effect
As it became clear that COVID-19 was spread through airborne transmission, people started wearing masks and building managers rushed to upgrade their ventilation systems. This typically meant installing high-efficiency HEPA filters. These filters work by capturing virus-laden particles: Air is forced into a porous mat, contaminants are filtered out, and clean air passes through.
The efficacy of a building’s ventilation system is governed by two factors, though, not just the quality of the filters. The amount of air moved through the ventilation systems matters as well. Experts typically recommend five to six air changes per hour in shared spaces, meaning the entire volume of air in a room is replaced every 45 minutes. Systems in many older buildings can’t manage this volume, however.
Portable air filters are an option for augmenting ventilation systems, but they typically cost hundreds of dollars, which puts them out of range for schools and other public spaces that face budget constraints.
This is where the Corsi-Rosenthal box comes in. It’s a cube consisting of four to five off-the-shelf furnace filters topped by a standard box fan blowing outward. Once sealed together with tape, it can sit on a floor, shelf or table. The fan draws air through the sides of the cube and out the top. The units are simple, durable and easy to make, and are more effective than simply placing a single filter in front of a box fan. It usually takes 40 minutes, minimal technical expertise and US$60 to $90 in materials that are available from any home supply store.
Building a Corsi-Rosenthal box portable air filter comes down to duct-taping together a set of furnace filters and a box fan. Douglas Hannah, CC BY-ND
Despite this simplicity, though, these homemade units are extremely effective. When used in a shared space like a classroom or hospital ward, they can supplement existing ventilation and remove airborne contaminants, including smoke and virus-laden particles. A raft of recent peer-reviewed research has found portable air purifiers can dramatically reduce aerosol transmission. Other preprint and under-review studies have found Corsi-Rosenthal boxes perform as well as professional units at a fraction of the cost.
Origins of the Corsi-Rosenthal box
The formal story of the Corsi-Rosenthal box began in August 2020, when Richard Corsi, an air quality expert and now dean at the University of California, Davis, pitched the idea of building cheap box-fan air filters on Twitter. Jim Rosenthal, the CEO of a Texas-based filter company, had been playing around with a similar idea and quickly built the first prototype.
Within days, tinkerers and air quality engineers alike were constructing their own Corsi-Rosenthal boxes and sharing the results on social media. A vibrant conversation emerged on Twitter, blending sophisticated technical analysis from engineers with the insight and efforts of nonspecialists.
By December, hundreds of people were making Corsi-Rosenthal boxes, and thousands more had read press coverage in outlets like Wired. In different corners of the world, people tweaked designs based on the availability of supplies and different needs. Their collective improvements and adaptations were documented by dedicated websites and blogs, as well as news reports.
In some cases, design tweaks proved to be influential. In November 2020, for example, a homeowner in North Carolina discovered an issue with air being drawn back in through the corners of the most commonly used square fans. Subsequent testing by air quality experts showed that adding a shroud to the fan increased efficiency by as much as 50%.
Analyzing social media and news coverage gives a sense of the scale of the Corsi-Rosenthal box phenomenon. As of January 2022, more than 1,000 units were in use in schools, with thousands more in homes and offices. More than 3,500 people had used the hashtag #corsirosenthalbox on Twitter, and tens of thousands more contributed to the online conversation. News articles and explainer videos on YouTube had collectively accumulated more than 1.9 million views.
Communities as sources of innovation
The story of the Corsi-Rosenthal box is part of a broader story of the grassroots response to the COVID-19 pandemic. The early days of the pandemic did more than just take a terrible toll on people. They also galvanized a massive entrepreneurial effort, with tens of thousands of everyday citizens lending their hands to design and produce the critical medical supplies and personal protective equipment that was suddenly needed.
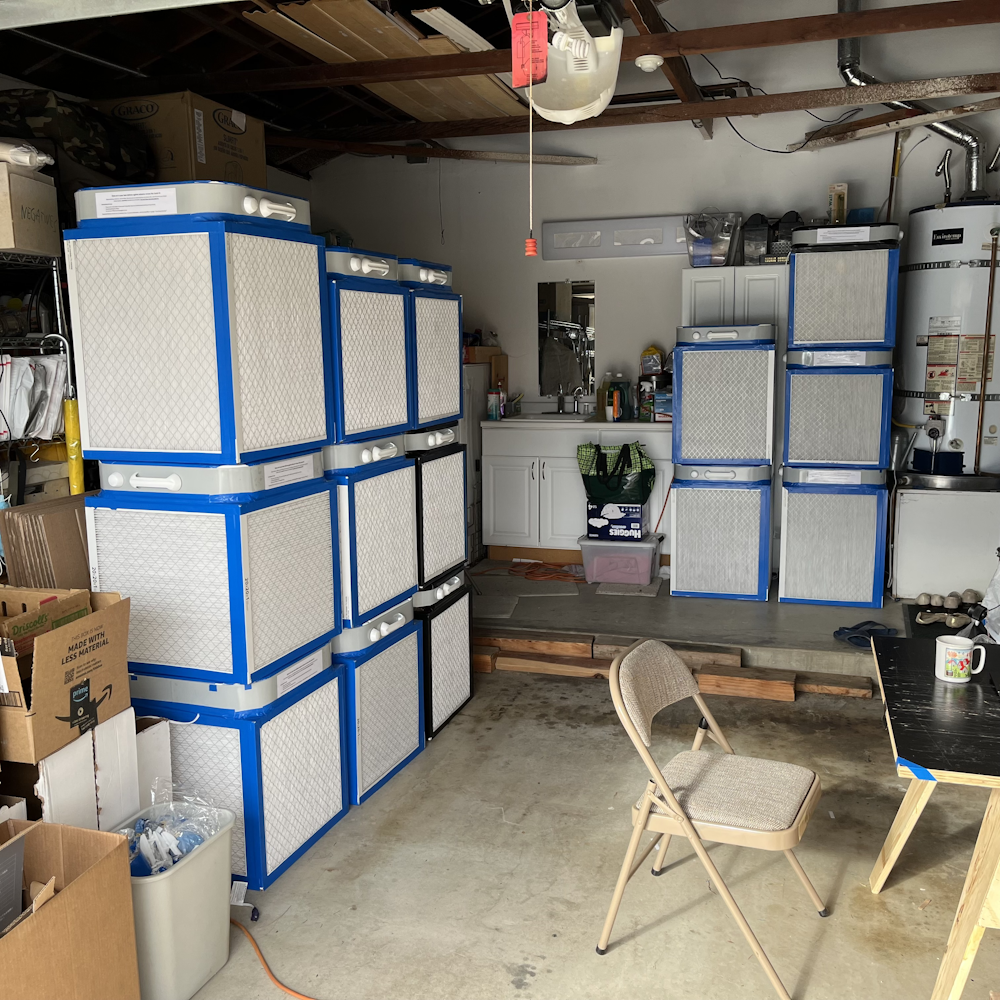
Corsi-Rosenthal boxes assembled and awaiting delivery to a homeless shelter in California. Douglas Hannah, CC BY-ND
My research team has been tracking these efforts. Through dozens of interviews and months of archival research, we’ve built a database of more than 200 startups – formal and informal, nonprofit and for-profit – whose activities ranged from designing oxygen concentrators to 3D printing face shields to building UV disinfection rooms. The picture of innovation that emerges is a far cry from the traditional lab coats and middle managers image that is commonly associated with new technologies.
First, few of the innovations we’ve tracked were actually invented by a single person, or even a single team. Rather, they were the joint project of broad networks of individual contributors from different backgrounds and organizations. This breadth is important because it brings more knowledge and more diverse perspectives. It can also be helpful for tapping existing knowledge. For example, as Corsi-Rosenthal boxes gained traction, the community was able to draw on earlier iterations that had been developed to help with wildfire smoke.
Second, the innovation process lacked hierarchical control. There was no single person directing where or how the technology was used. This lack of control made it easier to experiment and adapt to local conditions. One example is the development of oxygen concentrators for use in hospitals in India. Realizing that existing Western technologies failed frequently in the more humid operating environment typical of India, teams of innovators rallied to develop and share improved open-source designs.
Third, these communities shared knowledge online. This allowed individual contributors to communicate directly and share ideas, which helped knowledge spread rapidly through the network. It also meant that knowledge was more readily accessible. The detailed designs and test results from air quality engineers working on Corsi-Rosenthal boxes were readily available to anyone in the community.
Also, most of the organizations we tracked used Facebook, Twitter and Slack as tools to manage collaboration within and between organizations. As I and others have argued, this gives grassroots innovation tremendous promise – especially in a world where large-scale disruptions like a pandemic are increasingly common.
Pitfalls of grassroots innovation
Despite this promise, there are areas in which grassroots innovation communities falter. One challenge is a lack of technological sophistication and resources. While some of the communities in our study produced remarkably complex devices, the greatest contribution was in far simpler products like face shields and surgical gowns.
Then there are rules and regulations. Even when grassroots communities can produce safe and effective innovations, existing rules may not be ready to receive them. Some hospitals were unable to accept personal protective equipment provided by the community during the pandemic because of inflexible procurement policies, and today some schools continue to prohibit Corsi-Rosenthal boxes.
A final issue is sustaining effort. While grassroots communities were vital to allowing hospitals and medical facilities to remain functioning during the early days of the pandemic, many of the efforts that depended on volunteer labor eventually ran out of steam.
What this means for the future
As the second anniversary of the U.S. declaration of emergency approaches, a key lesson the world has learned is the importance of investing in indoor air quality, for example through monitoring and improved ventilation and filtration. And the value of ventilation as a noninvasive public health tool is even greater as mask mandates wane.
Another, broader lesson is the power of grassroots innovation and citizen engineering to develop these technologies. The story of the Corsi-Rosenthal box, like the thousands of other grassroots innovations developed during the pandemic, is fundamentally about people taking the welfare of their communities into their own hands. The most popular tweet shared about Corsi-Rosenthal boxes was from a 14-year-old aspiring engineer in Ontario offering to build and donate boxes to anyone in need.
Overall, there is a correlation between the stock market and currency markets. Usually, when a country’s stock market increases, its currency decreases, and vice versa.
But we are in extraordinary times. And there are some worrying signs in the stock markets that could signal significant problems in the future.
Where things stand
Stock markets had initially been trading higher since the start of the year, as there was more optimism about entering a post-covid normalization of economic activity.
However, the risk associated with the Russian invasion of Ukraine led to significant drops in equity markets. The FTSE 100 lost all of its gains this year and dropped below the psychologically important 7,000 level. The DAX so far has lost 22% since its most recent high, officially entering a bear market.
Meanwhile, there has been a flight to safety. In fact, this has helped support safe haven currencies.
Usually, investors snap up treasuries as a store of value during difficult times. And normally this would drive down yields. High-risk situations would typically lead to expectations that central banks would start easing.
The situation is very different
The response to a war is not a common economic situation. That said, governments have been putting sanctions not just on Russian assets, but on people doing business with the largest fossil fuel exporter in the world.
Appetite for treasuries has been less robust than analysts’ expectations. In part, that could be due to the potential deterioration of value from high inflation and low interest rates.
Meanwhile, because of high inflation, central banks will probably not ease. In fact, despite a flight to safety, central banks could continue raising rates to fight off inflation. That implies that liquidity is squeezed at both ends. Low liquidity typically translates into higher swings in the markets. And the potential for stock markets to accelerate to the downside.
The lack of disposable income
The situation could be especially acute in Europe, which relies on imports of increasingly more expensive fuel.
Just this morning, French official Le Maire along with Engie’s CEO were discussing the real possibility that gas imports from Russia could be shut off.
If the war in Ukraine were to be protracted, this could substantially hurt supplies of grain and food for Europe. Moreover, it would force the continent to find more expensive alternatives. Not to mention a resurgence of social discontent throughout the Middle East, which also relies on grain exports from Russia and Ukraine.
People and businesses alike are looking to build inventories to offset the expected increasing costs in the future. This means that there is less disposable income to take on risk, such as stock markets, or dabble in the financial markets.
Retail traders have been instrumental in supporting Forex in the last two years. And they are notoriously skittish.
A withdrawal of liquidity from the markets is typically one of the signs of an impending recession. Although a recession provides ample opportunities for forex traders, market dynamics typically change. Strategies that have been very effective up until this moment might not perform as well, as markets shift their trend.
Orbex is a fully licensed broker that was established in 2011. Founded with a mission to serve its traders responsibly and provides traders with access to the world’s largest and most liquid financial markets. www.orbex.com
BTC remains under pressure but there is no panic or extra emotions.
The connection might be the following: after the US published solid February data on its labour market, investors decided that the American economy was so strong that it might easily “survive” several rate hikes.
However, one should pay attention to a small detail: salary growth will boost inflation and it will be another reason for raising the rate. In mid-March, the Fed is planning to raise the rate by 25 basis points, away from zero. There might be 4-5 rate hikes during the year and the Fed is planning to cut its balance at the same time.
It’s a negative signal for the stock market because it implies less liquidity. The NASDAQ index is moving within the mid-term descending channel. it’s no time to panic yet, but the number of sales is quite big. The BTC has a direct correlation with NASDAQ.
Here is the connection: American markets are selling, the BTC is falling.
At the same time, it should be noted that the risk attitude is rather low now and that’s another factor against the BTC.
From the technical point of view, the BTC may easily return to $40,500 if S&P 500 and Nasdaq start recovering. Support levels are at $37,550 and $36,200. Resistance levels are at $43,000 and $45,500.
Not all cryptocurrencies are in confusion. For example, Bitmic, SIBCoin, and ArmzLegends rose pretty much over the past week.
Bitmic is a blockchain platform for creating metauniverses and NFT tokens. It’s quite a thing right now, that’s why interest in the project and its token might remain quite high. CIBCoin is a fork of Dash, which means that it also uses encryption systems for “shadowing” transactions. ArmzLegends is a blockchain-based game, where players may earn cryptocurrency for accomplishing tasks and missions.
Mining: things are now more complicated
Last week, the Bitcoin (BTC) mining difficulty adjustment has dropped 1.49%, for the first time in four months. According to Glassnode, the network hash rate lost almost 10%. Most likely, it’s the response to geopolitical tensions and concerns about the safety of mining farms that are located in conflict zones. The last time the mining difficulty dropped was in summer 2021, as a response to the actions of the Chinese authorities to ban cryptocurrency mining. However, the mining difficulty parameters recovered.
Attention! Forecasts presented in this section only reflect the author’s private opinion and should not be considered as guidance for trading. RoboForex LP bears no responsibility for trading results based on trading recommendations described in these analytical reviews.
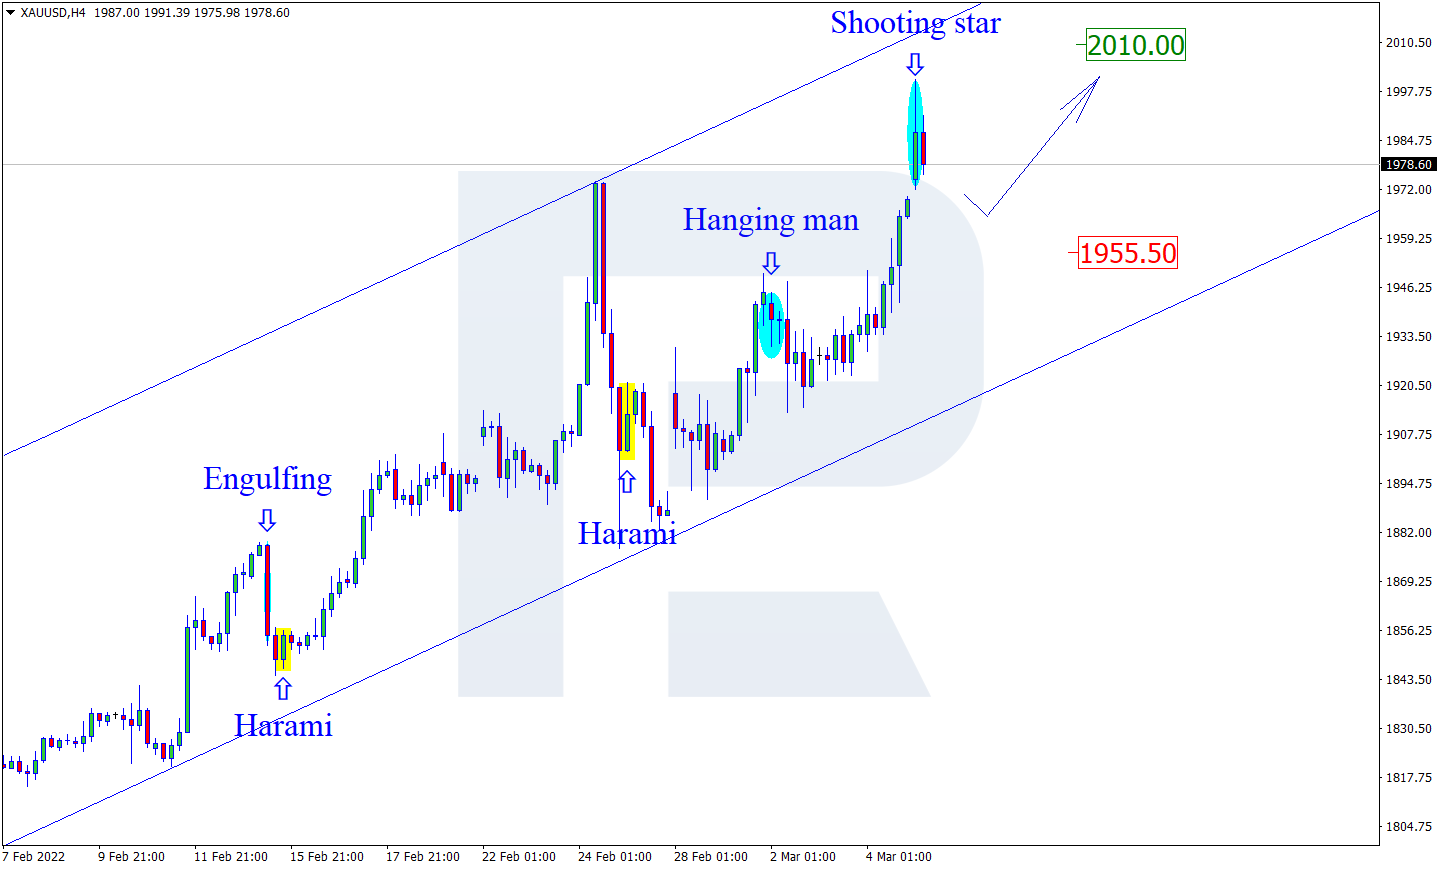
As we can see in the H4 chart, XAUUSD has formed a Shooting Star pattern not far from the resistance level. At the moment, the asset is reversing in the form a new descending impulse. In this case, the downside correctional target may be the support area at 1955.50. At the same time, an opposite scenario implies that the price may grow to reach 2010.00 and continue the ascending tendency without any corrections.
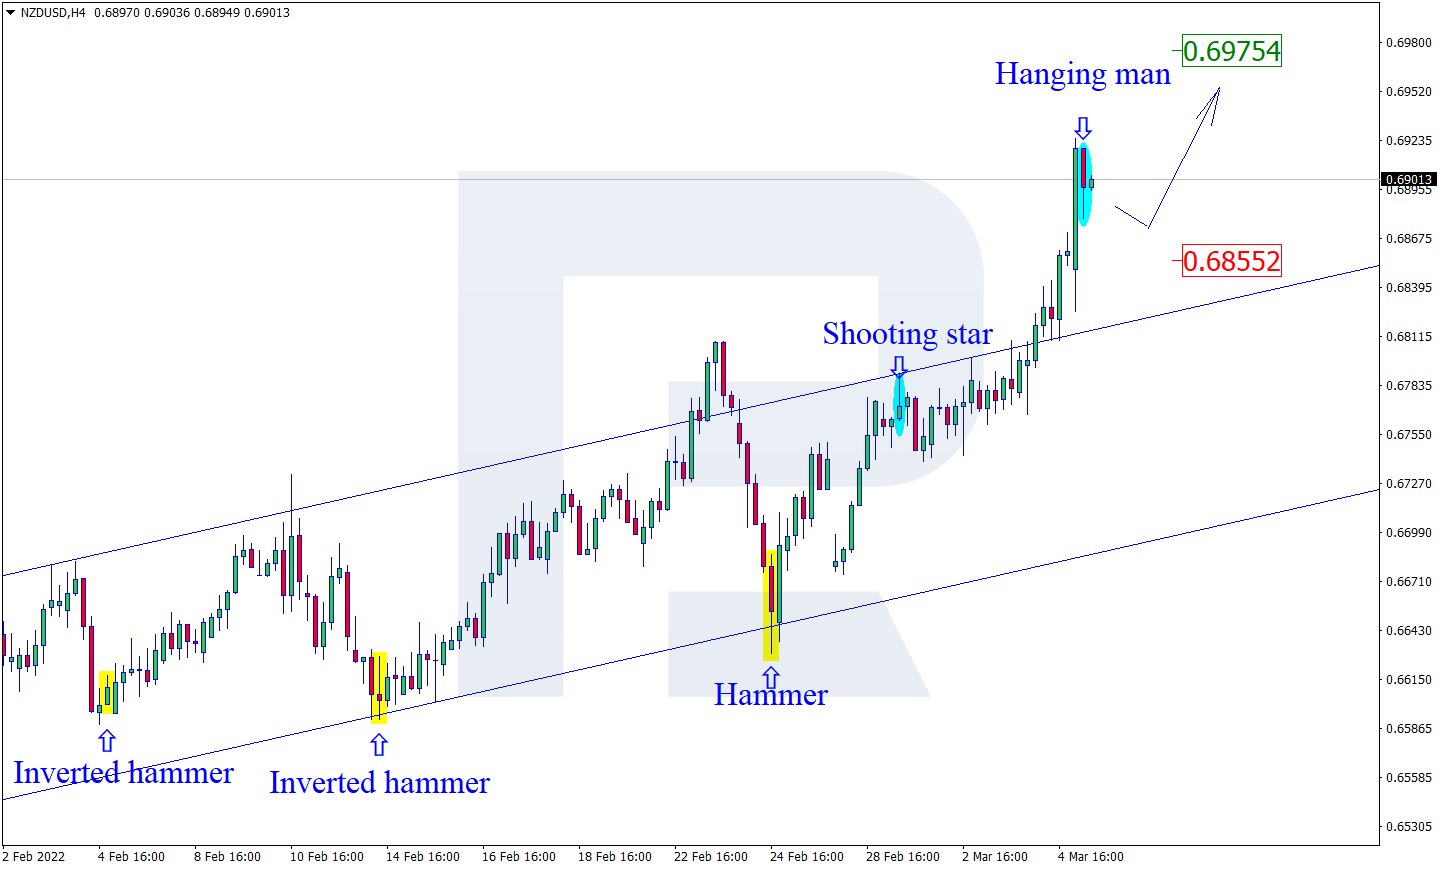
NZDUSD, “New Zealand vs US Dollar”
As we can see in the H4 chart, NZDUSD has formed a Hanging Man reversal pattern close to the resistance area. At the moment, the asset is reversing and may form a new correctional impulse towards the support level. In this case, the downside target is at 0.6855. After that, the asset may rebound from this level and resume moving upwards. However, an alternative scenario implies that the price may grow to reach 0.6975 without any corrections.
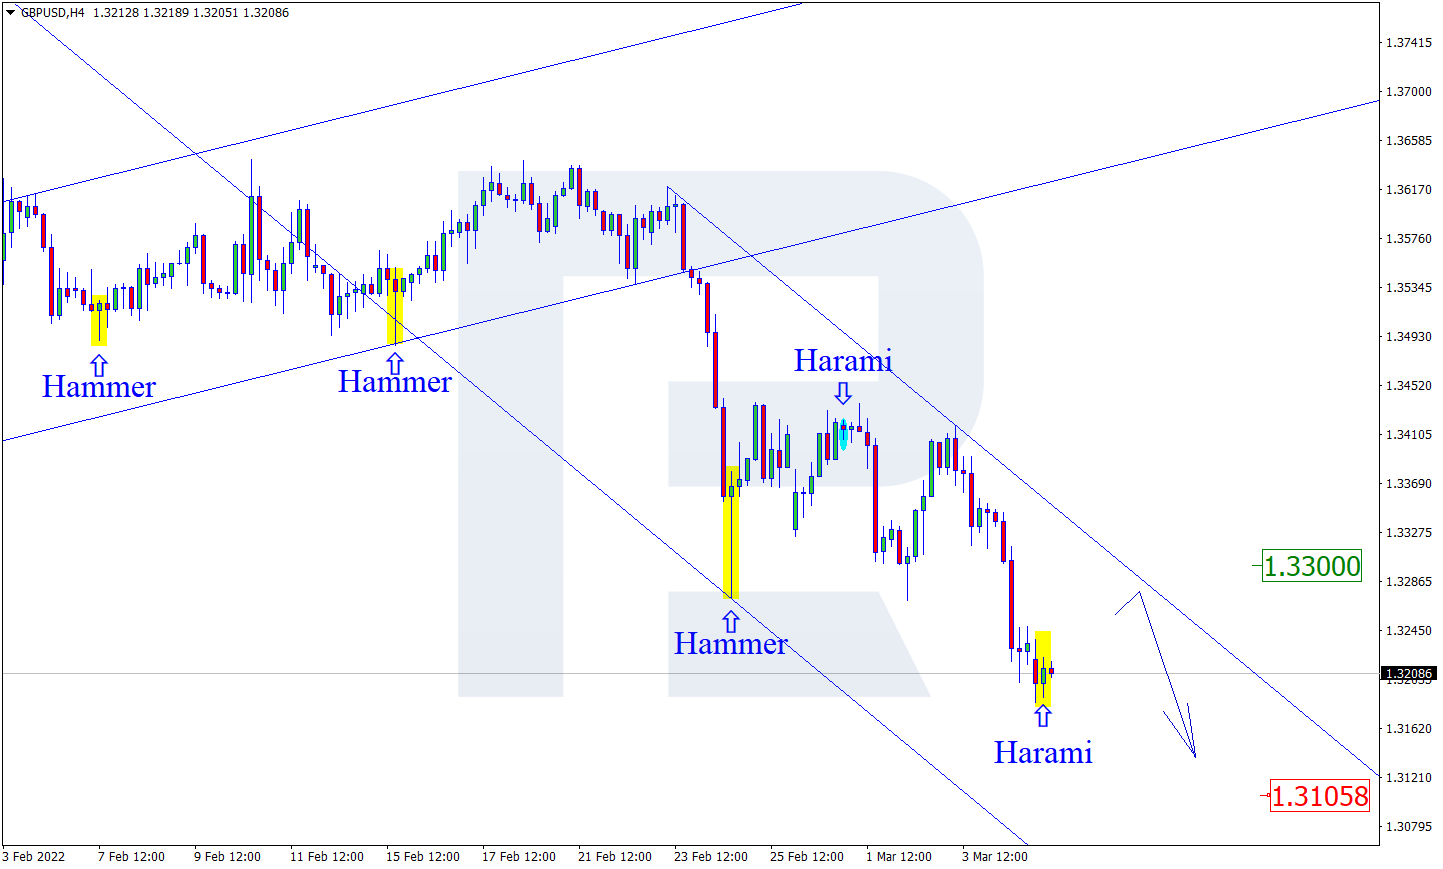
GBPUSD, “Great Britain Pound vs US Dollar”
As we can see in the H4 chart, GBPUSD has formed a Harami reversal pattern near the support area. At the moment, the pair is reversing in the form of a new ascending impulse. In this case, the upside target may be at 1.3300. After testing the resistance level, the market may rebound from it and resume trading downwards. Still, there might be an alternative scenario, according to which the asset may fall to reach 1.3105 and continue the downtrend without any corrections.
Attention! Forecasts presented in this section only reflect the author’s private opinion and should not be considered as guidance for trading. RoboForex LP bears no responsibility for trading results based on trading recommendations described in these analytical reviews.
The current AAPL structure suggests the development of the primary fifth wave, taking the form of an ending diagonal (1)-(2)-(3)-(4)-(5) of the intermediate degree. Wave ⑤ is the final part in the cycle impulse a.
It is likely that the market is currently in an intermediate wave (4). Most likely, this wave will take the form of a minor triple zigzag W-X-Y-X-Z. We see that more than half of this structure is already complete.
There is a possibility that the price within the correction (4) will fall to the support level of 137.16, located on the lower red line.
After the end of the correction (4), the market may push off and start moving in the opposite direction in the intermediate wave (5) towards the 195.99 area. At that level, waves (3) and (5) will be equal.
In an alternative scenario, the ending diagonal fully completed its pattern. And with it the entire cycle wave a ended.
Thus, according to this scenario, in the upcoming trading weeks, market participants will see a drop in the value of shares in a cycle correction b. This may take the form of a double zigzag Ⓦ-Ⓧ-Ⓨ, as shown on the chart in red trend lines.
There is a high probability that the bears will be able to bring the market to the previous low – 115.79. At that level, the primary fourth correction ended earlier.
Orbex is a fully licensed broker that was established in 2011. Founded with a mission to serve its traders responsibly and provides traders with access to the world’s largest and most liquid financial markets. www.orbex.com
The 4% plunge of the euro over the past two weeks and the sharp drop in European indices last week showed how much the European economy depends on Russian energy, and this is not the case when this dependence can be quickly changed or replaced. For now, analysts see a bleak outlook for European economic performance.
Trading recommendations
Support levels: 1.0823, 1.0633
Resistance levels: 1.0921, 1.1001, 1.1061, 1.1213
From the technical point of view, the trend on the EUR/USD currency pair on the hourly time frame is bearish. The MACD indicator is in the negative area, but there are signs of divergence towards purchases on several timeframes. The price has reached the support level of the higher time frame. Under such market conditions, it is best to look for sell trades on intraday time frames from the resistance level of 1.10921. Buy trades should be considered from the support level of 1.0823, but only after additional confirmation in the form of a buyers’ initiative.
Alternative scenario: if the price breaks out through the 1.1061 resistance level and fixes above, the mid-term uptrend will likely resume.
News feed for 2022.03.07:
– German Retail Sales (m/m) at 09:00 (GMT+2).
The GBP/USD currency pair
Technical indicators of the currency pair:
Prev Open: 1.3346
Prev Close: 1.3231
% chg. over the last day: -0.87%
The war in Ukraine and harsh Western sanctions on Russia have caused Russian assets to fall and Russian export commodities such as precious metals, oil, and gas to spike. The global economy is already struggling with inflationary pressures. This is a negative factor for European countries. The UK economy is not so dependent on Russian energy. Nevertheless, Europe’s declining economic performance negatively affects the British currency as investors buy US dollars as a defensive asset.
Trading recommendations
Support levels: 1.3175, 1.3091
Resistance levels: 1.3274, 1.3315, 1.3418
On the hourly time frame, the trend on the GBP/USD currency pair is bearish. Volatility is high, sellers’ pressure is still there, but the MACD indicator shows a divergence towards long deals. Under such market conditions, buy trades should be considered from the support level of 1.3175, but it is better with confirmation. The resistance level of 1.3274 is good for sell deals, but only with additional confirmation in the form of the sellers’ initiative.
Alternative scenario: if the price breaks out through the 1.3418 resistance level and fixes above, the mid-term uptrend will likely resume.
There is no news feed for today.
The USD/JPY currency pair
Technical indicators of the currency pair:
Prev Open: 115.45
Prev Close: 114.82
% chg. over the last day: -0.54%
The Japanese yen and the US dollar are safe-haven currencies. Since there are currently no prospects for ending the war in Ukraine, investors are buying the yen as a protective asset against inflationary risks. It should be noted that the policy of the central bank of Japan is now aimed at making the JPY cheaper (USD/JPY growth), so as soon as there are signs of a de-escalation of the conflict, the JPY will not get stronger.
Trading recommendations
Support levels: 114.71, 114.41
Resistance levels: 115.25, 115.69, 116.32
The medium-term trend on the USD/JPY currency pair is bullish, but the structure is flatter, as the price has no single dynamics and the price is trading in a wide corridor. The MACD indicator has become negative. Under such market conditions, it is best to look for buy deals on the lower time frames from the support level of 114.71, but with additional confirmation. For sell deals, traders should consider the resistance level of 115.25, but it is better to wait for the reaction of sellers.
Alternative scenario: if the price fixes below 114.71, the uptrend will likely be broken.
There is no news feed for today.
The USD/CAD currency pair
Technical indicators of the currency pair:
Prev Open: 1.2672
Prev Close: 1.2727
% chg. over the last day: -0.43%
The Canadian dollar is a commodity currency, so it is highly dependent not only on the monetary policy of the Bank of Canada but also on the dynamics of oil prices and the dollar index. The fundamental picture now is that both the dollar index and oil prices will grow. Investors are buying the dollar index as a defensive asset during the war. This month, the Fed will tighten monetary policy, providing additional support to the US currency. Oil prices could rise even higher as investors continue to hold on to oil contracts fearing supply disruptions from Russia, delays in negotiations with Iran, and a potential return of Iranian oil to world markets.
Trading recommendations
Support levels: 1.2653, 1.2555, 1.2517
Resistance levels: 1.2797, 1.2820, 1.2877
From the technical point of view, the USD/CAD currency pair trend has changed to bullish. The price consolidated above the moving averages and broke through an important resistance level. The MACD indicator has become inactive. It is worth trading only with short targets because both oil and the dollar index are inclined to grow now. Under such market conditions, it is better to look for buy deals on the lower time frames from the support level of 1.2653, but it is better with additional confirmation. For sell deals, it is better to consider the resistance level of 1.2797.
Alternative scenario: if the price breaks through and consolidates below 1.2653, the downtrend will likely resume.
This article reflects a personal opinion and should not be interpreted as an investment advice, and/or offer, and/or a persistent request for carrying out financial transactions, and/or a guarantee, and/or a forecast of future events.
The US dollar softens as the Fed may settle for a less aggressive rate hike agenda. The recent sideways action is a sign of the market’s indecision.
Sellers’ previous attempts to push below 0.9150 have met some buying interest in this demand zone. A definitive breakout may send the pair to January’s lows around 0.9100. Then the path of least resistance could be down, ending a three-month-long consolidation.
0.9230 is the immediate resistance and 0.9290 is a major hurdle before the greenback could bounce back.
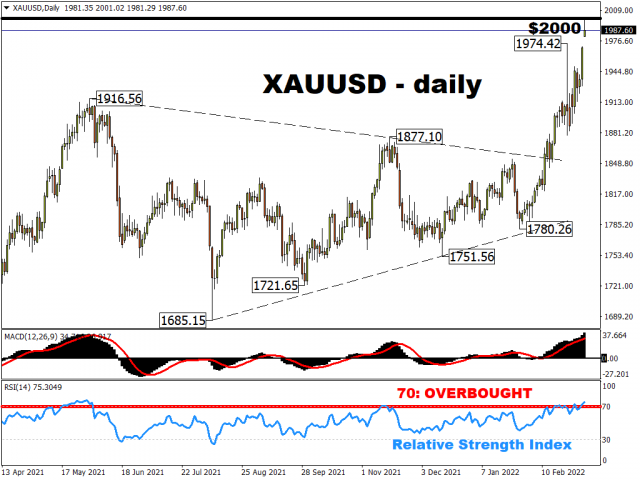
XAUUSD breaks higher
Gold rallies as investors’ flight to safety continues. The bulls have tempered their aggressiveness after the initial surge.
The latest pullback has been an opportunity to accumulate against a bullish backdrop. Price action continues to climb along the rising trendline which suggests that the direction is still up.
A break above the psychological level of 2000 would bring in more momentum traders. In fact, that would send the price to August 2020’s high at 2075. Between the trendline and 1930 there is a key demand zone.
GER 40 drops to a fresh low
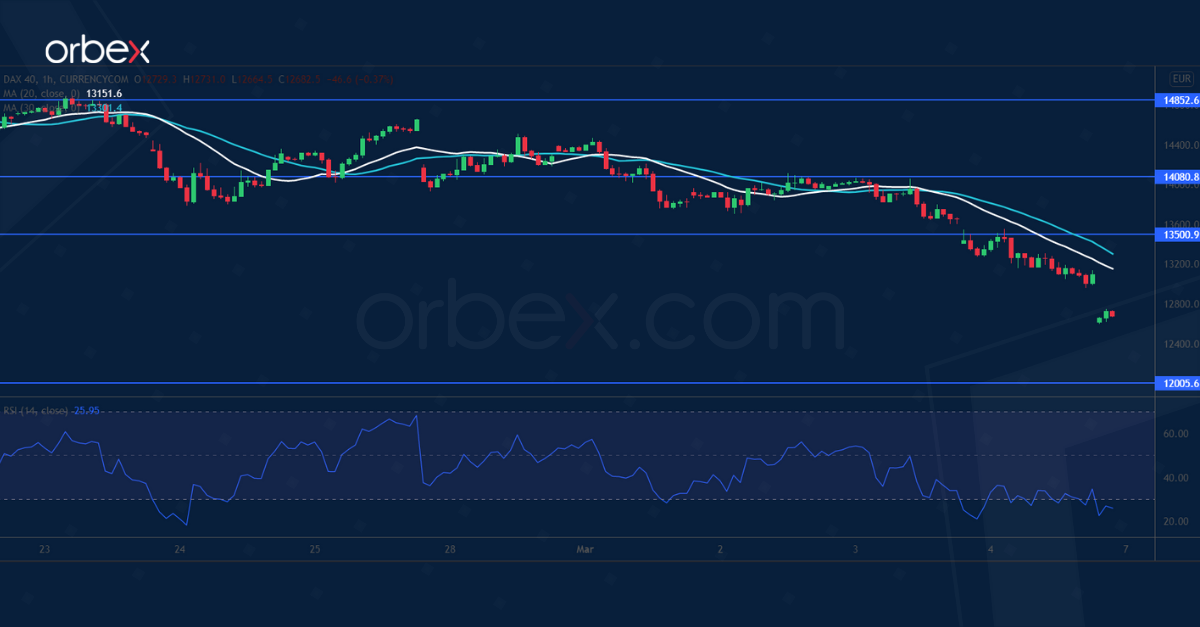
The Dax 40 plunges for fears of stagflation in the eurozone. The index has ventured further into the bearish territory after it broke below March 2021’s lows around 14000.
The liquidation is yet to end as sentiment remains downbeat. A break below the psychological level of 13000 would trigger a new round of sell-off to 12000.
The RSI’s oversold situation from both daily and hourly charts may cause a limited bounce if short-term traders take profit. 13500 is the first resistance ahead and could attract more trend followers.
Orbex is a fully licensed broker that was established in 2011. Founded with a mission to serve its traders responsibly and provides traders with access to the world’s largest and most liquid financial markets. www.orbex.com
Last week, investors’ attention was focused on the war in Ukraine. Now it is a major geopolitical and economic tragedy. Western countries have imposed tough sanctions against Russia for its invasion of Ukraine. The world’s largest companies have ceased cooperation with the Russian market. Russia has lost international support, investors are trying to withdraw their investments from the country, but the Russian government has already introduced laws prohibiting or restricting currency withdrawal. The Moscow Stock Exchange was closed last week, and Russian securities fell by 70-100% on international exchanges.
More and more financial and technology companies are suspending their operations in Russia. At the end of last week, MasterCard and Visa stopped working with Russian banks. PayPal and Payoneer also announced their decision to suspend operations in Russia. Western sanctions against Russia have already frozen most of the $640 billion of the country’s central bank assets, suspended several banks’ participation in the global payment system SWIFT, and sent the ruble into free fall. But the Russian authorities do not stop the bombing of Ukrainian cities. Already 38 innocent children have been killed and hundreds injured in terrorist attacks against civilians.
NATO will not close the skies over Ukraine because it is afraid of being drawn into a direct conflict with Russia. As a result, civilian casualties are increasing every day. The infrastructure of cities is destroyed. The Russians are bombing schools and hospitals, kindergartens, and residential buildings. Russian soldiers know no mercy. They openly shoot at people on the street, children, journalists, and even in the humanitarian corridors. Nothing stops them. Only terrorists do this. Russian terrorists came to Ukrainian soil. Eighty years ago, everyone was afraid of the Nazis, and the word “fascism” was associated with something terrible. And now, after so many years, a new word appeared – “Russism.” However, this is not a new term. In 1995, it was mentioned by Dzhokhar Dudayev, a man who served in Russia, defended his homeland when Russia attacked Chechnya.
On Sunday, several Russian banks said they would soon begin issuing cards using China’s UnionPay card operator system in conjunction with Russia’s own “Mir” network after Visa and MasterCard said they had suspended operations in Russia. Announcements about the transition to UnionPay came from Sberbank, Alfa Bank, and Tinkoff.
According to preliminary information, anti-Putin movements are already growing in Russia. People gather to demonstrate against the war, but the small numbers allow the security forces to disperse them quickly. There is information that Russian oligarchs have begun to transfer their property to Dubai. The State Duma also registered a law prohibiting citizens aged 17 to 72 from leaving the country. Russia is also preparing to isolate the Internet. Facebook has already been blocked in Russia by the state apparatus Roskomnadzor. YouTube and other social services are also blocked. All this is done in order to hide the truth about the “military operation” in Ukraine because most Russians still do not know what is happening in Ukraine. Federal television and Roskomnadzor did everything to prevent Russians from learning the truth about the terrorist actions of their government. This is a direct path to follow in the footsteps of North Korea.
US stock indices closed lower on Friday as risks associated with the Russian attack on Ukraine continue to put pressure on investors. At the close of the stock market, the Dow Jones index (US30) decreased by 0.53% (-0.76% for the week), the S&P 500 (US500) lost 0.79% (-0.58% for the week), and the NASDAQ technology index (US100) fell by 1.66% (-1.90% for the week). All three major indices closed the week with losses. Geopolitical concerns are likely to continue to overshadow the outlook for US stocks as soaring post-sanctions commodity prices have increased fears of more inflation, which may prompt the Fed to raise interest rates more aggressively.
European stock indices have been falling all last week due to the sanctions imposed against Russia, which affected European companies that have lost market share. On Friday, the German DAX (DE30) fell by 4.41% (8.20% for the week), French CAC 40 (FR40) decreased by 4.97% (-8.08% for the week), Spanish IBEX 35 (ES35) lost 3.63% (-7.92% for the week), British FTSE 100 (UK100) decreased by 3.48% (-6.71% for the week). Despite the war in Ukraine, financial markets still expect the Bank of England to raise rates from 0.5% to 0.75% at its March 17 meeting amid growing price pressure.
Gold continues to be at highs due to huge inflationary risks, but from the point of view of the Fed’s monetary policy, there are no prerequisites for the rise in prices for precious metals now.
Oil prices have soared to their highest level since 2008 due to delays in completing Iranian negotiations and the potential return of Iranian oil to global markets already suffering from supply disruptions from Russia. As crude oil inventories continue to decline, supply shortages are pushing up the price of “black gold.” US gasoline prices jumped 11% last week to their highest level since 2008 as global sanctions crippled Russia’s ability to export oil following its invasion of Ukraine. US President Joe Biden is considering a trip to Saudi Arabia to boost oil supplies to the global market.
Asian markets also declined last week amid rising inflation risks due to Russia’s attack on Ukraine. Japan’s Nikkei 225 (JP225) fell by 3.17% over the week, Hong Kong’s Hang Seng (HK50) decreased by 4% last week, but Australia’s S&P/ASX 200 (AU200) was the only index up +0.57% last week. China’s export growth slowed in January and February 2022 as the country celebrated the Lunar New Year. Russia’s invasion of Ukraine in late February added to uncertainty about the outlook for global trade in 2022.
In the commodities market, wheat futures (+40.62%), corn (+14.68%), sugar (+10.11%), BRENT oil (+9.54%), lumber (+9.25%), WTI oil (+9.17%), and orange juice (+5.59%) showed the biggest gains by the end of the week. The biggest drop was in coffee futures (-6.05%).
The war in Ukraine has already led to a significant increase in energy and wheat prices, as Russia and Ukraine account for a quarter of world wheat exports. This situation is likely to eventually lead to inflationary effects and a serious slowdown in global economic growth.
Main market quotes:
S&P 500 (F) (US500) 4,328.87 -34.62 (-0.79%)
Dow Jones (US30) 33,614.80 -179.86 (-0.53%)
DAX (DE40) 13,094.54 -603.86 (-4.41%)
FTSE 100 (UK100) 6,987.14 -251.71 (-3.48%)
USD Index 98.51 +0.72 (+0.74%)
Important events for today:
– Switzerland Unemployment Rate (m/m) at 08:45 (GMT+2);
This article reflects a personal opinion and should not be interpreted as an investment advice, and/or offer, and/or a persistent request for carrying out financial transactions, and/or a guarantee, and/or a forecast of future events.
As the fog of war rolls across global financial markets, global investors and traders will also be paying close attention to this week’s ECB policy decision and the latest US inflation data, and the latter’s impact on the Fed’s intended rate hikes.
Here are the key scheduled economic data releases and events slated for this week:
Traders are battling to process new information that is constantly coming out about the current environment. This includes the harshest geopolitical situation in decades, a melt-up in commodity and energy prices, an unfriendly U.S Federal Reserve who appear keen to commence policy tightening, and 40-year highs in inflation which will only go north in the current climate.
Certainly, safe havens are being sought with gold closing very strongly last week near its recent highs.
Interestingly, different regions are showing distinct levels of performance, especially among major currencies. Commodity-linked foreign exchange like AUD and NZD are clearly enjoying the parabolic moves in energy, agricultural goods and metals. Meanwhile, the euro and other European currencies are being sold very aggressively as the growth prospects look bleak. This sentiment looks set to continue, even if the charts of some of the crosses are hugely oversold on multiple timeframes and indicators, and due a rebound. But “catching a falling knife” springs readily to mind, as price action continues to travel way beyond most technical measures.
Fed Chair Powell recently delivered a vote of confidence in the U.S economy as he signalled the case for a 25bp rate hike at the FOMC meeting next week.
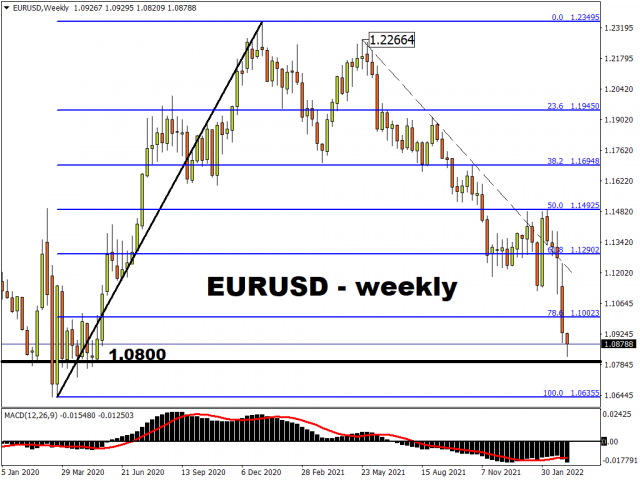
The market has priced back some of the policy tightening which had disappeared and still sees more than five rate hikes for this year. The dollar has happily assumed its status as a safe haven, notably pushing the oversold EUR/USD to 1.09. The March 2020 Covid-peak low at 1.0635 is a huge line in the sand.
We note that the Fed’s blackout period has started so there won’t be any further comments from Fed officials ahead of its 16 March meeting.
The US releases CPI inflation for February which will be a good gauge for current price pressures.
The annual rate is set to rise to multi-decade highs at 7.8% with the core reading at 6.4%. Prints beyond 8% are certainly on the radar in the coming months, putting more pressure on policymakers and underpinning the dollar.
The ECB meeting will be a huge focus as the major central bank with conflict on its doorstep.
The bank is set to strike a cautious stance between staying on track for policy normalisation and keeping maximum flexibility. The already-announced rotation of its bond buying programmes is expected to continue. With the market currently pricing in 25bps of rate hikes by year end, the fate of the battered euro in the near term will be in President Lagarde’s hands.
Disclaimer: The content in this article comprises personal opinions and should not be construed as containing personal and/or other investment advice and/or an offer of and/or solicitation for any transactions in financial instruments and/or a guarantee and/or prediction of future performance. ForexTime (FXTM), its affiliates, agents, directors, officers or employees do not guarantee the accuracy, validity, timeliness or completeness, of any information or data made available and assume no liability as to any loss arising from any investment based on the same.



 A do-it-yourself air purifier in use in a classroom.













 Article by