What’s a bear market? An economist explains

By Vidhura S Tennekoon, IUPUI 

A 16th-century proverb advises: “It’s unwise to sell a bear’s skin before catching it.”

That’s one of the stories used to explain why, in modern times, Wall Street types call someone who sells a stock expecting its price to drop a “bear.” It follows that a market in which securities or commodities are persistently declining in value is known as a “bear market,” like the one U.S. stocks are experiencing now.

The opposite, when assets are steadily rising over a period of time, is a “bull market.”

In my money and banking classes, I teach students about the efficient market hypothesis, which states that stock prices are rational, in that they are always fairly priced based on available information. But when there are big swings in the stock market, it’s hard for my students and others to resist using more emotive terms like “bulls” and “bears,” which call to mind the “animal spirits” of investing.

So how do you know when you’re in a bear market?

The Securities and Exchange Control Commission defines a bear market as a period of at least two months when a broad market – measured by an index such as the S&P 500 – falls by 20% or more. When it rises by 20% or more over two months or more, it is a bull market.

The Standard & Poor’s 500 index, which includes most of the most well-known U.S. companies, has declined about 24% since its its peak on Jan. 3, 2022.

Not everyone strictly follows this two-month rule. For example, in March 2020, when the S&P 500 plunged 34% in a matter of weeks due to the onset of the COVID-19 pandemic, many analysts still called it a “bear market.”

A milder form of a bear market is “correction.” During a correction, prices drop by 10% to 20% from the previous peak.

Some analysts estimate there have been 26 bear markets in the S&P 500 since 1928, excluding the one that began in 2022. The average length was 289 days, with a decline of about 36%. The longest was in 1973-74 and lasted 630 days.

There have been fewer distinct bull markets, with 24 in that period. They tend to last a lot longer, though, often for multiple years.

Why a bear market matters

A bear market may signal a recession is coming, though it’s not a perfect correlation. Since World War II, there have been three bear markets – out of a total of 12 – that didn’t precede a recession.

A bear market is bad news for anyone with a stock investment, whether it’s a direct stake in Apple or Walmart or a 401(k). The impact is particularly hard on recent retirees, who are seeing their nest eggs shrink just as they need to start withdrawing income from them.

In addition, entering a bear market can have a psychological impact on investors, creating a self-fulfilling cycle. Perceiving a bear market tends to prompt investors to sell even more, thus pushing prices down further and prolonging the pain.

Read other short, accessible explanations of newsworthy subjects written by academics in their areas of expertise for The Conversation U.S. here.The Conversation

About the Author:

Vidhura S Tennekoon, Assistant Professor of Economics, IUPUI

This article is republished from The Conversation under a Creative Commons license. Read the original article.


The latest Bank of England rate rise won’t do much to tackle inflation – here’s what could work

By Michael Jacobs, University of Sheffield 

There wasn’t much dramatic tension as markets waited for the Bank of England’s latest decision on interest rates. The fifth monthly quarter-point hike in a row was largely expected, taking the base rate to 1.25% in June 2022. All the announcement really revealed, in fact, was what a mess UK economic policy is in.

Neither the Bank of England, nor the government, is now helping to deal with Britain’s economic problems. A more rational approach to monetary and fiscal policy is needed.

The Bank’s aim is to curb inflation. But the interest rate rise is unlikely to affect inflation at all. There may be a small impact on import prices, if higher rates prevent a further deterioration in the value of the pound. But raising the rate at which citizens and businesses in the UK can borrow money will not ease the global rise in oil, gas and food prices that is the main source of inflation now.

The Bank of England’s members know this, of course. Their justification for raising rates is that they want to keep inflationary expectations under control, to prevent an uncontrollable “wage-price spiral”. This can happen when expectations of future inflation lead workers to bargain for higher earnings to compensate, which only adds to inflation. The Bank of England’s fear is a return to the 1970s. Such a wage-price spiral pushed inflation to 22.6% in 1975.

But the problem with this argument is that inflation has been more than 4% since October 2021 and real earnings are not rising. Strip out bonuses being paid in a small number of sectors, and wages rose only 4.2% between February and April 2022, which in real terms (once inflation is included) is a fall of 2.2%. And the trend is downwards, not upwards.

In the 1970s, more than half the workforce were members of trade unions, giving them the muscle to bargain for higher wages. Average earnings in 1975 hit almost 30%. Today, fewer than a quarter of employees are union members, and most of these are in the public sector, where wages are currently rising by just 1.5% on average.

So there is little chance of a 1970s-style inflationary wage-price spiral. But these cuts in real wages are already starting to cause a contraction of the UK economy. Consumers have no choice but to spend more on the necessities of energy and food, much of which leaves the UK economy. So they are cutting back on discretionary spending on items such as entertainment and home goods, where more money tends to stay within the UK.

The result is that the UK economy actually shrank in April. The OECD forecasts that the UK economy will not grow at all in 2023, and the Bank of England believes the UK will fall into recession this year. The prospect now is of stagflation, when high inflation occurs at the same time as weak or non-existent growth.

And in this situation, the Bank of England’s rate rise will actually make things worse. As interest rates rise, consumers and businesses will find it more costly to borrow to invest and spend, and aggregate demand will fall further.

Government policy

The government isn’t helping either. The emergency package of support to consumers announced by Chancellor Rishi Sunak in May represents a significant stimulus. But the government’s overall fiscal stance is still contractionary, with significant tax rises acting to withdraw demand from the economy. Sunak is still more intent on limiting public borrowing, in accordance with his self-imposed fiscal rules, than he is on keeping either taxes down or spending up.

So, on the one hand we have the Bank of England raising rates in a way that will not affect inflation, but will curb consumer spending. On the other, the government is simultaneously withdrawing demand from the economy via tax rises. And all while the UK economy is contracting.

It is hard not to see this as anything but an economic policy mess. What the UK needs is much stronger coordination between fiscal and monetary policy. If interest rates are to rise, this should only occur while the government stimulates the economy to ensure output and incomes are sustained.

And underneath all this are much deeper weaknesses in the UK economy, which date from well before COVID-19. The UK has close to the lowest rate of investment, and among the lowest productivity and weakest wage growth of any leading economy. Over the last year, business investment has been falling, deeply affected by Brexit and the overall weak outlook for growth. Productivity fell by 0.7% in the last six months. And the Office for Budget Responsibility forecasts that real wages will still be lower in 2026 than they were in 2008.

The government likes to boast about the UK’s very low unemployment rate, now just 3.8%. The labour market is currently as tight as it has ever been, with more vacancies than there are people officially unemployed. But this disguises the fact that employment has also fallen: half a million people have left the labour market since before the pandemic. Some of these have been EU citizens leaving the country; others have taken early retirement, declared themselves sick, or are unwilling to work on the wages they are being offered.

To return to growth, the UK needs to attract more people into the labour market. This requires higher wages, not lower. It also demands an improvement in labour conditions, particularly in the insecure gig economy of zero hours contracts and precarious self-employment. Making work more attractive would require firms to invest in better equipment and skills training, in turn raising productivity.

In a rational economic policy world, the government would now be brokering sectoral productivity deals with businesses and unions, promising government support in return for higher investment and higher earnings. This could indeed be at the heart of the government’s “levelling up” strategy. But unfortunately, we are not in such a world.The Conversation

About the Author:

Michael Jacobs, Professorial Fellow, Sheffield Political Economy Research Institute (SPERI), University of Sheffield

This article is republished from The Conversation under a Creative Commons license. Read the original article.


Murrey Math Lines 21.06.2022 (AUDUSD, NZDUSD)

Article By RoboForex.com

AUDUSD, “Australian Dollar vs US Dollar”

As we can see in the H4 chart, AUDUSD is trading below the 200-day Moving Average to indicate a descending tendency. In this case, the price is expected to test 2/8, break it, and then continue falling to reach the support at 0/8. However, this scenario may no longer be valid if the price breaks the resistance at 3/8 to the upside. After that, the instrument may reverse and resume growing towards 4/8.

AUDUSDH4
Risk Warning: the result of previous trading operations do not guarantee the same results in the future

In the M15 chart, the pair may break the downside line of the VoltyChannel indicator and, as a result, continue moving downwards to reach 0/8 from the H4 chart.

AUDUSD_M15
Risk Warning: the result of previous trading operations do not guarantee the same results in the future

NZDUSD, “New Zealand Dollar vs US Dollar”

As we can see in the H4 chart, NZDUSD is also trading below the 200-day Moving Average, thus indicating a possible descending tendency. In this case, the price is expected to rebound from 3/8 and then resume moving downwards to reach the support at 2/8. However, this scenario may no longer be valid if the price breaks the resistance at 4/8 to the upside. After that, the instrument may reverse and grow towards 5/8.

NZDUSD_H4
Risk Warning: the result of previous trading operations do not guarantee the same results in the future

In the M15 chart, the pair may break the downside line of the VoltyChannel indicator and, as a result, continue its decline.

NZDUSD_M15

Article By RoboForex.com

Attention!
Forecasts presented in this section only reflect the author’s private opinion and should not be considered as guidance for trading. RoboForex LP bears no responsibility for trading results based on trading recommendations described in these analytical reviews.

Crypto firms urged to avoid making destabilizing dot-com era errors

By George Prior 

– Some major crypto firms need to stop making obvious, avoidable mistakes that destabilize the industry, cause financial chaos for investors and job losses for workers, says the CEO of one of the world’s largest advisory, asset management and fintech organizations.

The comments from deVere Group’s Nigel Green, a game-changing digital asset advocate who launched pioneering cryptocurrency exchange deVere Crypto in early 2018, come as some of the biggest players in the market continue to struggle in a volatile environment.

Bitcoin, the world’s largest cryptocurrency, which has shed 57% so far this year, fell below $20,000 over the weekend for the first time since December 2020.

He says: “I’m not in the habit of throwing shade at other companies, but in recent times we’ve seen many of the biggest players make huge, unnecessary mistakes.

“They went for enormously expensive TV ads, jumped on highest-tier sponsorships, rolled-out lending models offering astronomical interest rates on crypto deposits, and launched unprecedented hiring sprees.

“Now, what do we have? Firms laying-off swathes of staff, freezing client withdrawals and cutting back on investment.”

He continues: “Unfortunately, these brands have made some classic, obvious and avoidable dot-com era errors.

“These mistakes destabilize the industry due to the contagion effect, exacerbate financial chaos for investors and the pain of job losses for so many who were hoping to have a rewarding career in the future of finance.

“Such crypto firms would be better off – for the sake of their clients and the wider industry – growing through investing in top talent, innovation and development, and lobbying for sensible regulation with financial watchdogs.”

Despite the crypto price drops, like many long-term crypto investors the deVere CEO is still accumulating Bitcoin.

“I’m using the volatility as a buying opportunity; I’m topping up my investment portfolio at a lower price point.

“The reason why I’m still buying Bitcoin is that I’m confident that digital, global, borderless, decentralized, tamper-proof, unconfiscatable money is, inevitably, the future.”

He adds: “I’m still accumulating Bitcoin as its unique fundamentals haven’t changed.

“Bitcoin continues to produce block by block, the ecosystem and infrastructure continue to develop, major corporations and institutions continue to adopt it, and miners continue to increase their operations.”

Nigel Green says that he believes the crypto sector will bounce back stronger. “I’m sure lessons will be learned and the industry – the future of finance – will become more robust as a result.”

About:

deVere Group is one of the world’s largest independent advisors of specialist global financial solutions to international, local mass affluent, and high-net-worth clients.  It has a network of more than 70 offices across the world, over 80,000 clients and $12bn under advisement.

Japanese Candlesticks Analysis 21.06.2022 (USDCAD, AUDUSD, USDCHF)

Article By RoboForex.com

USDCAD, “US Dollar vs Canadian Dollar”

As we can see in the H4 chart, after forming a Shooting Star reversal pattern close to the resistance level, USDCAD may reverse in the form of another descending impulse. In this case, the downside target may be the support area at 1.2870. Later, the market may rebound from this level and resume growing. However, an alternative scenario implies that the asset may continue trading upwards and reach 1.3040 without testing the support area.

USDCAD
Risk Warning: the result of previous trading operations do not guarantee the same results in the future

AUDUSD, “Australian Dollar vs US Dollar”

As we can see in the H4 chart, AUDUSD has formed a Harami reversal pattern near the support level. At the moment, the asset is reversing and starting a new rising impulse. In this case, the upside target may be the resistance level at 0.7015. After testing the level, the price may rebound from it and resume the descending tendency. At the same time, the opposite scenario implies that the price may continue falling to reach 0.6880 without any corrections.

AUDUSD
Risk Warning: the result of previous trading operations do not guarantee the same results in the future

USDCHF, “US Dollar vs Swiss Franc”

As we can see in the H4 chart, after testing the support area, the pair has formed a Hammer reversal pattern. At the moment, USDCHF may reverse in the form of a new ascending impulse. In this case, the upside target may be at 0.9770. After testing the resistance level, the price may break it and continue trading upwards. Still, there might be an alternative scenario, according to which the asset may fall to reach 0.9590 and continue the descending tendency without any pullbacks.

USDCHF

Article By RoboForex.com

Attention!
Forecasts presented in this section only reflect the author’s private opinion and should not be considered as guidance for trading. RoboForex LP bears no responsibility for trading results based on trading recommendations described in these analytical reviews.

The Analytical Overview of the Main Currency Pairs on 2022.06.21

by JustForex

The EUR/USD currency pair

Technical indicators of the currency pair:
  • Prev Open: 1.0475
  • Prev Close: 1.0510
  • % chg. over the last day: +0.33%

In her speech yesterday, ECB head Christine Lagarde indicated that the underlying inflation forecasts had been revised upward significantly. The ECB forecasts annual inflation at 6.8% in 2022, followed by projections of a decline to 3.5% in 2023 and 2.1% in 2024. The next steps for the ECB to normalize monetary policy are: stop net asset purchases under the program (APP) as of July 1, 2022; raise ECB key interest rates by 25 basis points at the July monetary policy meeting; raise interest rates again in September, the amount of which will depend on the updated medium-term inflation forecast; after September, the ECB will follow a path of gradual interest rate increases.

Trading recommendations
  • Support levels: 1.0499, 1.0408, 1.0379
  • Resistance levels: 1.0611, 1.0680, 1.0723

From the technical point of view, the trend on the EUR/USD currency pair on the hourly time frame is bearish. But it looks like a trend will change soon, as sellers have stopped showing any activity. The price has corrected to the average values, the MACD indicator has become inactive, and the buyers’ pressure persists. Under such market conditions, sell deals can be considered from the resistance level of 1.0611, but only after the additional confirmation. A price move above 1.0611 will change the priority. Buy trades are best to look for on intraday time frames from the support level of 1.0499, but only with confirmation and short targets.

Alternative scenario: if the price breaks out through the 1.0611 resistance level and fixes above, the uptrend will likely resume.

EUR/USD
News feed for 2022.06.21:
  • – US Existing Home Sales (m/m) at 17:00 (GMT+3);
  • – US FOMC Mester Speaks at 19:00 (GMT+3).

The GBP/USD currency pair

Technical indicators of the currency pair:
  • Prev Open: 1.2218
  • Prev Close: 1.2247
  • % chg. over the last day: +0.24%

UK Monetary Policy Committee spokeswoman Mann pointed out yesterday that in the current environment, with historic inflation levels already evident and the US Fed tightening, UK exposure and sensitivity to global financial secondary effects could exacerbate the inflation-activity trade-off that the Bank of England is currently facing. British policymakers will have to roughly accept a tightening by the US to stabilize prices and mitigate inflationary pressures exerted by the exchange rate. In other words, the Bank of England does not know exactly how to proceed, as it refers to the fact that inflation in Britain and the US are rising for different reasons, but will act roughly the same.

Trading recommendations
  • Support levels: 1.2176, 1.1974
  • Resistance levels: 1.2265, 1.2422, 1.2470, 1.2523, 1.2629

From the technical point of view, the trend on the GBP/USD currency pair on the hourly time frame is bearish. The price is trading between the two accumulative balances, but the buyers’ initiative remains in recent days. The MACD indicator has become inactive. Under such market conditions, sell deals can be considered from the resistance level of 1.2422, but only after the additional confirmation. Buy trades are best to look for on intraday time frames from the support level of 1.2265, but only with confirmation and short targets.

Alternative scenario: if the price breaks out through the 1.2422 resistance level and fixes above, the uptrend will likely resume.

GBP/USD
There is no news feed for today.

The USD/JPY currency pair

Technical indicators of the currency pair:
  • Prev Open: 134.93
  • Prev Close: 135.04
  • % chg. over the last day: +0.08%

Prime Minister Fumio Kishida said yesterday that Bank of Japan Governor Haruhiko Kuroda expressed concerns about currency movements during their meeting, which briefly strengthened the yen. For his part, Kuroda said that the government and the central bank would continue to monitor currencies closely and cooperate to act appropriately. The Bank of Japan’s insistence on continued easing to support the economy and keep inflation stable contrasts with the wave of interest-rate hikes that has swept global central banks trying to cope with rising prices. The Bank of Japan’s dovish stance continues to contribute to the yen’s decline.

Trading recommendations
  • Support levels: 134.74, 133.38, 131.67, 131.00, 130.12, 129.48, 128.76, 128.10, 127.64
  • Resistance levels: 135.16

The medium-term trend on the USD/JPY currency pair is bullish. The price formed a narrow balance, and buyers’ pressure prevailed. Under such market conditions, buy trades can be considered from the support level of 134.74 or 133.38, but with confirmation. A resistance level of 135.16 is good for sell deals, but only with additional confirmation in the form of a reverse initiative and short targets.

Alternative scenario: If the price fixes below 131.67, the downtrend will likely resume.

USD/JPY
There is no news feed for today.

The USD/CAD currency pair

Technical indicators of the currency pair:
  • Prev Open: 1.3024
  • Prev Close: 1.2980
  • % chg. over the last day: -0.34%

The Canadian currency is a commodities currency and depends not only on the dollar index but also on the oil price movements. Oil prices increased yesterday as investors’ attention returned to oil and oil product shortages amid fears that a recession will hit demand. Rising oil prices are strengthening the Canadian dollar (USD/CAD decline).

Trading recommendations
  • Support levels: 1.2903, 1.2815, 1.2709, 1.2618, 1.2578, 1.2510
  • Resistance levels: 1.2974, 1.3068

In terms of technical analysis, the trend on the USD/CAD currency pair is bullish. The MACD indicator has become negative, and the pricehas corrected to the average values. Under such market conditions, it is better to look for buy deals in the lower time frames from the support level of 1.2903. For sell deals, it is better to consider the resistance level of 1.2974, but it is also better with confirmation and short targets.

Alternative scenario: if the price breaks through and consolidates below the 1.2815 support level, the downtrend will likely resume.

USD/CAD
News feed for 2022.06.21:
  • – Canada Retail Sales (m/m) at 15:30 (GMT+3).

by JustForex


This article reflects a personal opinion and should not be interpreted as an investment advice, and/or offer, and/or a persistent request for carrying out financial transactions, and/or a guarantee, and/or a forecast of future events.

European indices are rising despite a planned interest rate hike by the ECB

by JustForex

The US stock market did not trade yesterday due to the banking holiday.

Stock markets in Europe traded higher yesterday. German DAX (DE30) gained 1.06%, French CAC 40 (FR40) added 0.64%, Spanish IBEX 35 (ES35) jumped by 1.72%, British FTSE 100 (UK100) was up 1.50% on Monday.

The euro increased on Monday as markets focused on the European Central Bank’s anti-fragmentation tools, ignoring the risk of political gridlock in France after President Emmanuel Macron lost an outright majority in parliamentary elections.

On Monday, ECB President Christine Lagarde confirmed plans to raise ECB interest rates twice this summer, fighting widening spreads in the cost of borrowing by various Eurozone countries.

Germany will restart its coal-fired power plants and introduce an auction scheme to cut gas consumption after Gazprom cut supplies by 60% last week. On Monday the Dutch government said it would lift restrictions on production at coal-fired power plants and activate the first phase of its energy crisis plan.

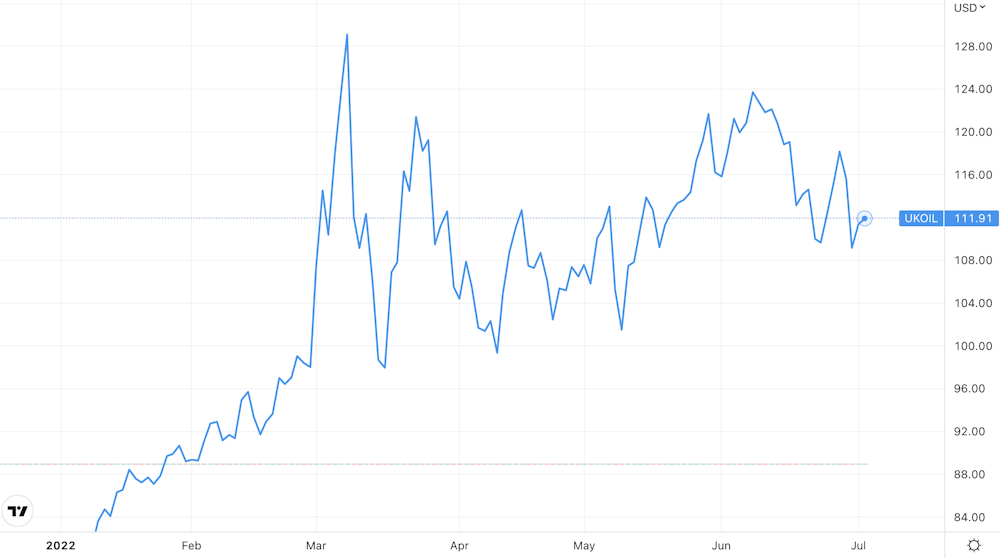
The situation in the oil market remains the same. Oil markets are keeping oil prices above $105 a barrel. Oil prices rose yesterday as traders focused on limited supplies due to a slowdown in global economic growth. Analysts expect limited production from OPEC+ countries this summer, so market shortages will remain with demand growth.

Asian markets have been trading in positive territory since the opening. Japan’s Nikkei 225 (JP225) increased by 2.26%, Hong Kong’s Hang Seng (HK50) added 1.43%, and Australia’s S&P/ASX 200 (AU200) is up by 1.41% from the opening bell.

The People’s Bank of China left key interest rates unchanged on 1-year and 5-year loans. As the economy continues to face immense challenges, recovery is likely to be slow, with unemployment a key economic problem.

Imports from China’s Xinjiang region will be banned in the US starting today after the new rules take effect. Under the laws, firms will have to prove that imports from the region are not made using forced labor. China has repeatedly denied accusations of holding Uighurs in internment camps in Xinjiang.

Reserve Bank of Australia Governor Lowe has warned that the central bank’s board will do whatever is necessary to bring inflation under control, which he now expects to reach 7% by year’s end, doubling the bank’s 2-3% target. That’s why the RBA was forced to raise the interest rate more than expected by 50 basis points at this month’s board meeting. Economists forecast another 50-basis-point hike in July and possibly another in August, raising the rate to 1.85% by year’s end.

Main market quotes:

S&P 500 (F) (US500) 0 0 (0%)

Dow Jones (US30) 0 0 (0%)

DAX (DE40) 13,265.60 +139.34 (+1.06%)

FTSE 100 (UK100) 7,121.81 +105.56 (+1.50%)

USD Index 104.47 -0.23 (-0.22%)

Important events for today:
  • – Australia RBA Governor Lowe Speaks at 03:00 (GMT+3);
  • – Australia RBA Meeting Minutes (m/m) at 04:30 (GMT+3);
  • – Canada Retail Sales (m/m) at 15:30 (GMT+3);
  • – US Existing Home Sales (m/m) at 17:00 (GMT+3);
  • – US FOMC Mester Speaks at 19:00 (GMT+3).

by JustForex


This article reflects a personal opinion and should not be interpreted as an investment advice, and/or offer, and/or a persistent request for carrying out financial transactions, and/or a guarantee, and/or a forecast of future events.

Markets stablise as global sentiment improves

By ForexTime 

A sense of normality seems to be returning to financial markets after the brutal selloff in global shares last week. Asian stocks rebounded on Tuesday following the positive cues from European markets overnight while U.S futures moved higher after their markets were closed for a holiday. While the improving sentiment could support equity bulls in the near term, caution lingers in the air with investors likely to adopt a guarded approach towards risky assets.

In the currency arena, the dollar kicked off the week in a shaky fashion while gold waited for another fresh directional catalyst to break out of its current range. Oil prices rose 1% this morning, clawing back more of last week’s steep losses as market players focused on the tight supply dynamics in the commodity.

The week ahead promises to be eventful and potentially volatile thanks to key economic reports from major economies and Fed Chair Jerome Powell’s semi-annual testimony before Congress. Major themes ranging from inflation fears, rate hike expectations, ongoing geopolitical risks, and recession concerns will influence the market mood.

All eyes on Powell’s testimony

Fed Chair Jerome Powell will be under the spotlight this week as he testifies before Congress over two days.

Last week, the Federal Reserve raised interest rates by 75 basis points – its biggest increase since 1994. However, the central bank reassured markets that such jumbo-sized rate hikes would be rare. Powell’s testimony will be closely scrutinised for hints about incoming rate hikes and the outlook for the US economy. Should Powell strike a hawkish note and offer fresh insight into rates, this may boost expectations that the central bank will maintain an aggressive approach towards rates. Traders are pricing in an 89% chance of a 75-basis point rate hike at the next FOMC meeting in July.

Taking a look at the dollar, it has weakened against most G10 currencies this morning. The Dollar Index (DXY) could extend declines if a breakdown below 104.0 is achieved. Alternatively, a move above 104.50 may signal an advance towards 105.00.

Oil prices buoyed by supply worries

Oil prices pushed higher on Tuesday as investors focused on the persistent supply constraints and tightening market conditions. Given how the global commodity remains pulled and tugged by conflicting forces, this could result in more volatility down the road.

On one side of the equation, ongoing geopolitical risks and sanctions on Russian supplies continue to support prices. However, the Fed’s aggressive hawkish stance has fanned concerns of an economic slowdown which will hit the demand outlook. Despite the conflicting forces, oil benchmarks are up almost 50% since the start of the year.

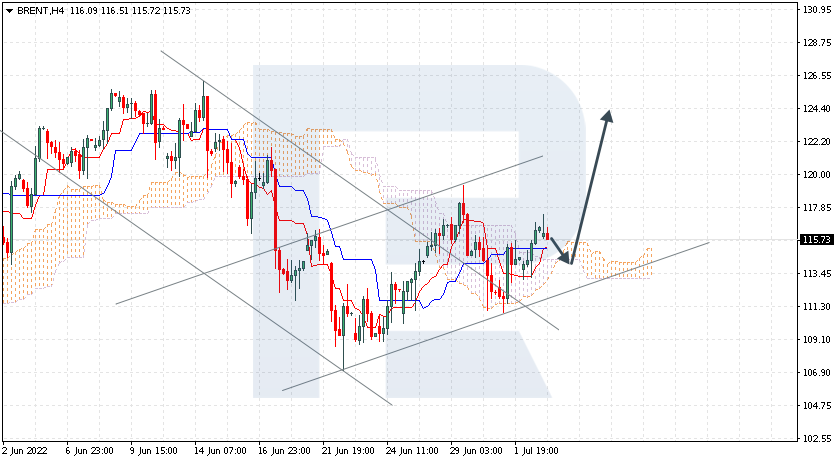
In regard to the technical picture, Brent crude prices remain under pressure after the steep selloff last Friday. A breakdown below $112.00 could encourage a decline towards $104 and $100. A move above $116.00 could inspire a move back towards $120.

Commodity spotlight – Gold

After the explosive volatility last week, gold has kicked off the new week on a calmer note. The lack of momentum suggests that a fresh fundamental spark needs to be brought into the picture to trigger the next major move in gold. Such a catalyst could come in the form of Fed Chair Jerome Powell’s testimony before Congress this week.

Looking at the technical picture, gold prices are trading below the 50, 100, and 200 SMA on the daily charts. Strong support can be found at $1800 and strong resistance at $1900. There seems to be minor support around $1830. A solid breakdown below this level could encourage a decline towards $1800 and $1764. A breakout above $1858 could trigger a move higher towards $1870 and $1900, respectively. Beyond $1900, the first checkpoint can be found at $1920.


Forex-Time-LogoArticle by ForexTime

ForexTime Ltd (FXTM) is an award winning international online forex broker regulated by CySEC 185/12 www.forextime.com

Over 500 New Instruments and Further Updates on R StocksTrader

RoboMarkets, the European company that provides access to high-tech solutions for online trading, announces expanding its multimarket trading platform, R StocksTrader. The terminal has over 500 new instruments added to it, as well as further updates of the web version and the mobile app.

Amongst R StocksTrader’s new features:

  • More than 500 new instruments, including Didi Global Inc (DIDI), Beyond Meat Inc (BYND), and Spotify Technology SA (SPOT)
  • New thematic watchlists (Invest in China, Invest in Volatility, Invest in Gold, and other sets by industries)
  • New templates for watchlists have been added to the main screen of the app. Also, collection lists have been updated, including recently opened instruments, popular instruments, and other lists such as Best of the year, Upcoming Dividends, New to the market (IPO), etc.
  • The instrument search screen has been enhanced and is now featuring two blocks: Most Popular and History
  • The trading session time has been increased for the Dow Jones (US30), S&P 500 (US500), Nasdaq (NAS100), and DAX (GER40)
  • The navigation in the app has been enhanced, and the design of the trading statement has been updated

Kiryl Kirychenka, Product Manager at RoboMarkets, comments: “Our approach to design implies constantly aiming at improving the products and solutions we offer our clients. The latest updates provide R StocksTrader clients with more comfortable solutions and effective analysis of investment instruments”.

Download R StocksTrader App

R StocksTrader App iOS
R StocksTrader App Android

About RoboMarkets

RoboMarkets is an investment company operating under CySEC license No. 191/13. RoboMarkets offers investment services in European countries by providing traders who work in the financial markets with access to its proprietary trading platforms.  Find more detailed information about the Company’s products and activities on www.robomarkets.com


Japanese Yen Might Change the Trend

By RoboForex Analytical Department

At the beginning of the new week, the Japanese yen against the US dollar is consolidating but looks quite weak yet.

USD/JPY buyers are not gone: they are lying low, waiting for a good time to resume action.

Market players are saying that the devaluation of the yen has become one of the main trading ideas in the currency market this year. The Japanese yen has lost more than 16% and can lose more but investors are ready to change the trend. The reason isthat the Bank of Japan will most probably have to correct its monetary policy to catch up with other regulators.

This viewpoint is based on certain livening up of inflation, while the BoJ had been fighting its low rates for decades. The situation has changed, hence, foundation for changing the monetary policy has appeared.

On H4, USD/JPY has corrected to 131.50. At the moment, the market continues developing a growing wave to 136.80 (at least). Currently, there is a consolidation range forming around 134.40. We expect an escape upwards and growth to 136.80, followed by a decline to 131.50. This tech picture is confirmed by the MACD. Its signal line is trading above zero. So, we expect growth to new highs.

On H1, USD/JPY has completed a correction to 131.51. Today the market continues developing another growing wave. Currently, there is a consolidation range forming around 134.40. We expect a test of the range from above, followed by growth to 135.10. If this level is broken away, a pathway for growth to 136.80 might open. Technically, this scenario is supported by the Stochastic oscillator. Its signal line is forming a structure of growth to 50. And as soon as it is broken away, a pathway to 80 will open.

Disclaimer

Any forecasts contained herein are based on the author’s particular opinion. This analysis may not be treated as trading advice. RoboForex bears no responsibility for trading results based on trading recommendations and reviews contained herein.