Shooting of Shinzo Abe is a huge shock for Japan and the world

By Craig Mark, Kyoritsu Women’s University 

Japan is reeling from the assassination of its longest-serving former prime minister, Shinzo Abe. He was campaigning for the ruling Liberal Democratic Party for the Upper House elections due on Sunday, in the city of Nara in western Japan, when he was shot from behind with an apparently home-made sawn-off shotgun.

The alleged assailant, reportedly a 42-year old local man, was arrested at the scene. There is no known motive at this time, but there are reports the suspect is a former member of the Japanese Maritime Self-Defense Forces.

Abe was seen lying bleeding on the ground, before being taken by helicopter to a nearby hospital where he was later pronounced dead.

Political violence, and gun violence in general, is extremely rare in postwar Japan, so this incident has deeply shocked the Japanese public. Gun ownership is tightly regulated, and mostly restricted to registered hunters.

There have been occasional shootings by organised crime groups, typically targeting each other, but Japan has consistently had low rates of violent crime.

Far-right groups have been responsible for a few attacks on politicians in the postwar period: in 1990, the then mayor of Nagasaki, Hitoshi Motoshima, was shot and wounded; and in 1960 Inejirō Asanuma, leader of the opposition Japan Socialist Party, was stabbed and murdered.

In the pre-war era, democratic politicians found themselves subject to frequent attacks and intimidation by militarists. Prime Minister Inukai Tsuyoshi was murdered by Imperial Navy officers in an attempted coup on May 15 1932.

Abe’s political legacy

Abe, 67, is the grandson of former prime minister Nobusuke Kishi, and was a scion of the conservative Liberal Democratic Party, which has been in government for most of the postwar era. His first stint as prime minister lasted roughly a year, from 2006 to 2007, before he resigned due to ulcerative colitis following his party’s poor performance in the 2007 Upper House elections.

He made a remarkable political comeback in 2012, reclaiming the leadership of the Liberal Democratic Party and winning the general election that December. Abe won national elections in 2014 and 2017, entrenching his power over the weak and divided opposition parties.

He introduced his signature economic policy, “Abenomics”, based on massive deficit spending, quantitative easing and attempts at structural reform. However, twice raising the consumption tax undermined these attempts to lift the Japanese economy out of its decades-long stagnation.

A member of the ultranationalist lobby group Nippon Kaigi, Abe carried out a far-reaching transformation of Japanese foreign and defence policy, reinterpreting the pacifist Article 9 of the Constitution, to allow greater overseas deployment of the Self-Defense Forces.

His government increased defence spending annually, and in 2015 the Diet (the Japanese parliament) passed controversial security bills that allowed the Self-Defense Forces to participate in collective defence operations with allied countries, particularly the United States but potentially also Australia, India and the United Kingdom.

Abe originally raised the concept of the Quad security partnership between Japan, the US, Australia and India, and in 2016 formalised the phrase “free and open Indo-Pacific” as Japan’s main foreign policy goal to preserve the US-led rules-based liberal order in international relations.

His longevity in office saw him become one of the most experienced world leaders, and he used his foreign policy experience to steadily manage the US alliance, handling the erratic President Donald Trump through “golf diplomacy”.

Abe was able to maintain fairly stable relations with neighbouring China, Japan’s largest trading partner, despite the long-running territorial dispute over the Senkaku Islands (claimed as the Daioyus by China). Relations with South Korea remained poor, however, due to disputes over historical issues stemming from Japan’s colonial rule of Korea.

A member of the largest conservative faction in the Liberal Democratic Party, Abe’s dominance over the party and Japanese politics began to erode when the ruling coalition lost its two-thirds majority in the 2019 Upper House election. A long-running series of nepotism scandals also dented his public standing; investigations by public prosecutors led to charges against some of Abe’s associates and political staff, although Abe himself was never indicted.

While Japan coped fairly well with the COVID pandemic, largely due to cooperation with recommended health measures by the public, Abe’s government came under increasing criticism for a series of inept pandemic responses as the economy went into a sharp recession. Abe’s ill-health returned, and he resigned in August 2020, replaced the following month by his former chief cabinet secretary, Yoshihide Suga.

Abe remained in the Diet, and last year became the leader of the Hosoda faction, after backing his former foreign minister and current prime minister Fumio Kishida in the race to become the party’s leader.

Situation still developing

In response to this tragedy, the Liberal Democratic Party has requested that its candidates cease campaigning, and opposition party politicians have also announced they will suspend campaign activities.

Kishida has returned to the prime minister’s office to monitor the situation, but at the time of writing, there has been no announcement about voting arrangements for the Upper House election, due to proceed on Sunday July 10.

In pre-election polling, the Liberal Democratic Party was expected to win a comfortable majority, in partnership with its junior partner, the Komeito party.

The 2022 Upper House election will now remain under the shadow of one of the most disturbing events in Japan’s modern political history.The Conversation

About the Author:

Craig Mark, Professor, Faculty of International Studies, Kyoritsu Women’s University

This article is republished from The Conversation under a Creative Commons license. Read the original article.

 

How to Prepare for a Hard-Hitting Bear Market (Think 1929-1932)

This metric of bullishness is higher than it was at the top of the dot-com mania

By Elliott Wave International

An important step in preparing for a historic bear market is to embrace cash or cash equivalents.

This may seem obvious, but even with the stock market in a downtrend, cash is shunned by many an investor — retail and professional. Many of these investors believe the bull market will resume — sooner rather than later.

As the May Elliott Wave Theorist, a monthly publication which analyzes financial markets and major cultural trends, noted:

The percentage of assets dedicated to equities in American Association of Individual Investors members’ portfolios remains near a bullish extreme. … They think a “correction” is in force but not a bear market.

So, AAII members have been holding more stocks than cash.

Here in July, investors continue to hold out hope for a resurgence of the bull. This chart and commentary are from the just-published Elliott Wave Financial Forecast:

This chart shows the percentage that U.S. households have in equities relative to their total assets and provides long term context. At 27.5%, the latest reading, from the end of the first quarter, is higher than the peak reading of 26.3% at the top of the dot-com mania in the first quarter of 2000!

Professional market observers likewise dislike cash (Bloomberg, July 27):

S&P Analysts Haven’t Been This Bullish In 20 Years

The point is: If you have a portfolio of mainly cash (or equivalents), you’ll be in the minority, which history shows is usually the best place to be when a market is transitioning from a bear to bull or bull to bear.

Just make sure your cash is kept in the safest institution possible.

You see, speaking of history, Elliott Wave International President Robert Prechter wrote this in his March Elliott Wave Theorist:

Between 1929 and 1933, 9000 banks in the United States closed their doors. … Well before a worldwide depression dominates our daily lives, you will need to deposit your capital into safe institutions.

You may say, “My deposits are insured up to $250,000 by the Federal Insurance Deposit Corporation — why should I worry about my bank’s stability?”

The March Elliott Wave Theorist explains why you should not rely on the F.D.I.C. and provides a wealth of other insights into protecting your financial safety — as well as your physical safety.

If the bear market turns out to be as severe as Elliott Wave International anticipates, social and political turmoil are likely to erupt.

Now is the time to learn the important message of the stock market’s Elliott wave pattern.

If you’re unfamiliar with Elliott wave analysis, you are encouraged to read Frost & Prechter’s Elliott Wave Principle: Key to Market Behavior. Here’s a quote from this Wall Street classic:

The practical goal of any analytical method is to identify market lows suitable for buying (or covering shorts) and market highs suitable for selling (or selling short). When developing a system of trading or investing, you should adopt certain patterns of thought that will help you remain both flexible and decisive, both defensive and aggressive, depending upon the demands of the situation. The Elliott Wave Principle is not such a system, but is unparalleled as a basis for creating one.

Despite the fact that many analysts do not treat it as such, the Wave Principle is by all means an objective study, or as [Charles J.] Collins put it, “a disciplined form of technical analysis.”

Here’s the good news: You can read the entire online version of the book for free once you become a Club EWI member.

Club EWI is the world’s largest Elliott wave educational community with approximately 500,000 worldwide members and is free to join. Members enjoy free access to a treasure trove of Elliott wave resources on investing and trading without any obligations.

Interested? If so, just follow the link and you can have the book on your screen in just a few moments: Elliott Wave Principle: Key to Market Behavior (free and unlimited access).

This article was syndicated by Elliott Wave International and was originally published under the headline How to Prepare for a Hard-Hitting Bear Market (Think 1929-1932). EWI is the world’s largest market forecasting firm. Its staff of full-time analysts led by Chartered Market Technician Robert Prechter provides 24-hour-a-day market analysis to institutional and private investors around the world.

Ichimoku Cloud Analysis 08.07.2022 (EURUSD, GBPUSD, NZDUSD)

Article By RoboForex.com

EURUSD, “Euro vs US Dollar”

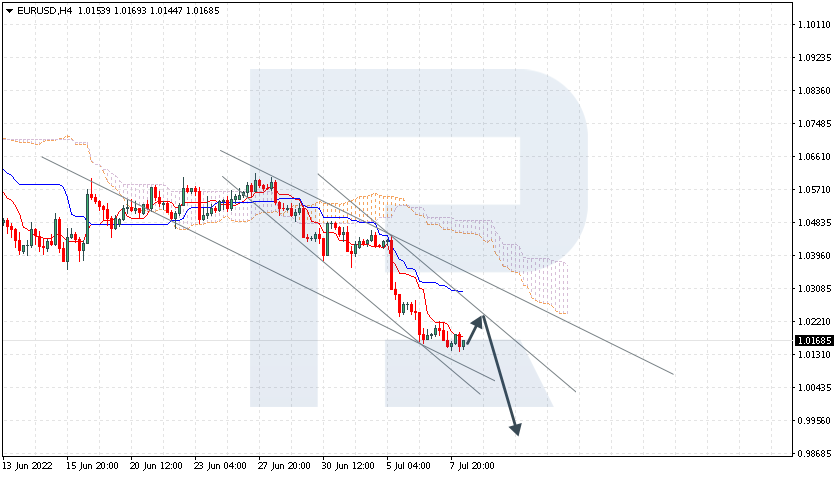
EURUSD is testing Tenkan-Sen. The instrument is currently moving below Ichimoku Cloud, thus indicating a descending tendency. The markets could indicate that the price may test Kijun-Sen at 1.0465 and then resume moving downwards to reach 1.0255. Another signal in favour of a further downtrend will be a rebound from the descending channel’s upside border. However, the bearish scenario may no longer be valid if the price breaks the cloud’s upside border and fixes above 1.0465. In this case, the pair may continue growing towards 1.0575.

EURUSD
Risk Warning: the result of previous trading operations do not guarantee the same results in the future

GBPUSD, “Great Britain Pound vs US Dollar”

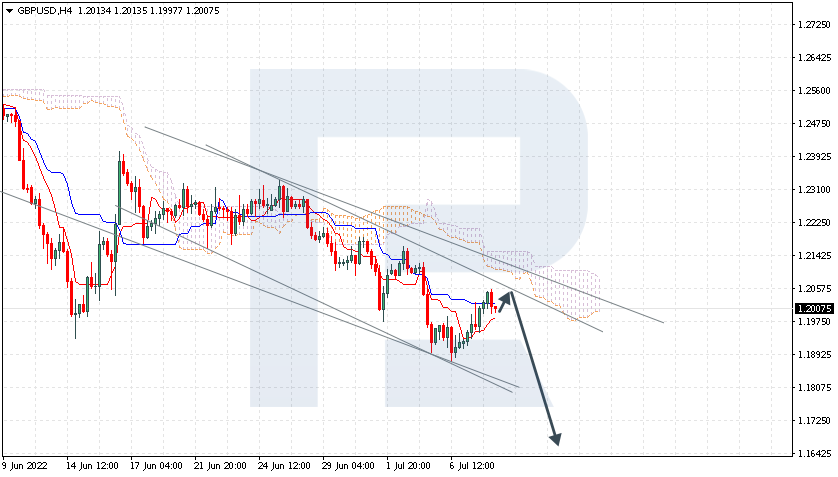
GBPUSD has rebounded from the support level. The instrument is currently moving below Ichimoku Cloud, thus indicating a descending tendency. The markets could indicate that the price may test Kijun-Sen at 1.2055 and then resume moving downwards to reach 1.1645 Another signal in favour of a further downtrend will be a rebound from the descending channel’s upside border. However, the bearish scenario may no longer be valid if the price breaks the cloud’s upside border and fixes above 1.2175. In this case, the pair may continue growing towards 1.2265.

GBPUSD
Risk Warning: the result of previous trading operations do not guarantee the same results in the future

NZDUSD, “New Zealand Dollar vs US Dollar”

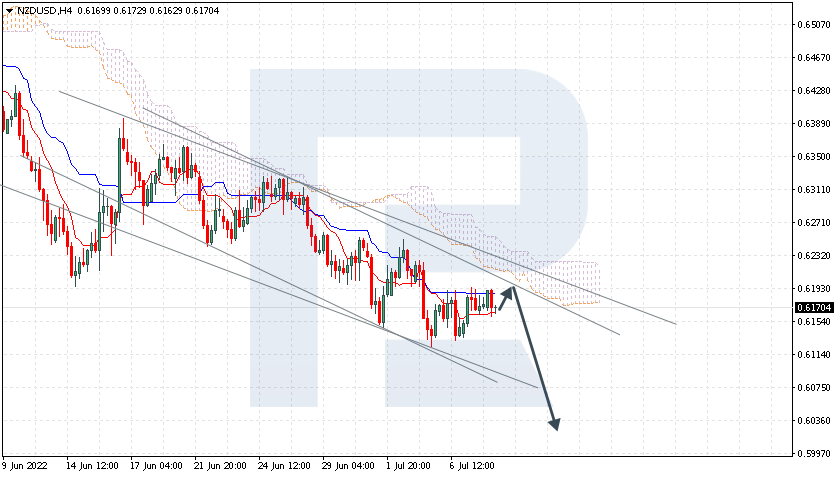
NZDUSD is testing the support level. The instrument is currently moving below Ichimoku Cloud, thus indicating a descending tendency. The markets could indicate that the price may test the cloud’s downside border at 0.6195 and then resume moving downwards to reach 0.6035. Another signal in favour of a further downtrend will be a rebound from the descending channel’s upside border. However, the bearish scenario may no longer be valid if the price breaks the cloud’s upside border and fixes above 0.6265. In this case, the pair may continue growing towards 0.6355.

NZDUSD

Article By RoboForex.com

Attention!
Forecasts presented in this section only reflect the author’s private opinion and should not be considered as guidance for trading. RoboForex LP bears no responsibility for trading results based on trading recommendations described in these analytical reviews.

Week Ahead: Higher-than-expected US inflation could see more USD strength

By ForexTime

Inflation.

You’re probably sick of hearing about it, and likelier still to be sick of living with it.

But that doesn’t mean that markets will ignore it.

Inflation remains arguably the single most important piece of economic data for markets in signalling the road ahead for central banks and the global economy.

With all that in mind, the market’s collective focus is set to be primed towards the upcoming release of the US consumer price index (CPI) amid these scheduled economic data releases and events across major economies:


Monday, July 11

  • CNH: China June FDI
  • JPY: Bank of Japan Governor Haruhiko Kuroda speech
  • NOK: Norway June CPI
  • GBP: BOE Governor Andrew Bailey appears before UK Treasury Committee
  • USD: New York Fed President John Williams speech
  • Natural Gas: Nord Stream 1 gas pipeline undergoes maintenance through July 21

Tuesday, July 12

  • AUD: Australia July consumer and business confidence
  • EUR: Germany July ZEW survey expectations
  • GBP: BOE Governor Andrew Bailey speech

Wednesday, July 13

  • CNH: China June external trade
  • NZD: RBNZ rate decision
  • EUR: Eurozone May industrial production, Germany June CPI (final print)
  • GBP: UK May GDP, industrial production, external trade
  • USD: US June CPI, Fed Beige Book
  • CAD: Bank of Canada rate decision
  • US crude: EIA weekly oil inventory report

Thursday, July 14

  • JPY: Japan May industrial production (final print)
  • AUD: Australia June unemployment, July consumer inflation expectations
  • USD: US weekly jobless claims
  • S&P 500: US earnings season kicks off – JPMorgan, Morgan Stanley

Friday, July 15

  • CNH: China Q2 GDP, June industrial production, retail sales
  • USD: US June retail sales, industrial production, July consumer sentiment, Atlanta Fed President Raphael Bostic speech
  • Wells Fargo, Citigroup Q2 earnings


The median estimate for the June CPI is 8.8%, and if so, would mark the fastest year-on-year rise in consumer prices since the 8.9% print back in December 1981.

Should headline inflation exceed market expectations, that could lead to even more gains for the US dollar.

For recent reference, one only has to look at what transpired immediately following the higher-than-expected May CPI released on June 10th.

That upside inflation surprise placed the equally-weighted USD index en route to a fresh 2022 high, before eventually claiming the 1.20 mark, where it still lingers closeby.


At the time of writing, markets have yet to fully price in another jumbo-sized 75 basis point hike by the Fed at its next policy meeting in the final week of July.

Recall that the Fed triggered a 75bps hike last month – its largest hike since 1994 – with the aim of subduing consumer prices.

Further evidence that US inflation remains stubbornly elevated, despite the Fed already raising rates by 150 basis points so far this year, could mean that the Fed has to remain aggressive in order to maintain its inflation-fighting credibility.


Such a narrative could mean a stronger greenback, especially given that the US economy appears better able to withstand higher interest rates compared to other major economies such as the Eurozone and the UK.

Note these six pairs that make up this USD index, all in equal weights:

  • EURUSD
  • GBPUSD
  • USDCHF
  • USDCAD
  • AUDUSD
  • NZDUSD

Greater divergence in the Fed’s rate hiking plans relative to the ECB/BOE’s (and also widening yield spreads across the Atlantic) could ultimately allow the USD index to keep its head above 1.20, pending how the buck reacts to the US nonfarm payrolls print due in a few hours from now.


Forex-Time-LogoArticle by ForexTime

ForexTime Ltd (FXTM) is an award winning international online forex broker regulated by CySEC 185/12 www.forextime.com

The cryptocurrency market digest (BTC, ETH, XRP). Overview for 08.07.2022

Article By RoboForex.com

The major cryptocurrency is keeping its positive momentum on Friday – the asset has been growing for three session sin a row. At the moment, the instrument is mostly trading around $21,765. The crypto market capitalisation is also increasing – it reached $0.970 trillion. The sector is following the US stock indices. The correlation between S&P 500/NASDAQ and the BTC helps the cryptocurrency to rise.

Later today, market players will closely watch the US labour statistics for June. Strong numbers will make capital markets continue rising, while weak ones will help bears regain dominance.

Technically, the BTC is currently trying to reach the resistance at $23,500 – the asset must fix above this level if it wants to continue rising. If it happens, all the discussions about crypto winter may quiet down. Of course, this scenario may come true, but it’s highly unlikely.

Top 10: BTC and ETH gained the lead

In the last 24 hours, all major cryptos from Top 10 have climbed into positive territory. The best of them were the BTC and the ETH. DOGE, SOL, and ADA gained about 3.5%. The weakest but still positive dynamics were seen in BNB (+1.9%).

Ripple: closer to reality

Ripple and the Columbian government launched the national system to Issue land registry certificates based on XRP Ledger. The system will allow users to register digital assets on XRPL and verify their authenticity with a QRCode.

The UK wants to lay a tax on DeFi

The British government is considering a possibility of laying a tax on crypto loans, as well as token staking in the context of decentralised finance. As a first step, it should be realised how to reduce expenses for industry taxpayers, and then specify whether the taxation scheme can fit to transaction economics.

Article By RoboForex.com

Attention!
Forecasts presented in this section only reflect the author’s private opinion and should not be considered as guidance for trading. RoboForex LP bears no responsibility for trading results based on trading recommendations described in these analytical reviews.

The Analytical Overview of the Main Currency Pairs on 2022.07.08

By JustForex

The EUR/USD currency pair

Technical indicators of the currency pair:
  • Prev Open: 1.0181
  • Prev Close: 1.0161
  • % chg. over the last day: -0.20%

The US dollar declined in the European session on Thursday but remained near a 20-year high yesterday as the Federal Reserve remained hawkish. Many factors are contributing to the dollar’s rise, but the main among them is an aggressive tightening of monetary policy by the US Central Bank. Fed’s last meeting minutes, released on Wednesday, indicated another 75 basis point hike in July. According to analysts, if Europe and the US fall into recession in the third quarter while the Fed continues to raise rates, the EUR/USD exchange rate will fall below 1. The published minutes of the European Central Bank’s June meeting suggest the door is still open for a rate hike of more than 25 basis points at the upcoming July 21 meeting. But for now, the baseline scenario of the ECB raising interest rates by 25 bps in July and another 50 bps in September has the highest probability.

Trading recommendations
  • Support levels: 1.0135
  • Resistance levels: 1.0221, 1.0284, 1.0365, 1.0415, 1.0504, 1.0564, 1.0611

From the technical point of view, the trend on the EUR/USD currency pair on the hourly time frame is bearish. At the moment, the price is trading below the moving averages, and the MACD indicator is in the negative zone, but there is a strong divergence. Under such market conditions, sell deals can be considered from the resistance level of 1.0221 or 1.0284, but only after the additional confirmation. Buy trades are best to look for on intraday time frames from the support level of 1.0135, but only with confirmation and short targets.

Alternative scenario: if the price breaks out through the 1.0415 resistance level and fixes above, the uptrend will likely resume.

EUR/USD
News feed for 2022.07.08:
  • – Eurozone ECB President Lagarde Speaks at 14:55 (GMT+3);
  • – US Nonfarm Payrolls (m/m) at 15:30 (GMT+3);
  • – US Unemployment Rate (m/m) at 15:30 (GMT+3);
  • – US FOMC Member Williams Speaks at 18:00 (GMT+3).

The GBP/USD currency pair

Technical indicators of the currency pair:
  • Prev Open: 1.1921
  • Prev Close: 1.2023
  • % chg. over the last day: +0.86%

Boris Johnson announced that he is stepping down as British Prime Minister. But this did not affect the British pound, on the contrary, the British currency increased yesterday. Traders and investors had already expected this move after dozens of senior ministers resigned in recent days in protest against Johnson’s leadership. Growing obstacles on the macroeconomic front for the UK and monetary policy divergence between the US Federal Reserve and the Bank of England will continue to be the main catalysts for price movements on the GBP/USD currency pair.

Trading recommendations
  • Support levels: 1.1985, 1.1929
  • Resistance levels: 1.2065, 1.2095, 1.2137

From the technical point of view, the trend on the GBP/USD currency pair on the hourly time frame is bearish. The euro and the pound do not correlate at the moment, with the pound showing more resilience. The price is trading below the moving averages, the MACD indicator has become positive, and there is buying pressure. Under such market conditions, sell deals can be considered from the resistance level of 1.2065, but only after the additional confirmation. Buy trades are best to look for on intraday time frames from the support level of 1.1985 or 1.1929, but only with confirmation and short targets.

Alternative scenario: if the price breaks out through the 1.2137 resistance level and fixes above, the uptrend will likely resume.

GBP/USD
There is no news feed for today.

The USD/JPY currency pair

Technical indicators of the currency pair:
  • Prev Open: 135.92
  • Prev Close: 136.01
  • % chg. over the last day: +0.15%

Terrible news came from Japan. During the speech of the former Japanese Prime Minister Shinzo Abe, there was an attempted attack on the Prime Minister, as a result of which, according to preliminary information, Abe suffered a cardiac arrest from his injuries. Shinzo Abe is now in hospital, and his condition is unknown. Several other people were also injured. The suspect has been arrested. The Japanese yen reacted to this event with slight growth.

Trading recommendations
  • Support levels: 135.40, 134.64, 134.11, 133.35, 131.67, 131.00, 130.12, 129.48, 128.76
  • Resistance levels: 135.87, 136.48

From the technical point of view, the medium-term trend on the USD/JPY currency pair is bullish. The MACD indicator has become inactive, and the price continues to form a wide balance. Under such market conditions, buy trades can be considered from the support level of 135.40, but with confirmation. A resistance level of 136.48 is good for sell deals, but only with additional confirmation and short targets.

Alternative scenario: If the price fixes below 133.35, the downtrend will likely resume.

USD/JPY
There is no news feed for today.

The USD/CAD currency pair

Technical indicators of the currency pair:
  • Prev Open: 1.3045
  • Prev Close: 1.2966
  • % chg. over the last day: -0.61%

The outlook for the Canadian dollar is becoming less optimistic due to growing recession fears. Many analysts believe the Canadian dollar has strengthened throughout the year due to rising oil prices. Oil has fallen about $25 in recent weeks, diving below $100 a barrel, and Canada’s commodity-linked stock market has fallen by 15% below its March record high. However, it should be noted that the Bank of Canada has been aggressively raising interest rates during this time to keep up with the US Federal Reserve’s fight against inflation. Meanwhile, the Bank of Canada intends to raise its overnight rate by 75 basis points next week and another 50 bps in September. Currently, the risks are shifting to a lower Canadian dollar if a recession in the US occurs before Canada and oil prices continue to fall.

Trading recommendations
  • Support levels: 1.2959, 1.2934, 1.2894
  • Resistance levels: 1.3021, 1.3052

In terms of technical analysis, the trend on the USD/CAD currency pair is bullish. The price has corrected to the average values, and the MACD indicator has become inactive. Under such market conditions, it is best to look for buy trades on the lower time frames from the support level of 1.2959 or 1.2934. For sell deals, it is best to consider the resistance level of 1.3021, but it is also better with confirmation and short targets.

Alternative scenario: if the price breaks through and consolidates below the 1.2894 support level, the downtrend will likely resume.

USD/CAD
News feed for 2022.07.08:
  • – Canada Unemployment Rate (m/m) at 15:30 (GMT+3).

By JustForex


This article reflects a personal opinion and should not be interpreted as an investment advice, and/or offer, and/or a persistent request for carrying out financial transactions, and/or a guarantee, and/or a forecast of future events.

Boris Johnson has resigned. Assassination attempt on former Japanese Prime Minister Shinzo Abe

By JustForex

The US Federal Reserve officials Bullard and Waller had nothing new to say yesterday. The labor market remains resilient, monetary tightening is already affecting the economy, and expectations for economic growth – that was said many times before. To summarize, the US Fed remains hawkish. The minutes of the Fed’s last meeting, released Wednesday, indicated another 75 basis point hike in July.

Initial US jobless claims rose to their highest level since January. Analysts continue to note that the labor market remains tight. The main focus of investors today will be Non-farm Payrolls data in the US. If the data is worse than expected, it could be a reason for the Fed to reconsider a rate hike down to 50 basis points in July.

US indices jumped yesterday thanks to a rebound in energy stocks on the back of rising oil prices. The Dow Jones (US30) added 1.12% at the close of trading, while the S&P 500 (US500) increased by 1.50%. The Technology Index NASDAQ (US100) gained 2.28% on Thursday. All three indices closed on the plus side at the end of the day.

Stock markets in Europe were mostly up yesterday. German DAX (DE30) gained 1.97%, French CAC 40 (FR40) jumped by 1.60%, Spanish IBEX 35 (ES35) gained 2.19%, British FTSE 100 (UK100) was up by 1.14%.

Deutsche Bank suggested that the euro could fall into the $0.95-0.97 range if Europe and the US are dragged into a deeper recession. The Eurozone’s single currency has been steadily declining as recession fears are heightened amid growing uncertainty over energy supplies as Russia threatens to cut gas supplies to Germany further and the continent as a whole.

Boris Johnson has announced that he is stepping down as British prime minister. Traders and investors had already expected this step after dozens of high-ranking ministers resigned in recent days in protest against Johnson’s leadership.

Hungary’s national bank raised its key weekly deposit rate by 200 basis points to 9.75%, the highest level in a decade, to stem a weakening currency exacerbating an increasingly acute inflation problem. Core consumer prices in the country rose more than 12% from the beginning of the year through May, while food prices rose by 20% a year earlier.

Natural gas futures continue to rise as the EIA reports a smaller-than-expected increase in US inventories. The government said total working gas inventories in storage are 2.311 trillion cubic feet, down 261 billion cubic feet from a year ago and 322 billion cubic feet below the five-year average.

Oil prices soared again yesterday, with WTI climbing sharply above $100 amid rumors of a power outage in Texas that could lead to capacity cuts. Meanwhile, crude oil inventories data unexpectedly rose by 8.2 million barrels while forecasting a decline of 2.8 million barrels. There is still a supply shortage, so analysts think traders should not expect oil prices to fall too much.

Asian markets closed yesterday with a growth. Japan’s Nikkei 225 (JP225) gained 1.47% yesterday, Hong Kong’s Hang Seng (HK50) gained 0.26% on the day, and Australia’s S&P/ASX 200 (AU200) was up by 0.81% on Thursday.

Terrible news came from Japan. During the speech of the former Japanese Prime Minister Shinzo Abe, there was an attack on the prime minister. According to preliminary information, Abe suffered a cardiac arrest from his injuries. Shinzo Abe is now in hospital, and his condition is unknown. There were also several other people. The suspect has been arrested.

S&P 500 (F) (US500) 3,902.62 +57.54 (+1.50%)

Dow Jones (US30) 31,384.55 +346.87 (+1.12%)

DAX (DE40) 12,843.22 +248.70 (+1.97%)

FTSE 100 (UK100) 7,189.08 +81.31 (+1.14%)

USD Index 107.09 0.00 (+0.00%)

Important events for today:
  • – Eurozone ECB President Lagarde Speaks at 14:55 (GMT+3);
  • – US Nonfarm Payrolls (m/m) at 15:30 (GMT+3);
  • – US Unemployment Rate (m/m) at 15:30 (GMT+3);
  • – Canada Unemployment Rate (m/m) at 15:30 (GMT+3);
  • – US FOMC Member Williams Speaks at 18:00 (GMT+3).

By JustForex


This article reflects a personal opinion and should not be interpreted as an investment advice, and/or offer, and/or a persistent request for carrying out financial transactions, and/or a guarantee, and/or a forecast of future events.

UK political drama adds to GBP’s woes

By ForexTime

News that Boris Johnson has resigned as UK Prime Minister offered scant relief for the British Pound.

Though climbing some 0.4% at the time of writing, GBPUSD is straining to hang on to the psychologically-important 1.20 level.

Today’s bounce could be down to some price action surrounding the rumour and the fact, noting that expectations surrounding Johnson’s resignation had been bubbling for some time now.

Technical forces could even be at play today, with GBPUSD’s 14-day relative strength index pulling away from the 30 threshold which denotes oversold conditions.

Overall, today’s headlines out of 10 Downing Street hasn’t resulted in a seismic move for GBPUSD.


To be fair to the beleaguered Sterling, it is set for its largest single-day gain so far this month – scant consolation when put into its proper context, as seen in the chart above.

The British Pound though is registering an advance against all of its G10 peers for the day, except against commodity-linked currencies such as the Australian dollar and the New Zealand dollar.


And yet, there are other more-pressing factors that are set to keep the Pound on the back foot for the months ahead.


For one, the UK may already be in a recession, considering that its economic data has made for some dismal reading:

  • UK economy saw an unexpected contraction back in April, shrinking by 0.3% compared to March – its sharpest drop in over a year. Q2 data suggests another quarterly contraction – fulfilling the criteria for a technical recession.
  • The UK is running a massive current account deficit, which ran at 4.2% of its GDP in the first quarter this year – one of the largest such deficits in the world!
  • UK inflation is at its highest in 40 years. The May consumer price index (CPI – which is used to measure top line inflation) rose by 9.1% in May – its highest reading since Q1 1982. Inflation is also forecasted to reach double-digits in Q4 2022.


And although the Bank of England (BOE) appears committed to hiking its rates in the name of cooling scorching-hot inflation, such aggressive moves only ramp up the prospects of a UK recession, given such weak underlying economic fundamentals.

In fact, the BOE had already issued a warning back in May of a possible recession.

Also back in May, our article featured this line: “A path towards 1.20 may prove likelier for this currency pair known as ‘cable’, rather than a path back up to 1.30.”


But wait, there’s more.

There are still Brexit risks to contend with, while surge in Covid-19 cases in the UK aren’t helping matters.


Of course, the fiscal outlook (how the government can support the UK economy) is very much dependent on the policies of the incoming UK Prime Minister, and it could be weeks or months before Johnson’s replacement is determined, with more time needed for their policies to be formed, and later still to be enacted before showing up in the real economic data.

As things stand, markets are pricing in a 60% chance that we could see GBPUSD reach 1.15 sometime in Q4.

In short, there’s hardly any reason to be optimistic about the UK economic outlook, which is set to expose GBPUSD to more downside, while hampering cable’s ability to register any significant recovery over the near term.


Forex-Time-LogoArticle by ForexTime

ForexTime Ltd (FXTM) is an award winning international online forex broker regulated by CySEC 185/12 www.forextime.com

Japanese Candlesticks Analysis 07.07.2022 (USDCAD, AUDUSD, USDCHF)

Article By RoboForex.com

USDCAD, “US Dollar vs Canadian Dollar”

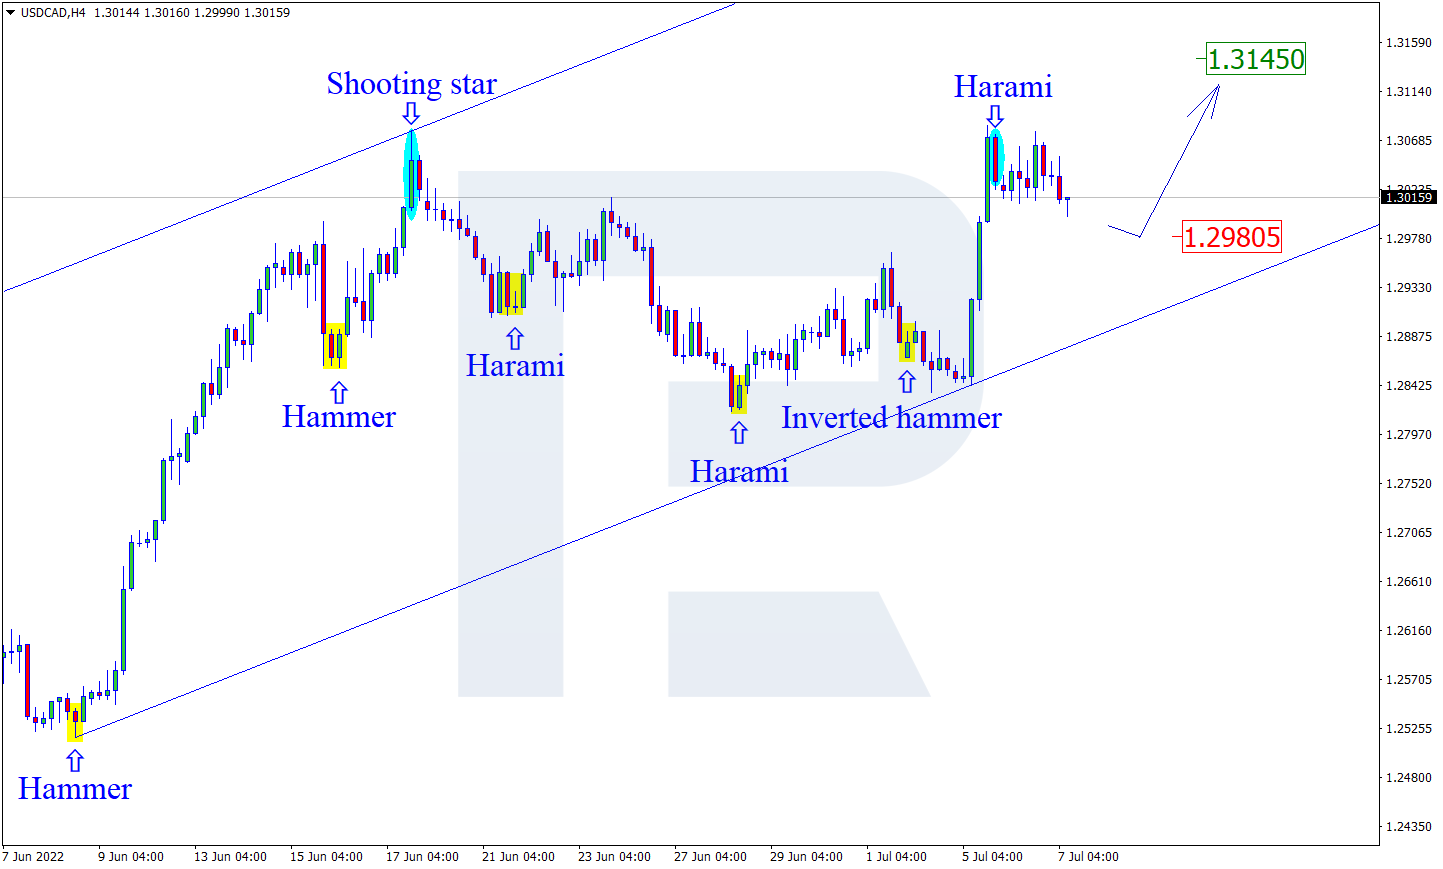
As we can see in the H4 chart, after forming a Harami reversal pattern close to the resistance level, USDCAD may reverse in the form of another correctional impulse. In this case, the downside correctional target may be the support area at 1.2980. Later, the market may rebound from this level and resume growing. However, an alternative scenario implies that the asset may grow to reach 1.3145 and continue the uptrend without testing the support area.

USDCAD
Risk Warning: the result of previous trading operations do not guarantee the same results in the future

AUDUSD, “Australian Dollar vs US Dollar”

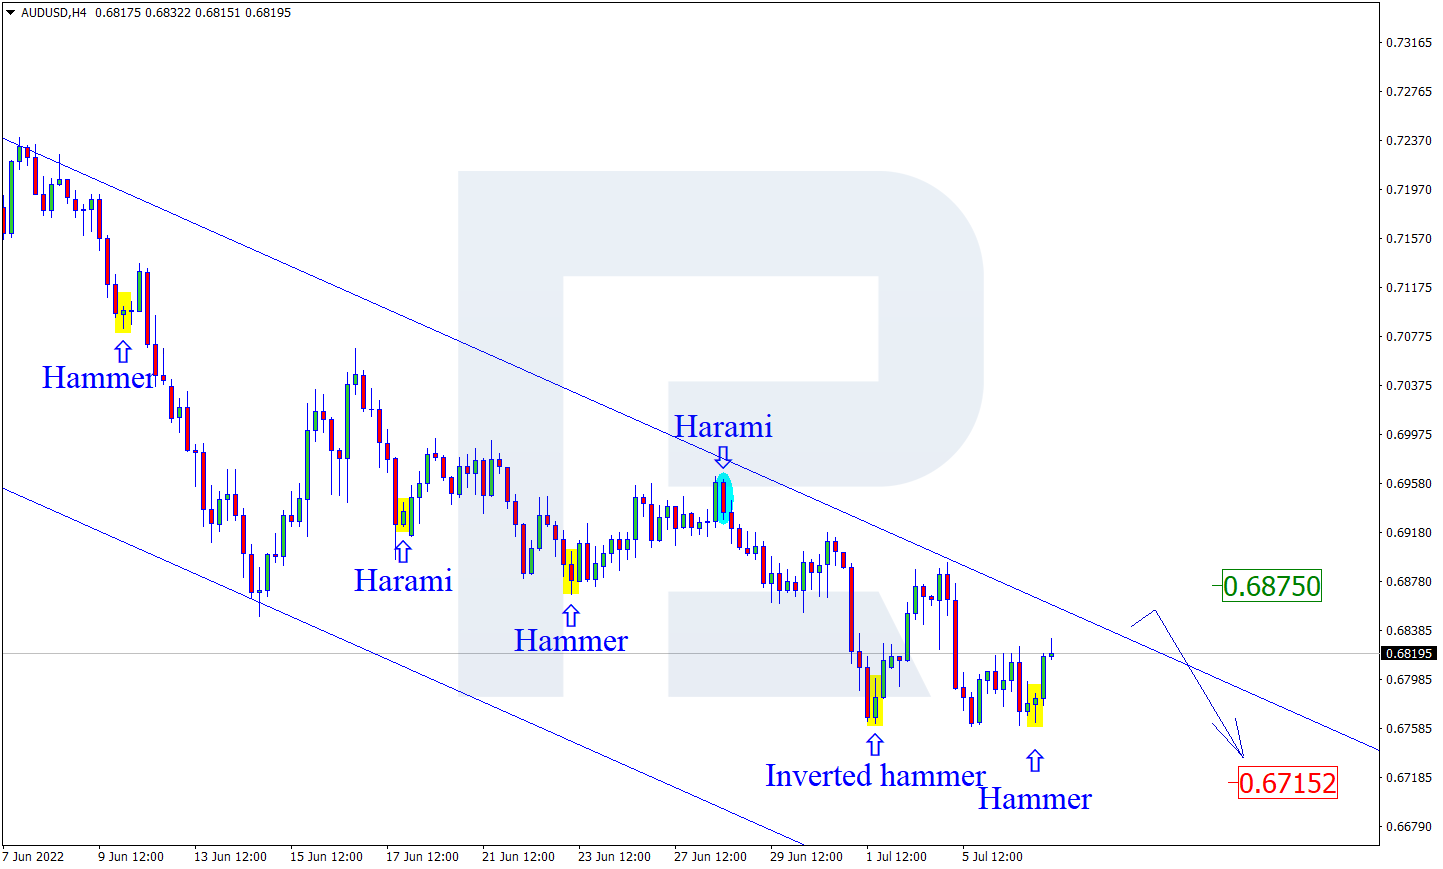
As we can see in the H4 chart, AUDUSD has formed a Hammer reversal pattern near the support area. At the moment, the asset is reversing in the form a new rising impulse. In this case, the upside target may be the resistance level at 0.6875. After testing the level, the price may rebound from it and resume the descending tendency. At the same time, the opposite scenario implies that the price may fall to reach 0.6715 and continue the downtrend without any corrections.

AUDUSD
Risk Warning: the result of previous trading operations do not guarantee the same results in the future

USDCHF, “US Dollar vs Swiss Franc”

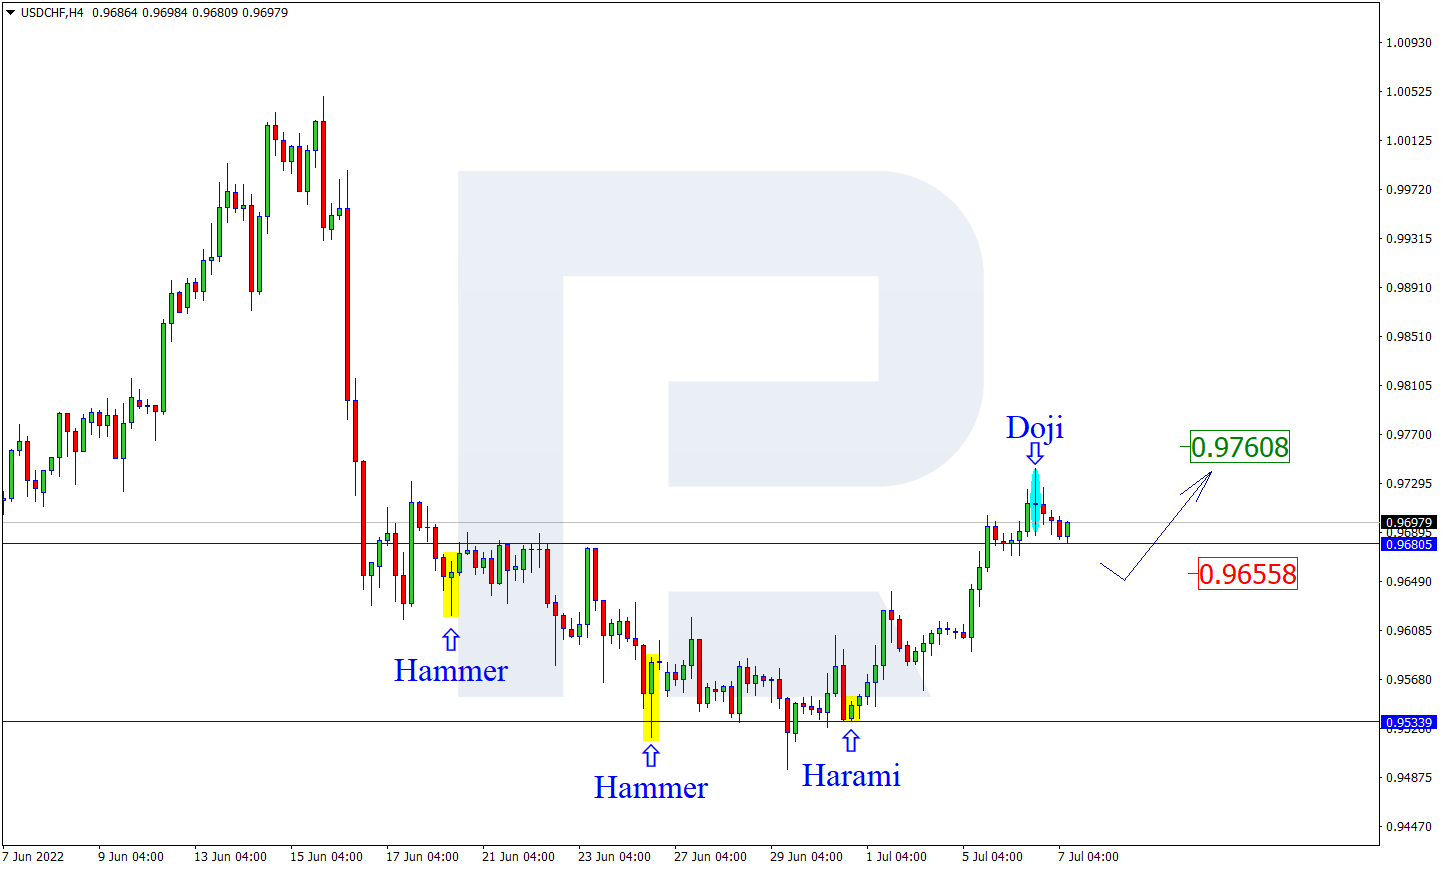
As we can see in the H4 chart, after testing the resistance area, the pair has formed several reversal patterns, for example, Doji. At the moment, USDCHF may reverse in the form of a new correctional impulse. In this case, the downside correctional target may be at 0.9655. After testing the support level, the price may rebound from it and resume trading upwards. Still, there might be an alternative scenario, according to which the asset may grow to reach 0.9760 and continue the ascending tendency without any pullbacks.

USDCHF

Article By RoboForex.com

Attention!
Forecasts presented in this section only reflect the author’s private opinion and should not be considered as guidance for trading. RoboForex LP bears no responsibility for trading results based on trading recommendations described in these analytical reviews.

Netflix: Way More Room to Drop

“Doubled eleven times in 19 years … then cut in half twice”

By Elliott Wave International

The glory days of at least one of the FAANG stocks appear to be all but over — at least for now.

As revenue shrinks at Netflix, more heads have rolled at the subscription-based streaming service of movies and television shows.

A June 23 Variety headline says:

Netflix Begins Second Round of Layoffs, 300 Positions Cut

About a month ago, around 150 employees were let go.

The layoffs are also occurring amid a deflation in the company’s stock price.

The May Elliott Wave Theorist, a monthly publication which offers analysis of financial markets and cultural trends, provided this chart and eye-opening perspective:

Netflix is down 70% from its high. Many people think it can’t go lower. Is this an indication that stocks are near a major bottom?

[The chart] shows the stock’s price history. From its low at $0.35 in 2002, Netflix doubled eleven times in 19 years to reach 700.99. Since then, it has been cut in half twice. There is certainly room for more halvings. If you want to monitor the milestones, they are: 700.99, 350.50, 175.25, 87.62, 43.81, 21.91, 10.95, 5.48, 2.74, 1.37, 0.68 and 0.34.

Keep in mind that this is a picture of a stock that has been aggressively bid lower since November 2021. Many stocks are still near highs and have far more room to fall than Netflix.

Since the end of Q1 alone, Netflix’s stock is down 53% with a price of $176.32, as of this intraday writing on June 29.

The Elliott Wave Theorist is also keeping subscribers apprised of the stock market’s big picture and just know that most investors have no idea of what is likely just ahead.

Yes, the Elliott wave structure of the main U.S. stock indexes is sending a clear and ominous message.

If you’d like to learn how the Elliott wave model can help you analyze financial markets, you are encouraged to read Frost & Prechter’s Wall Street classic, Elliott Wave Principle: Key to Market Behavior. Here’s a quote from that book:

After you have acquired an Elliott “touch,” it will be forever with you, just as a child who learns to ride a bicycle never forgets. Thereafter, catching a turn becomes a fairly common experience and not really too difficult. Furthermore, by giving you a feeling of confidence as to where you are in the progress of the market, a knowledge of Elliott can prepare you psychologically for the fluctuating nature of price movement and free you from sharing the widely practiced analytical error of forever projecting today’s trends linearly into the future. Most important, the Wave Principle often indicates in advance the relative magnitude of the next period of market progress or regress. Living in harmony with those trends can make the difference between success and failure in financial affairs.

Here’s the good news: You can read the entire online version of the book for free once you become a Club EWI member.

Club EWI is the world’s largest Elliott wave educational community and is free to join. More than that, members enjoy free access to a wealth of Elliott wave resources on investing and trading without any obligations.

Just follow this link to get started: Elliott Wave Principle: Key to Market Behavior — free and unlimited access.

This article was syndicated by Elliott Wave International and was originally published under the headline Netflix: Way More Room to Drop. EWI is the world’s largest market forecasting firm. Its staff of full-time analysts led by Chartered Market Technician Robert Prechter provides 24-hour-a-day market analysis to institutional and private investors around the world.