Horizen Launches No-Code Tokenization Platform, TokenMint, on Mainnet

TokenMint will make tokenization streamlined and accessible to the masses

New York, NY (July 14 , 2022) – Horizen, a privacy-focused zero-knowledge network of blockchains powered by the largest node system, announced the mainnet launch of its no-code tokenization platform TokenMint.

TokenMint, which aims to bridge the accessibility gap in token creation, is an automated drag-and-drop platform that allows people with or without programming knowledge to create their own token with custom tokenomics. The current Alpha version of the TokenMint platform consists of basic functionalities for creating a fungible token. Future versions will integrate a wider range of features like NFT support and zkSNARKs, a privacy technology that will enable provable tokenomics and preserve user privacy.

“Tokenization will serve as one of the main driving forces behind the wave of innovation in blockchain and growth in the adoption of decentralized applications in coming years. A platform like TokenMint can play an important role in making tokenization accessible to mainstream users,” said Rob Viglione, co-founder of Horizen and Horizen Labs. “Notably, no programming knowledge is required for creating a token using TokenMint so users can get started right away. Our long-term goal for the platform is to achieve provable tokenomics while enhancing user privacy, a move that will further break the barriers between tokenization and the masses.”

TokenMint, comprising three key tools, is designed to provide a seamless, simple and intuitive user experience. The platform comes equipped with the Token Generator for creating and minting tokens, as well as a block explorer, where transactions are displayed for easy tracking. The platform’s Cobalt Wallet allows users to store, manage and transact tokens created on the platform. These tools are built on the TokenMint Chain, a sidechain that runs on the Horizen network.

“We leverage agile methodologies to bring immediate value to our community through early and continuous delivery of our software. The TokenMint alpha release is just the beginning, as our product and engineering teams will continue to rapidly iterate on it with shorter delivery cycles that immediately address the evolving needs of Web3 and the crypto movement.  We look forward to having TokenMint drive forth additional mainstream adoption,” said Zain Cheng, VP of Engineering, Horizen Labs.

About Horizen 

Horizen is the zero-knowledge network of blockchains powered by the largest node system and a massively scalable cross-chain protocol. Horizen offers best-in-class tools for developers to custom-build private or public blockchains with the level of flexibility unmatched by others. By building on Horizen, developers have the freedom to fully customize their blockchains including consensus, speed, privacy, and crypto-economies. Blockchains built on Horizen produce massive throughput without compromising decentralization. Please visit www.horizen.io for more information.


Wipeout! New Update on Our “Green Bond” (ESG) Forecast

Excessive euphoria in financial markets is usually a big reason to be “skeptical”

By Elliott Wave International

Environmental, Social and Governance bonds (ESG) — also called “green” bonds — are offered by companies which want to advance the causes of social justice, social inclusion and green technology.

This form of debt had been steadily gaining in popularity — going from sales of less than $100 billion in 2015 to around $800 billion in 2020.

For instance, here’s an Oct. 9, 2020 headline from Pensions & Investments:

University of Toronto’s $7 billion fund makes bet on ESG debt

However, the Elliott wave structure of a global green-bond index was sending a warning signal.

The July Global Market Perspective, a monthly Elliott Wave International publication which covers 50-plus worldwide financial markets, shows a chart from the December 2020 Global Market Perspective (on the left) and an updated chart on the right.

Focusing on the left chart first, which had sported a five-wave advance (meaning a trend turn was imminent), the December 2020 Global Market Perspective said:

Experts have loudly proclaimed that so-called social bonds will be the next great innovation. … But the euphoria surrounding this new debt is actually one of the biggest reasons to remain skeptical. … Steer clear of both green bonds and social bonds.

Indeed, as the updated right chart shows, the price began to fall shortly after that warning. Eventually, a countertrend rally ensued and by July 13, 2021, a Bloomberg headline said:

ESG Bond Sales Sprint to $1 Trillion as Investors Force Change

Once again, the Global Market Perspective provided a warning — this one from the August 2021 issue:

The wipeout could be one of the biggest ever.

You can see the big price tumble that occurred thereafter.

Do understand that the Elliott wave model does not guarantee that a financial market will behave in one fashion or another. At the same time, it’s the best analytical method of which Elliott Wave International knows because it’s based on the repetitive patterns of investor psychology.

Indeed, here’s what Frost & Prechter had to say in Elliott Wave Principle: Key to Market Behavior:

The Wave Principle is governed by man’s social nature, and since he has such a nature, its expression generates forms. As the forms are repetitive, they have predictive value. [emphasis added]

For a limited time, our friends at Elliott Wave International are offering you 5 quick takes on Elliott wave patterns in several markets — stocks, pot stocks and bonds — all from their new, July 2022 issue of the Global Market Perspective.

The publication provides analysis for 50+ of the world’s key markets.

See what warnings it’s issuing now.

FREE, check out 5 short excerpts from the new, July Global Market Perspective

This article was syndicated by Elliott Wave International and was originally published under the headline Wipeout! New Update on Our “Green Bond” (ESG) Forecast. EWI is the world’s largest market forecasting firm. Its staff of full-time analysts led by Chartered Market Technician Robert Prechter provides 24-hour-a-day market analysis to institutional and private investors around the world.

Five ways that the super-strong US dollar could hurt the world economy

By Alexander Tziamalis, Sheffield Hallam University and Yuan Wang, Sheffield Hallam University 

– The US dollar has been on a major surge against major global currencies in the past year, recently hitting levels not seen in 20 years. It has gained 15% against the British pound, 16% against the euro and 23% against the Japanese yen.

The dollar is the world’s reserve currency, which means it is used in most international transactions. As a result, changes in its value have implications for the entire global economy. Below are five of the main ones.

US dollar strength 1977-2022

Chart showing the strength of the dollar since 1980
The US dollar index or DXY is the US dollar measured against a basket of world currencies.
Trading View

1. Even more inflation

Petrol and most commodities such as metals or timber are usually traded in US dollars (though with exceptions). So when the dollar gets stronger, these items cost more in local currency. For example in British pounds, the cost of US$100-worth of petrol has risen over the past year from £72 to £84. And since the price per litre of petrol in US dollars has risen steeply as well, it is creating a double whammy.

When energy and raw materials cost more, the prices of many products go up for consumers and businesses, causing inflation around the world. The only exception is the US, where a stronger dollar makes it cheaper to import consumer products and therefore could help to tame inflation.

2. Low-income countries under threat

Most developing countries owe their debt in US dollars, so many owe much more now than a year ago. As a result, many will struggle to find an ever increasing amount of local currency to service their debts.

We are already seeing this in Sri Lanka, and other countries may soon follow suit. They will either have to tax their economies more, issue inflationary local money or simply borrow more. The results could be deep recession, hyper-inflation, a sovereign debt crisis or all three together, depending on the path chosen. Developing countries which fall into sovereign debt crises can take years or even decades to recover, causing severe hardship to their people.

3. A bigger US trade deficit

Other countries will buy fewer US products as a result of the strong dollar.
The US trade deficit, which is the difference between the amount of exports and imports, already runs close to a mammoth one trillion dollars per year. President Joe Biden and Donald Trump before him vowed to reduce it, particularly against China. Some economists worry that the trade deficit drives up US borrowing and reflects the fact that many manufacturing jobs have moved overseas.

US trade deficit as a % GDP

Chart showing US trade deficit as a percentage of GDP
Trading Economics

4. De-globalisation to get worse

The most obvious economic policy to prevent a trade deficit from growing is the old game of imposing tariffs, quotas or other barriers on imports. Other countries tend to retaliate against such protectionism, adding their own taxes and other barriers to US products. In an era when “de-globalisation” has already begun thanks to worsening western relations with Russia and China, a stronger dollar adds to the political momentum for protectionism and threatens global trade.

5. Eurozone fears

Weaker EU member states such as Portugal, Ireland, Greece and Cyprus have become somewhat less vulnerable to investors driving up their borrowing costs to crisis levels than during the darkest days of the eurozone crisis. This is because much of their national debt is now in the hands of the the European Stability Mechanism (ESM), which was set up to help rescue them, as well as friendlier investment banks within the eurozone.

However, the stronger dollar is creating pressure for the European Central Bank to raise its own interest rates to prop up the euro and subdue the cost of imports, including energy. This will put more pressure on eurozone countries with high levels of debt. Italy, which is the ninth largest economy in the world and has government debts at a whopping 150% of GDP, would be particularly hard to bail out if the situation got out of control.

Bringing these five points together, the ultra-strong dollar is yet another reason to fear a global recession in the coming period. Higher inflation erodes consumer incomes and reduces consumption. Protectionism can reduce international trade and investment. Sovereign debt crises mean serious trouble for many developing countries and possibly even the eurozone.

Will the dollar keep rising?

The dollar has been rising for both economic and geopolitical reasons. The central bank of the US – the Federal Reserve – has been hiking interest rates aggressively and also reversing its policy of creating money via quantitative easing (QE). This is with a view to curbing inflation caused by COVID supply issues, the war in Ukraine and also QE.

The stronger US dollar is a side effect of these higher interest rates. Because the dollar now offers a higher yield when deposited in a US bank, it encourages foreign investors to sell their local currency and buy US dollars.

Of course, central banks in other jurisdictions such as the UK have also been raising interest rates, and the eurozone is planning to do likewise. But they are not acting as aggressively as the US. Meanwhile Japan is not tightening at all, so the net result is still greater overseas demand for greenbacks.

The other reason for the surging US dollar is because it is a classic safe haven when the world is worried about a recession – and the current geopolitical situation is arguably making it still more appealing. The euro has suffered from the EU’s proximity to the war in Ukraine, its exposure to Russian energy and the prospect of another eurozone crisis. It is close to dollar parity for the first time since its early years.

The British pound has been hit by Brexit and is also facing the prospect of a second Scottish independence referendum and a potential trade war with the EU over the Northern Ireland protocol. Finally, the yen belongs to an economy that seems to be slowly losing ground. Japan is ageing and is still not comfortable with migration to boost its production capabilities. A weaker yen is also the price that Japan pays for continuing QE to keep the interest rates low on its government debt.

It is difficult to predict the future direction of the US dollar when there are so many moving parts in the world economy. But we suspect that persistent inflation will force US interest rates to keep rising, and that together with geopolitical shocks from war and sovereign debt defaults, it will probably keep the dollar high. A strong US dollar is a response to troubled times.The Conversation

About the Author:

Alexander Tziamalis, Senior Lecturer in Economics, Sheffield Hallam University and Yuan Wang, Seinor Lecturer in Economics, Sheffield Hallam University

This article is republished from The Conversation under a Creative Commons license. Read the original article.

 

Enriching uranium is the key factor in how quickly Iran could produce a nuclear weapon – here’s where it stands today

By Gary Samore, Brandeis University 

Iran’s nuclear program is a major topic in President Joe Biden’s meetings this week with leaders in the Middle East. The most challenging part of producing nuclear weapons is making the material that fuels them, and Iran is known to have produced uranium that is near-weapons grade.

The Conversation asked Brandeis University professor Gary Samore, who worked on nuclear arms control and nonproliferation in the U.S. government for over 20 years, to explain why uranium enrichment is central to Iran’s nuclear ambitions and where the Iranian effort stands now.

A cascade of gas centrifuges at a U.S. enrichment plant in Piketon, Ohio, in 1984. Iran is using similar technology to enrich uranium.
U.S. Department of Energy

What does it mean to enrich uranium?

Natural uranium contains two main isotopes, or forms whose atoms contain the same number of protons but different numbers of neutrons. It’s about 99.3% uranium-238 and 0.7% uranium-235. The uranium-235 isotope can be used to generate nuclear power for peaceful purposes, or nuclear explosives for military purposes.

Enrichment is the process of separating out and increasing the concentration of U-235 to higher levels above natural uranium. Generally speaking, lower levels of enriched uranium, such as uranium with 5% U-235, are commonly used for nuclear reactor fuel. Higher levels of enrichment, such as 90% U-235, are most desirable for nuclear weapons.

Diagram of a single centrifuge for enriching uranium.
A gas centrifuge separates uranium-235 atoms, which can sustain a nuclear chain reaction, from much more abundant atoms of uranium-238, which cannot. As the centrifuge rotates at high speed, uranium hexafluoride gas is pumped into it. The heavier U-238 molecules move toward the outer edge, and the lighter U-235 molecules move toward the center. The ‘product stream’ of gas enriched in U-235 is pumped through many more centrifuges, increasing the concentration of U-235 at each stage.
Inductiveload/Wikipedia

For military purposes, why are higher levels of enrichment important?

The higher the level of enrichment, the smaller the amount of nuclear material necessary to produce a nuclear weapon.

The International Atomic Energy Agency identifies 25 kilograms (55 pounds) of 90% enriched uranium as a “significant quantity” necessary for a simple nuclear weapon. But larger amounts of lower-enriched uranium can also work.

For example, the “Little Boy” atomic bomb that the U.S. dropped on Hiroshima, Japan, in 1945 used about 64 kilograms of uranium (141 pounds) enriched to an average of 80% U-235.

From a nuclear weapons design standpoint, smaller amounts of higher-enriched nuclear material are more desirable because that reduces the size and weight of the nuclear weapon and makes it easier to deliver. As a result, modern nuclear weapons based on uranium typically use uranium enriched to 90% to 93% U-235, which is known as weapons-grade uranium, for the primary fuel.

What had Iran achieved prior to the 2015 nuclear deal?

The 2015 nuclear deal between Iran, the U.S. China, France, the United Kingdom, Russia and Germany put significant restrictions on Iran’s nuclear program, in return for relief from a number of international sanctions. When the deal was adopted, Iran had mastered the basic technology for enriching uranium with gas centrifuges – cylinders that spin uranium in gas form at very high speeds to separate the heavier U-238 isotope from the lighter U-235 isotope.

At its two principal enrichment facilities, Natanz and Fordow, Iran was operating about 18,000 first-generation IR-1 centrifuges and about 1,000 second-generation IR-2 centrifuges. It had also accumulated a stockpile of roughly 7,000 kilograms (about 15,430 pounds) of low-enriched uranium (under 5%) and about 200 kilograms (440 pounds) of 20% enrichment uranium.

Based on these capabilities, Iran’s “breakout time” to produce about 25 kilograms (55 pounds) of 90% enriched uranium – enough for a single nuclear weapon – was estimated to be one or two months.

Breakout time is not intended to suggest that Iran would necessarily decide to produce weapons-grade uranium at these inspected facilities, because the risk of detection and of potential negative international reaction is very high.

How did the nuclear deal constrain Iran’s activities?

The 2015 nuclear deal put physical constraints on Iran’s enrichment program for 10 to 15 years, including the number and type of centrifuges Iran could operate, the size of its stockpile of low-enriched uranium and its maximum enrichment level.

For 15 years, no enrichment would take place at Fordow, and Iran’s stockpile of low-enriched uranium would be limited to 300 kilograms (660 pounds) at a maximum enrichment level of 3.67%. And for 10 years, its centrifuges would be limited to about 6,000 IR-1 centrifuges at Natanz.

In order to meet these physical limits, Iran shipped out to Russia most of its stockpile of low-enriched uranium and its entire stockpile of 20% enriched uranium. It also dismantled for storage inside Iran most of its IR-1 centrifuges and all of its more advanced IR-2 centrifuges. As a consequence of these limits, Iran’s “breakout time” was extended from a month or two before the deal to about one year after the deal.

After year 10 of the deal, however, Iran was allowed to start replacing its IR-1 centrifuges at Natanz with more advanced models, which it was permitted to continue to research and develop during the first decade of the deal. As these more powerful advanced centrifuges were installed, breakout time would probably have shrunk to about a few months by year 15 of the deal.

As part of the deal, Iran also agreed to enhanced international inspections and monitoring of its nuclear facilities.

What has Iran done since President Trump withdrew the U.S. from the nuclear deal in 2018?

Since the U.S. withdrew from the nuclear deal, Iran has gradually exceeded the agreement’s limits. It has increased its stockpile of 5% enriched uranium; resumed producing 20% enriched uranium; initiated production of 60% enriched uranium, resumed enrichment at Fordow; and manufactured and installed advanced centrifuges at both Natanz and Fordow.

Iran has also begun to restrict international monitoring of its nuclear facilities. In June 2022, for example, Iran announced that it was disconnecting cameras installed under the 2015 nuclear deal to monitor its nuclear facilities.

IAEA Director General Rafael Grossi reacts to Iran’s removal of monitoring cameras from its nuclear facilities.

As of May 2022, the International Atomic Energy Agency estimated that Iran had about 1,000 kilograms (2,200 pounds) of 5% enriched uranium, about 240 kilograms (530 pounds) of 20% enriched uranium and 40 kilograms (88 pounds) of 60% enriched uranium.

As a result of this growing stockpile of enriched uranium and the use of advanced centrifuges, Iran’s estimated breakout time has been reduced to a few weeks. So far, however, Iran has not decided to begin production of weapons-grade (90%) enriched uranium, even though it is technically capable of doing so.

Most likely, Iran is behaving cautiously because its leaders are concerned that producing weapons-grade uranium would trigger a strong international reaction, which could range from additional sanctions to military attack.The Conversation

About the Author:

Gary Samore, Professor of the Practice of Politics and Crown Family Director of the Crown Center for Middle East Studies, Brandeis University

This article is republished from The Conversation under a Creative Commons license. Read the original article.

 

France reenters medical marijuana industry after more than a half-century hiatus – a cannabis historian explains

By David A. Guba, Jr., Bard Early College Baltimore 

– Early in 2022, the French legislature greenlighted the cultivation of cannabis inside French territory to supply the nation’s ongoing pilot program in medical marijuana. The clinical trials were launched in March 2021 with cannabis supplied from abroad and have been overseen by the country’s food and drug office, the Agence Nationale de Sécurité du Médicament, or the National Agency for the Safety of Medicines and Health Products.

This two-year pilot program consists of 3,000 patients in France using medical cannabis, something that’s been prohibited since 1953.

While the agency has praised the pilot program for its groundbreaking efforts to produce “the first French data on the efficiency and safety” of cannabis for medical therapies to treat cancers, nerve damage and epilepsy, the trial is not the nation’s first foray into the medical cannabis industry. Far from it.

‘A drug not to be neglected’

I am a historian of cannabis and colonialism in modern France. My research has found that in the middle 19th century, Paris functioned as the epicenter of an international movement to medicalize hashish, a THC-rich intoxicant made from the pressed resin of cannabis plants.

Many pharmacists and physicians then working in France believed hashish was a dangerous and exotic intoxicant from the “Orient” – the Arab Muslim world – that could be tamed by pharmaceutical science and rendered safe and useful against the era’s most frightening diseases.

Starting in the late 1830s, some of those same pharmacists and physicians began preparing and selling hashish-infused edibles, lozenges and later tinctures – hashish-infused alcohol – and even “medicinal cigarettes” for asthma in pharmacies across the country.

Throughout the 1840s and 1850s, dozens of French pharmacists staked their careers on hashish, publishing dissertations, monographs and peer-reviewed articles on its medicinal and scientific benefits.

Hôtel de Lauzun, the meeting place for the Club des Hachichins in Paris.
Louis Édouard Fournier

French epidemiologist Louis-Rémy Aubert-Roche published a treatise in 1840 in which he argued that hashish, administered as a small edible called “dawamesk” taken with coffee, successfully cured plague in seven of 11 patients he treated in the hospitals of Alexandria and Cairo during the epidemic of 1834-35. Aubert-Roche was an anti-contagionist in the era before the germ theory – the idea that microbes can lead to disease – became scientific dogma. He, like most physicians then, believed the plague to be an untransmittable disease of the central nervous system spread to humans via “miasma,” or bad air, in unhygienic and poorly ventilated areas.

Aubert-Roche thus believed, mistaking symptom relief and luck for a cure, that hashish intoxication excited the central nervous system and counteracted the effects of the plague. “The plague,” he wrote, “is a disease of the nerves. Hashish, a substance that acts upon the nervous system, has given me the best results. I thus believe it is a drug not to be neglected.”

Reefer madness

Physician Jacques-Joseph Moreau de Tours, organizer of the infamous Club des Hachichins in Paris during the 1840s, likewise heralded dawamesk as a homeopathic wonder drug for treating mental illness. Moreau believed insanity was caused by lesions on the brain, and he also believed that hashish counteracted the effects.

Moreau reported in his 1845 work, “Du Hachisch et l’aliénation mentale” (“On Hashish and Mental Illness”), that between 1840 and 1843, he cured seven patients suffering from mental illness at Hôpital Bicêtre in central Paris with hashish. Moreau wasn’t totally off-base; today cannabis-based medicines are prescribed for depression, anxiety, post-traumatic stress disorder and bipolar disorders.

Despite the small sample size, doctors from the U.S., the U.K., Germany and Italy published favorable reviews of Moreau’s work with hashish during the late 1840s and across the 1850s. One praised it as a “discovery of much importance for the civilized world.”

Tincture wars

Though physicians in France and abroad touted dawamesk as a miracle cure, they also complained about the inability to standardize doses due to the variation in the potency of different cannabis plants. They also wrote about the challenges posed by the common adulteration of dawamesk, which was exported from North Africa and often laced with other psychoactive plant extracts.

In the early 1830s, several physicians and pharmacists in the British Empire attempted to solve these problems by dissolving hashish in alcohol to produce a tincture. By the middle of the decade, French practitioners followed suit. They developed and marketed their own hashish tinctures for French patients. One pharmacist in Paris, Edmond de Courtive, branded his concoction “Hachischine” after the infamous Muslim assassins often associated with hashish in French culture.

The popularity of hashish tincture grew rapidly in France during the late 1840s, peaking in 1848. That was when pharmacist Joseph-Bernard Gastinel and the aforementioned De Courtive engaged in a legal battle over the patent – then known as the “right to priority” – for a tincture manufactured though a particular distillation method. “L’Affaire Gastinel,” as the press termed it, or The Gastinel Affair, caused an uproar in French medical circles and occupied the pages of journals and newspapers in Paris for much of that fall.

To defend his patent, Gastinel sent two colleagues to argue his case to the Academy of Medicine in October 1848. One, a physician called Willemin, claimed that not only did Gastinel devise the tincture distillation method in question but that his tincture provided a cure for cholera, also thought to be a disease of the nerves.

Though Willemin was unable to convince the Academy of Gastinel’s right to priority, he did convince doctors in Paris to adopt hashish tincture as a treatment against cholera.

Physicians in Paris didn’t have to wait long to test Willemin’s theory. A cholera epidemic erupted in the city’s outskirts just months later. But when hashish tincture failed to cure the nearly 7,000 Parisians killed by the “blue death,” doctors increasingly lost faith in the wonder drug.

In the following decades, hashish tincture fell into disrepute as the medical theories of anti-contagionism that underpinned the drug’s use against the plague and cholera gave way to the germ theory and thus a new understanding of epidemic diseases and their treatment. During the same period, physicians in French Algeria increasingly pointed to hashish use as a key cause of insanity and criminality among indigenous Muslims, a diagnosis they termed “folie haschischique,” or hashish-induced psychosis. Heralded as a wonder drug only decades before, by the end of 19th century the drug was rebranded as an “Oriental poison”.

Lessons for today

Hemp field near Toulouse.
Olybrius, CC BY-SA

In my view, these earlier efforts to medicalize hashish in 19th-century France offer doctors, public health officials and policymakers of today several important insights as they work to return cannabis-based medications to the French market.

First, they must aim to dissociate cannabis intoxicants and medicines from colonial notions of “Oriental” otherness and Muslim violence that ironically underpinned both the rise and fall of hashish as medicine in France during the 19th century. As scholar Dorothy Roberts astutely argued in her 2015 TED Talk, “race medicine is bad medicine, poor science and a false interpretation of humanity.”

As I see it, doctors and patients should also temper their expectations of the benefits of medicinal cannabis and not overpromise and then deliver lackluster results, as happened with hashish tincture during the cholera outbreak of 1848-49.

And they should be mindful that medical knowledge unfolds historically and that staking the new career of cannabis as medicine on contested theories could hitch the drug’s success to the wrong horse, as happened with hashish after the obsolescence of anti-contagionism in the 1860s.

But if France were to engage its colonial past, reform its prohibitionist policies and continue to open up legal room for medical and recreational cannabis, I believe perhaps it could again become a global leader in this new medical marijuana movement.

This is an updated version of a piece that was published on Sept. 24, 2019.The Conversation

About the Author:

David A. Guba, Jr., Assistant Professor of History, Bard Early College Baltimore

This article is republished from The Conversation under a Creative Commons license. Read the original article.
Why isn’t EURUSD below parity … yet?

By ForexTime 

First, allow me to confess: I wasn’t expecting to write this article about EURUSD parity so soon.

When I published my Q3 outlook a couple of weeks ago, there was a 72.5% chance that EURUSD would hit 1.000 sometime this quarter.

Even with such elevated odds back then, I still thought this post-parity article wouldn’t be due for another few weeks.

But here we are.

Just as a quick reminder, the stunning decline in the world’s most popular currency pair, sinking to levels not seen in two decades, only underscores the divergence between the Eurozone and the US.

Here’s a recap from the June 30th article:

  • The US economy’s healthier outlook relative to the Eurozone’s.
    After all, there’s still the Russia-Ukraine war raging off to the latter’s eastern borders.

    UPDATE: The June US nonfarm payrolls report released last Friday (July 8th) showed a still-resilient jobs market in the world’s largest economy.


  • The Fed’s plans for more incoming rate hikes appears to be less risky than the European Central Bank’s.
    The ECB is just only getting started, with two rate hikes slated for Q3.
    But markets fear that the incoming ECB hikes could inadvertently result in a sovereign debt crisis/fragmentation risks.

    UPDATE: Following yesterday’s higher-than-expected June US CPI print of 9.1% (its highest in over 40 years, since November 1981) markets have since begun to expect a historic 100 basis point hike by the Fed at its upcoming policy decision due July 27th.


But why hasn’t EURUSD broken below parity, yet?

One word: options.

At least that’s what market chatter is pointing to.

Without getting into the weeds of the derivatives market and what “options” are, the idea is that EURUSD is being “defended” at the psychologically-important 1.0000 mark by traders who are trying their utmost best from having to pay up on financial contracts if that proverbial line in the sand is crossed.

Also, it’s tough to get a true headline figure as to how many billions worth of such options are in play at present, given the OTC (over the counter) nature of such contracts, yet they appear to have done the job so far in defending EURUSD parity over recent sessions, at least at the time of writing.

Still, such a defence can only be mounted for so long, given the fundamentally-driven selling pressures on the euro listed above.


So where to next for EURUSD?

If the 1.000 mark gives way, the next notable area of “defense” (i.e. support level) for EURUSD may arrive at 0.985, where another large chunk of options are congregated.

After that, euro bears could then send EURUSD towards the 0.950 mark.


Overall, given that there are multiple tranches of such options that may need to be defended between parity and 0.95, EURUSD may only see a grinding path towards lower levels, as opposed to the rapid declines from 1.15 to 1.000 that we’ve witnessed so far this year.


Still, EURUSD could be due for an immediate technical rebound, given that its 14-day relative strength index has gone below the 30 threshold that signals oversold conditions, .


Key event to look out for:

Beside the upcoming ECB and Fed respective July policy meetings due in the next couple of weeks, a major immediate risk for the euro pertains to the Nordstream 1 pipeline.

As noted in our Week Ahead article posted last Friday, this underwater gas pipeline from Russia to Germany is undergoing maintenance since last Monday through July 21st.

Markets fear that Russia may not restart this pipeline once maintenance has been completed.

Already, the likes of French Finance Minister Bruno Le Maire has warned of such a scenario, should Russia retaliate against sanctions, warning that the continent must prepare contingency plans (such as rationing).

Such a apocalyptic event would spark an energy crisis in Europe, and further darken its economic outlook by making a recession all but certain. That could even send EURUSD careening past 0.95!


If that happens, even a hawkish-sounding ECB later this month may not be able to significantly support the ailing bloc currency, barring direct interventions to support the currency like it did back in 2000 (when EURUSD fell to the depths of 0.823 in October 2020).


Can EURUSD stage a rebound?

From a fundamental perspective, hopes for a sustained rebound in the euro would have to be underpinned by:

  • inflation having peaked and is turning over
  • Russia-Ukraine war abating
  • recovering Eurozone economy

It’s hard imaging the above-mentioned factors materialising anytime soon.

Hence, the euro is expected to maintain a downward bias against the US dollar (with the latter benefitting from its safe haven status and its higher yields versus Eurozone bond yields).


As things stand, here’s what markets are forecasting for EURUSD:

  • 0.985 = 75% chance of that level reached sometime this quarter (Q3 2022)
  • 0.950 = 55% chance of that level reached within the next 12 months

Forex-Time-LogoArticle by ForexTime

ForexTime Ltd (FXTM) is an award winning international online forex broker regulated by CySEC 185/12 www.forextime.com

Japanese Candlesticks Analysis 14.07.2022 (XAUUSD, NZDUSD, GBPUSD)

Article By RoboForex.com

XAUUSD, “Gold vs US Dollar”

As we can see in the H4 chart, XAUUSD has formed several reversal patterns, such as Hammer, not far from the support area. At the moment, the asset may reverse in the form of a new rising impulse. In this case, the upside correctional target may be the resistance level at 1770.50. At the same time, the opposite scenario implies that the price may continue falling to reach 1710.50 without any pullbacks.

XAUUSD
Risk Warning: the result of previous trading operations do not guarantee the same results in the future

NZDUSD, “New Zealand vs US Dollar”

As we can see in the H4 chart, NZDUSD has formed a Harami reversal pattern during the pullback. At the moment, the asset may reverse in the form of another descending impulse. In this case, the downside target may be at 0.6055. After that, the asset may break the support level and continue moving downwards. However, an alternative scenario implies that the price may correct to reach 0.6165 first and then resume the descending tendency.

NZDUSD
Risk Warning: the result of previous trading operations do not guarantee the same results in the future

GBPUSD, “Great Britain Pound vs US Dollar”

As we can see in the H4 chart, GBPUSD has formed a Hammer reversal pattern near the support level. At the moment, the pair may reverse in the form of a new ascending impulse. In this case, the upside correctional target may be the resistance area at 1.1930. Later, the market may rebound from this level and resume falling. Still, there might be an alternative scenario, according to which the asset may fall to reach the support level at 1.1730 without any corrections.

GBPUSD

Article By RoboForex.com

Attention!
Forecasts presented in this section only reflect the author’s private opinion and should not be considered as guidance for trading. RoboForex LP bears no responsibility for trading results based on trading recommendations described in these analytical reviews.

Ichimoku Cloud Analysis 14.07.2022 (EURUSD, GBPUSD, NZDUSD)

Article By RoboForex.com

EURUSD, “Euro vs US Dollar”

EURUSD is testing the support level. The instrument is currently moving below Ichimoku Cloud, thus indicating a descending tendency. The markets could indicate that the price may test Tenkan-Sen, at 1.0055 and then resume moving downwards to reach 0.9765. Another signal in favour of a further downtrend will be a rebound from the descending channel’s upside border. However, the bearish scenario may no longer be valid if the price breaks the cloud’s upside border and fixes above 1.0265. In this case, the pair may continue to grow towards 1.0355.

EURUSD
Risk Warning: the result of previous trading operations do not guarantee the same results in the future

GBPUSD, “Great Britain Pound vs US Dollar”

GBPUSD is rebounding from Tenkan-Sen and Kijun-Sen. The instrument is currently moving below Ichimoku Cloud, thus indicating a descending tendency. The markets could indicate that the price may test Kijun-Sen, at 1.1865, and then resume moving downwards to reach 1.1495. Another signal in favour of a further downtrend will be a rebound from the descending channel’s upside border. However, the bearish scenario may no longer be valid if the price breaks the cloud’s upside border and fixes above 1.2145. In this case, the pair may continue to grow towards 1.2235.

GBPUSD
Risk Warning: the result of previous trading operations do not guarantee the same results in the future

NZDUSD, “New Zealand Dollar vs US Dollar”

NZDUSD continues rebounding from the resistance level. The instrument is currently moving below Ichimoku Cloud, thus indicating a descending tendency. The markets could indicate that the price may test Kijun-Sen, at 0.6125 and then resume moving downwards to reach 0.5965. Another signal in favour of a further downtrend will be a rebound from the descending channel’s upside border. However, the bearish scenario may no longer be valid if the price breaks the cloud’s upside border and fixes above 0.6260. In this case, the pair may continue to grow towards 0.6350.

NZDUSD

Article By RoboForex.com

Attention!
Forecasts presented in this section only reflect the author’s private opinion and should not be considered as guidance for trading. RoboForex LP bears no responsibility for trading results based on trading recommendations described in these analytical reviews.

The Analytical Overview of the Main Currency Pairs on 2022.07.14

By JustForex

The EUR/USD currency pair

Technical indicators of the currency pair:
  • Prev Open: 1.0037
  • Prev Close: 1.0057
  • % chg. over the last day: +0.20%

US inflation has beaten analysts’ expectations. The US consumer price index reached 9.1% year-on-year, compared to expectations of 8.8%. It is the highest rate since 1981. Last month’s gain was 1.3%. The Core Index (which excludes food and energy prices) reached 5.9%, with 5.7% expected. On a monthly basis, the Core CPI rose by 0.7%. European countries also saw an increase in consumer prices. Over the past month, inflation in Germany increased by 0.1%, in France by 0.7%, and in Spain by 1.5% to 10.2% on an annualized basis. Such data has hit confidence that the pace of slowing inflation in the future will be challenging. In his speech yesterday, FOMC spokesman Bostic said that a 100 basis point rate hike is also being considered by the Committee. There is a growing possibility that the ECB will also consider a 0.5% hike, although Fed Chair Christine Lagarde has argued several times that the first hike will be 0.25%.

Trading recommendations
  • Support levels: 1.0000
  • Resistance levels: 1.0147, 1.0221, 1.0284, 1.0365, 1.0415, 1.050

From the technical point of view, the trend on the EUR/USD currency pair on the hourly time frame is bearish. At the moment, the price is trading below the moving averages. The MACD indicator is in the negative zone, but the divergence is already observed in several timeframes. Under such market conditions, sell deals can be considered from the resistance level of 1.0147, but only after the additional confirmation. Buy trades are best to look for on intraday time frames from the support level of 1.0000, but only with confirmation and short targets.

Alternative scenario: if the price breaks out through the 1.0284 resistance level and fixes above, the uptrend will likely resume.

EUR/USD
News feed for 2022.07.14:
  • – US Initial Jobless Claims (w/w) at 15:30 (GMT+3);
  • – US Producer Price Index (m/m) at 15:30 (GMT+3);
  • – US Natural Gas Storage (w/w) at 17:30 (GMT+3);
  • – US FOMC Member Waller Speaks at 18:00 (GMT+3).

The GBP/USD currency pair

Technical indicators of the currency pair:
  • Prev Open: 1.1884
  • Prev Close: 1.1889
  • % chg. over the last day: +0.04%

UK GDP unexpectedly showed a 0.5% growth in the last month, overlapping the decrease over the previous three months. Experts had expected a decline of 0.2%. At the same time, the Industrial Production Index had grown by 0.9% (expected -0.1%), while manufacturing production had added 1.5% (expected -0.6%). Such positive sentiment gave confidence to the pound sterling.

Trading recommendations
  • Support levels: 1.1801
  • Resistance levels: 1.1887, 1.2002, 1.2065, 1.2137

From the technical point of view, the trend on the GBP/USD currency pair on the hourly time frame is bearish. The MACD indicator is in the negative zone, but there are signs of divergence. Under such market conditions, sell deals can be considered from the resistance level of 1.1887, but only after the additional confirmation. Buy trades are best to look for on intraday time frames from the support level of 1.1801, but only with confirmation and short targets.

Alternative scenario: if the price breaks out through the 1.2137 resistance level and fixes above, the uptrend will likely resume.

GBP/USD
There is no news feed for today.

The USD/JPY currency pair

Technical indicators of the currency pair:
  • Prev Open: 136.86
  • Prev Close: 137.37
  • % chg. over the last day: +0.35%

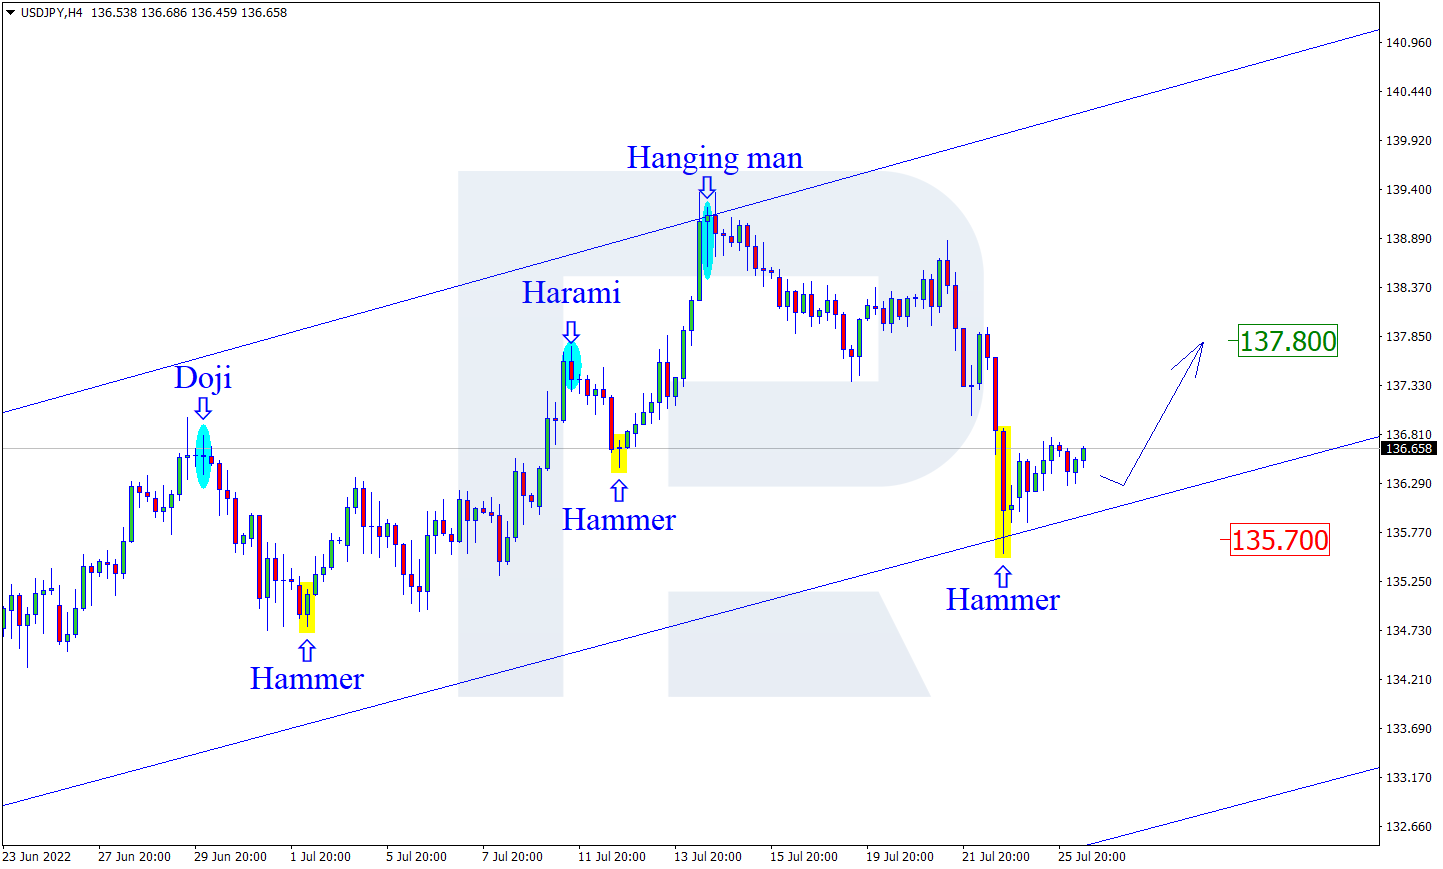
The situation on the USD/JPY currency pair remains the same. The huge gap between the interest rates and diametrically opposed monetary policy has already caused USD/JPY quotes to reach multi-year highs. There were suggestions that the Bank of Japan would be forced to intervene to strengthen the currency or adjust its control of the yield curve, but no such action has been taken. Japan’s central authorities are still pushing for a weaker currency. And the situation will not change soon, so traders should not count on a price reversal based on fundamental factors.

Trading recommendations
  • Support levels: 137.44, 137.12, 136.48, 135.92, 135.40, 134.64, 134.11
  • Resistance levels: 138.89

From the technical point of view, the medium-term trend on the USD/JPY currency pair is bullish. The MACD indicator has become positive, the buyer’s pressure has increased, and the price continues an upward trend. But there are signs of divergence. Under such market conditions, buy trades can be considered within a day from the support level of 137.44, but with confirmation. A resistance level of 138.89 is good for sell deals, but only with additional confirmation and short targets.

Alternative scenario: If the price fixes below 135.93, the downtrend will likely resume.

USD/JPY
News feed for 2022.07.14:
  • – Japan Industrial Production (m/m) at 07:30 (GMT+3).

The USD/CAD currency pair

Technical indicators of the currency pair:
  • Prev Open: 1.3019
  • Prev Close: 1.2978
  • % chg. over the last day: -0.31%

The Canadian dollar strengthened after the Bank of Canada raised its benchmark interest rate by a full percentage point, surprising markets with the most significant increase since 1998. The Bank of Canada said in a statement that inflation in Canada remains more resilient than the Bank expected in its April monetary policy report and is likely to stay around 8% for the next few months. The Bank expects Canada’s economy to grow 3.5% in 2022, 1.75% in 2023, and 2.5% in 2024. Economic activity is slowing as global growth slows and monetary policy tightens. The outlook for prices suggests that inflation will begin to decline later this year, dropping to about 3% by the end of next year and returning to the 2% target by the end of 2024.

Trading recommendations
  • Support levels: 1.2959, 1.2934, 1.2894
  • Resistance levels: 1.3001, 1.3050, 1.3113

In terms of technical analysis, the trend on the USD/CAD currency pair is bullish. But there are signs of interception of the initiative. The price is trading below the moving averages, and there is slight pressure from the sellers. Under such market conditions, it is best to look for buy trades on the lower time frames from the support level of 1.2959, but with confirmation. For sell deals, it is best to consider the resistance level of 1.3001, but it is also better with confirmation and short targets.

Alternative scenario: if the price breaks through and consolidates below the 1.2894 support level, the downtrend will likely resume.

USD/CAD
There is no news feed for today.

By JustForex


This article reflects a personal opinion and should not be interpreted as an investment advice, and/or offer, and/or a persistent request for carrying out financial transactions, and/or a guarantee, and/or a forecast of future events.

Inflation continues to skyrocket. The Bank of Canada surprised markets with an ultra-aggressive rate hike

By JustForex

Stock indices reacted to the news on US inflation data with a sharp drop. By the close of the Stock Exchange, Dow Jones Index (US30) decreased by 0.67%, while S&P 500 (US500) fell by 0.45%. The Technology Index NASDAQ (US100) lost 0.15% yesterday. At the end of the day, all three indices were down. The gap in the yield curve inversion between 2-year and 10-year bonds reached 25 points yesterday, which also is negative for the stock market and the economy.

The US inflation has significantly beaten analysts’ expectations. The US consumer price level reached 9.1% in annual terms, compared to expectations of 8.8%. It is the highest rate since 1981. Last month’s gain was 1.3%. The Core Index (which excludes food and energy prices) reached 5.9% y/y, with 5.7% expected. Monthly, the core CPI rose by 0.7%. Such data took a big hit to confidence in the pace of slowing inflation going forward. At the moment, interest rate hikes from the Fed are not giving results, but it is worth realizing that the effect of a rate hike comes with a time lag. Much of the rise in inflation was driven by gasoline prices, which rose 11.2% MoM. Electricity increased by 0.7%, and health care costs also went up by 0.7%. Meanwhile, the White House website released a statement from Joe Biden indicating that the inflation data did not reflect the full impact of the 30-day decline in gas prices, which has seen fuel prices fall by about 40 cents since mid-June. Atlanta Fed President Rafael Bostic said Wednesday that higher-than-expected inflation in June could require policymakers to consider a 100 basis point hike at the next meeting.

Investors are now worried that the Fed may revise its plans to raise rates by 100 basis points at once, as the Bank of Canada did yesterday, which also surprised traders. The Bank of Canada said in a statement that inflation in Canada remains more resilient than the Bank expected in its April monetary policy report and is likely to stay around 8% for the next few months. While global factors such as the war in Ukraine and ongoing supply disruptions have been major drivers, pressure on domestic prices due to excess demand is becoming more prominent. More than half of the components that make up the CPI have increased by more than 5%. With this expansion in price pressures, the Bank’s core inflation indicators have increased. The Bank expects the Canadian economy to grow 3.5% in 2022, 1.75% in 2023, and 2.5% in 2024. Economic activity is slowing as global growth slows and monetary policy tightens. The July forecast suggests that inflation will begin to decline later this year, dropping to about 3% by the end of next year and returning to the 2% target by the end of 2024. Global energy prices are also projected to decline.

Equity markets in Europe mostly fell yesterday. German DAX (DE30) decreased by 1.16%, French CAC 40 (FR40) fell by 0.73%, Spanish IBEX 35 (ES35) lost 0.87%, and British FTSE 100 (UK100) closed down by 0.74%.

European countries also saw an increase in consumer prices. Over the last month, the inflation rate in Germany rose by 0.1%, in France, the CPI increased by 0.7%, and in Spain, inflation jumped by 1.5% to 10.2% on an annualized basis. The European currency continues to suffer as the region faces an energy crisis caused by sanctions imposed on Russia over its invasion of Ukraine. The European Central Bank faces a dilemma: let the euro fall further, spurring already record-high inflation, or fight back by raising interest rates more quickly, adding to the damage to an economy already suffering heavily from high energy prices.

Oil prices increased for the first time in three days but remained below $100 a barrel. US government data showed the largest weekly oil inventories since the beginning of the year. Given the growth in stocks and at the expense of aggressive interest rate hikes by global banks, analysts predict a decline in oil prices in the coming months.

Asian markets were mostly up yesterday. Japan’s Nikkei 225 (JP225) added 0.54%, Hong Kong’s Hang Seng (HK50) decreased by 0.22%, and Australia’s S&P/ASX 200 (AU200) was up by 0.23% on the day.

China’s exports rose by 17.9% in June from a year earlier, beating analysts’ expectations as the economy tries to regain lost momentum due to extensive COVID blockages and supply chain problems, while imports increased by 1.0%, data showed Wednesday.

Australia’s unemployment rate fell from 3.8% to 3.5%, with the number of unemployed falling by 54.3 thousand. A strong labor market with high inflation gives the central bank room to raise interest rates more aggressively.

S&P 500 (F) (US500) 3,801.78 −17.02 (−0.45%)

Dow Jones (US30) 30,772.79 −208.54 (−0.67%)

DAX (DE40) 12,756.32 −149.16 (−1.16%)

FTSE 100 (UK100) 7,156.37 −53.49 (−0.74%)

USD Index 107.99 −0.08 (−0.08%)

Important events for today:
  • – Australia Unemployment Rate (m/m) at 04:30 (GMT+3);
  • – Japan Industrial Production (m/m) at 07:30 (GMT+3);
  • – Switzerland Producer Price Index (m/m) at 09:30 (GMT+3);
  • – US Initial Jobless Claims (w/w) at 15:30 (GMT+3);
  • – US Producer Price Index (m/m) at 15:30 (GMT+3);
  • – US Natural Gas Storage (w/w) at 17:30 (GMT+3);
  • – US FOMC Member Waller Speaks at 18:00 (GMT+3).

By JustForex


This article reflects a personal opinion and should not be interpreted as an investment advice, and/or offer, and/or a persistent request for carrying out financial transactions, and/or a guarantee, and/or a forecast of future events.