Forex Technical Analysis & Forecast 07.09.2020

Article By RoboForex.com

EURUSD, “Euro vs US Dollar”

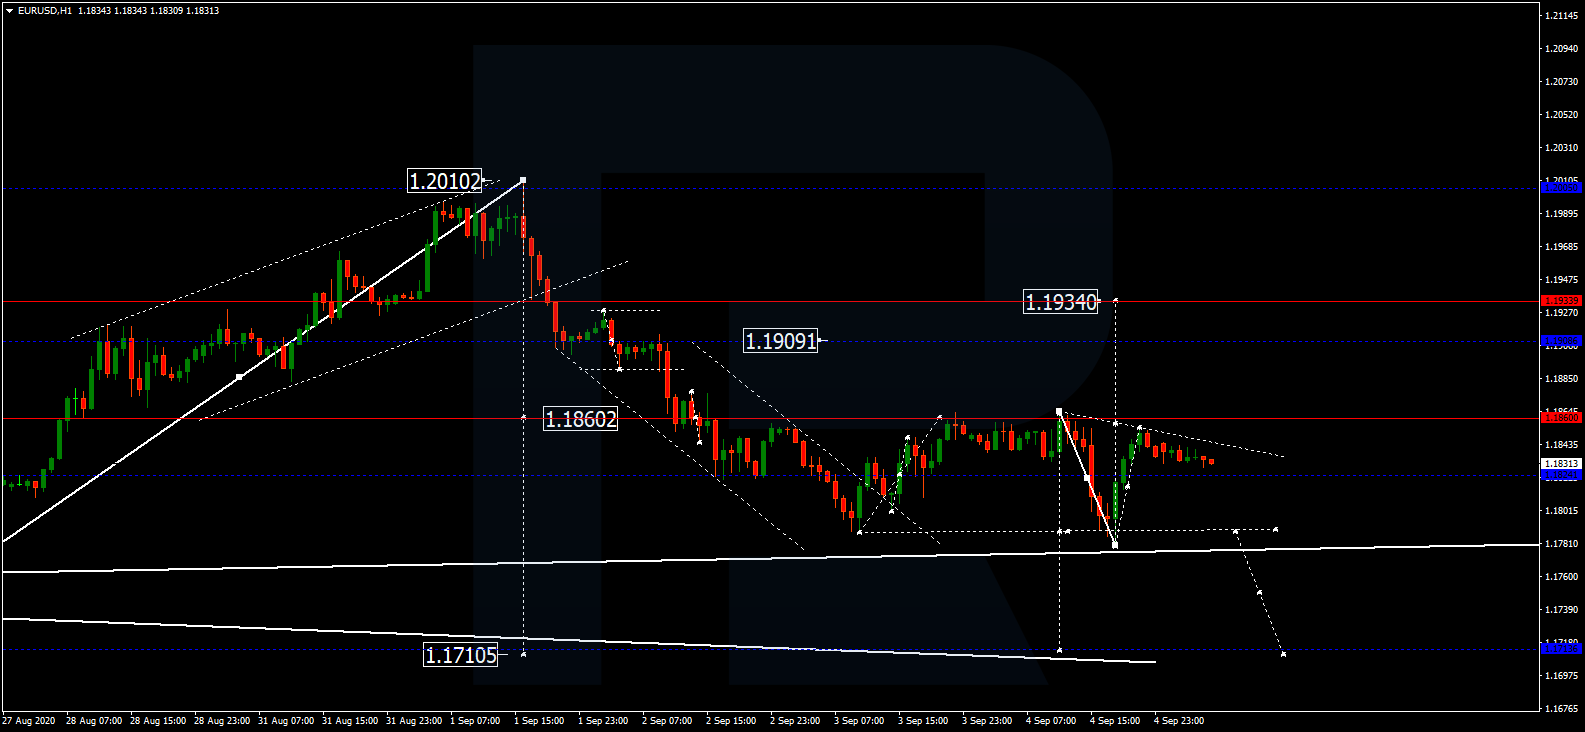
The currency pair is forming a consolidation range around 1.1825. If the price escapes the range upwards, it may correct to 1.1909. If it breaks the range downwards, the quotations may fall to 1.1710. The goal is first.

EURUSD
Risk Warning: the result of previous trading operations do not guarantee the same results in the future

GBPUSD, “Great Britain Pound vs US Dollar”

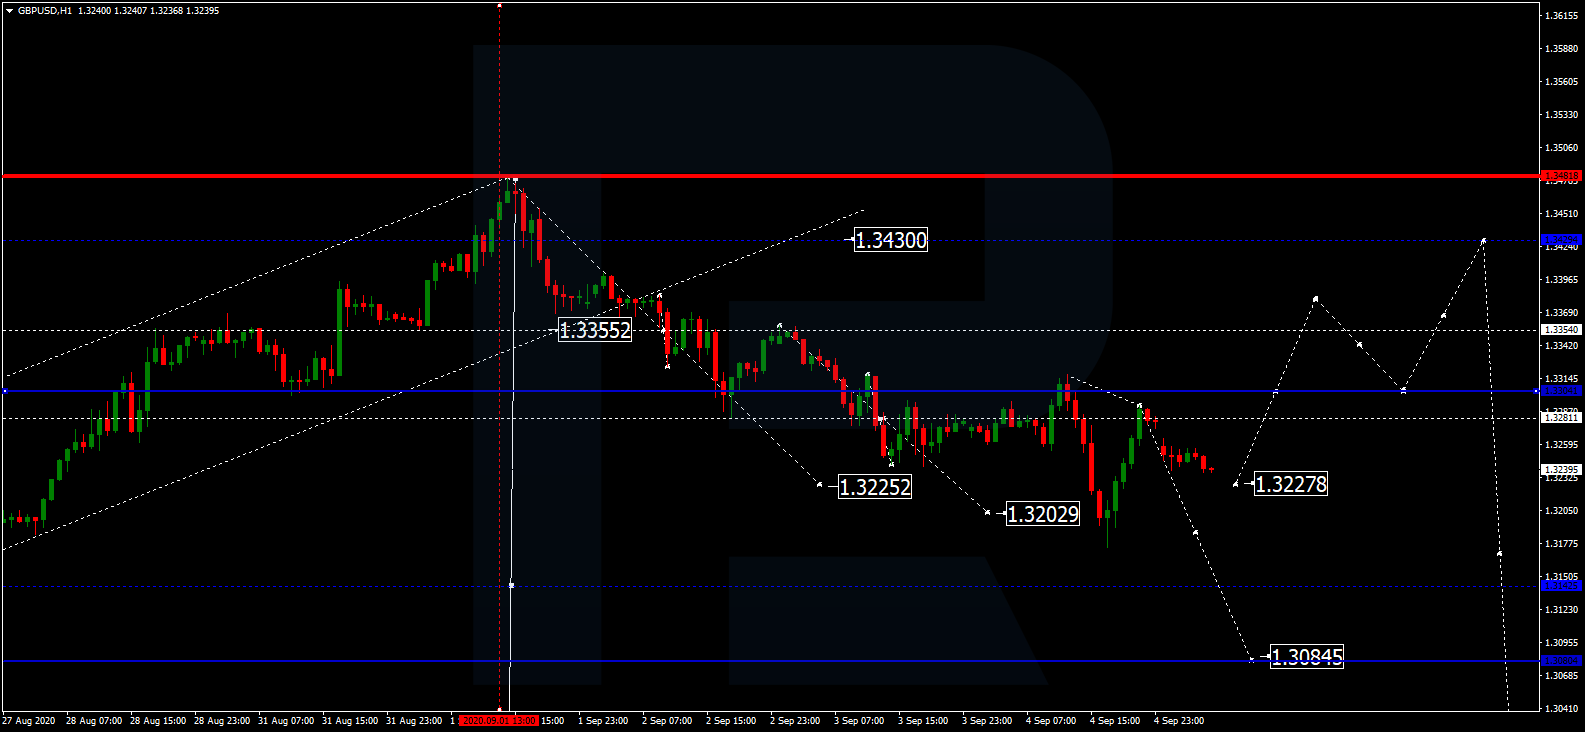
The currency pair completed a wave of declining to 1.3200. At the moment, the market corrected to 1.3282. At these levels, a consolidation range may develop. If the price escapes the range upwards, it may correct to 1.3430, testing it from below. If the price breaks the range downwards, it may go on declining by the trend to 1.3085.

GBPUSD
Risk Warning: the result of previous trading operations do not guarantee the same results in the future

USDRUB, “US Dollar vs Russian Ruble”

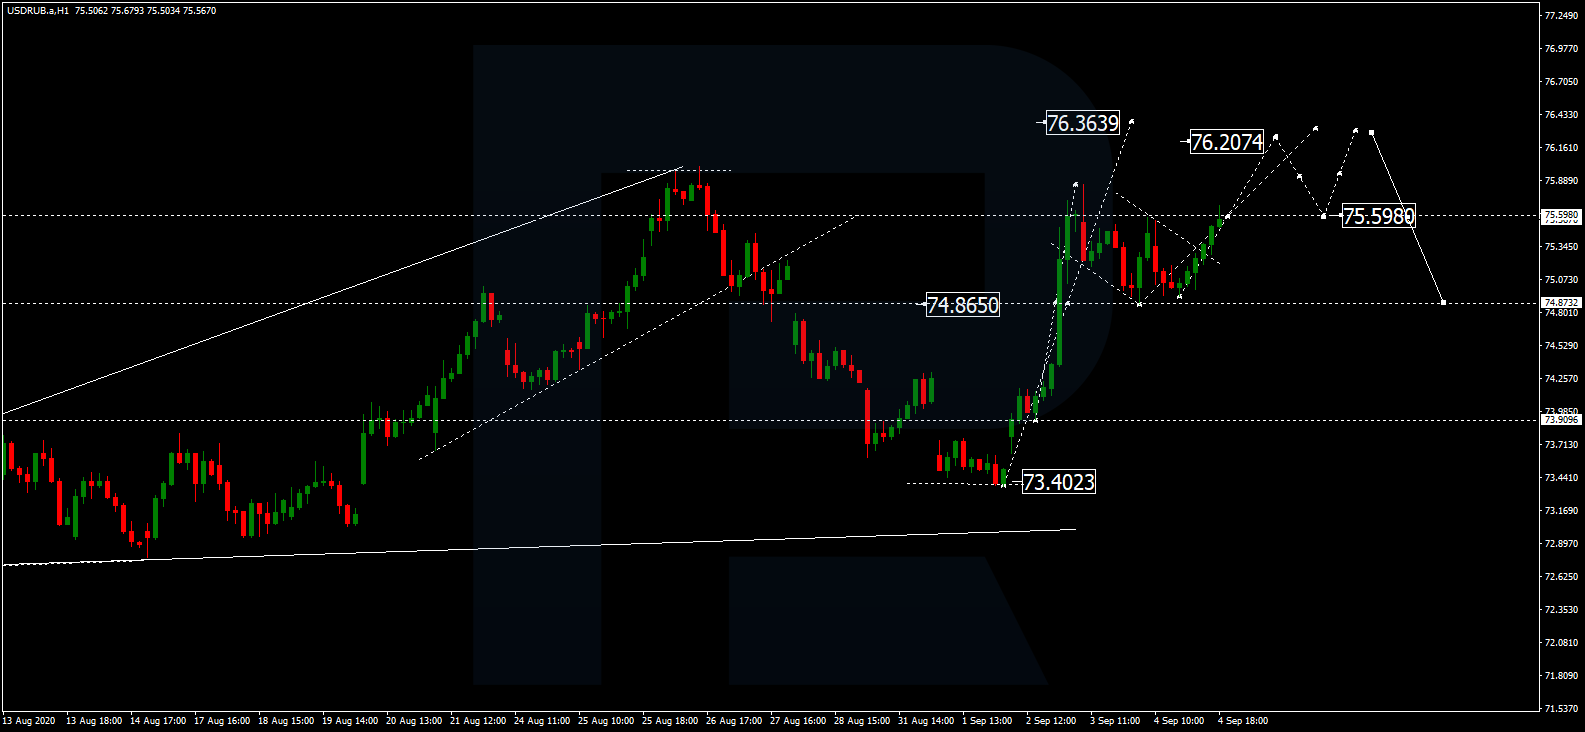
The currency pair is supported at 74.86 and is aiming to grow to 76.20. Then it is expected to decline to 75.60, and then grow to 76.36. At this level, the wave of growth is expected to be over, and a correction to 73.40 may follow.

USDRUB
Risk Warning: the result of previous trading operations do not guarantee the same results in the future

USDJPY, “US Dollar vs Japanese Yen”

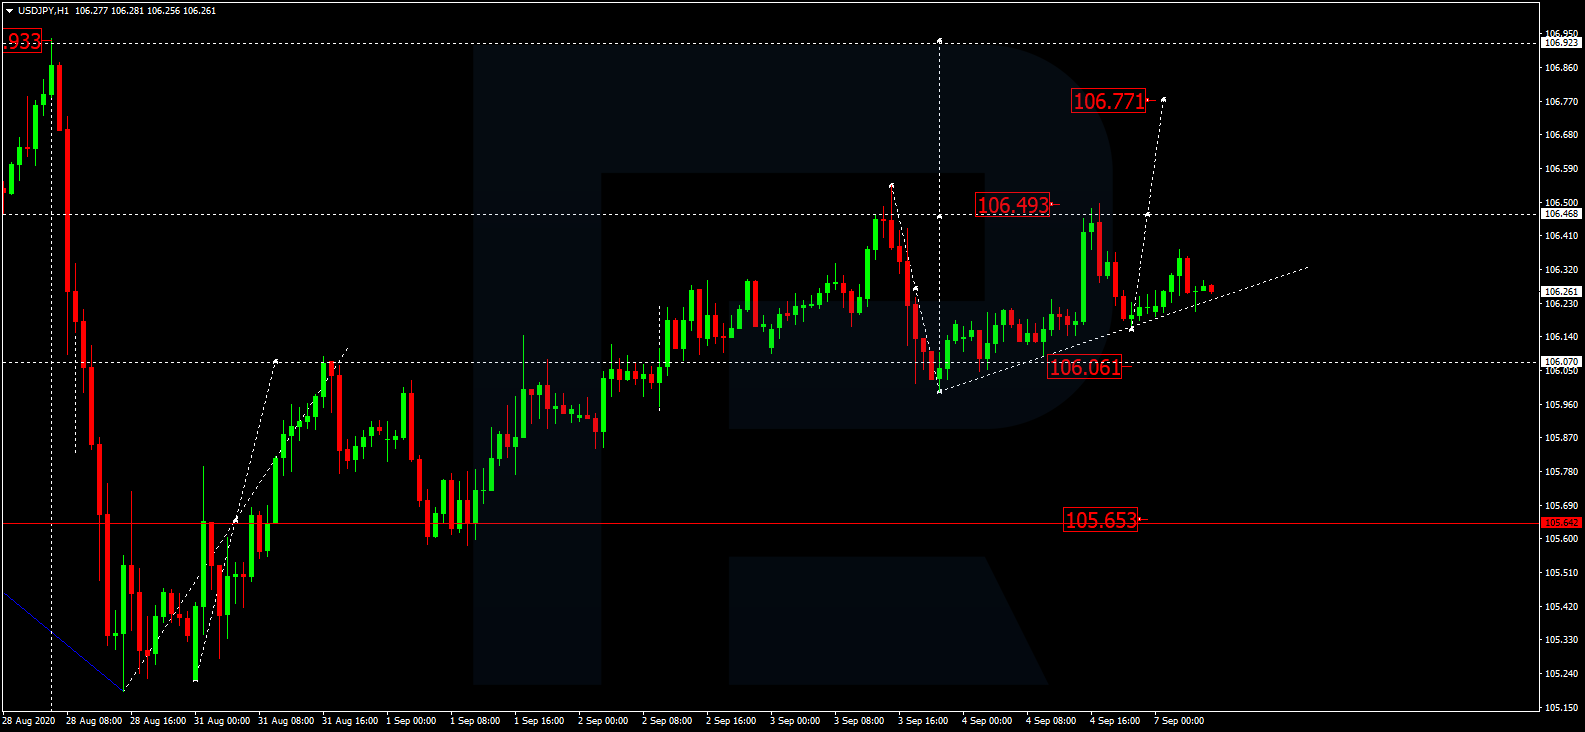
The currency pair keeps forming a consolidation range around 106.25. If the price escapes the range downwards, it may decline to 105.65. If it breaks the range upwards, it may grow to 106.77 and even 106.93 later on.

USDJPY
Risk Warning: the result of previous trading operations do not guarantee the same results in the future

USDCHF, “US Dollar vs Swiss Franc”

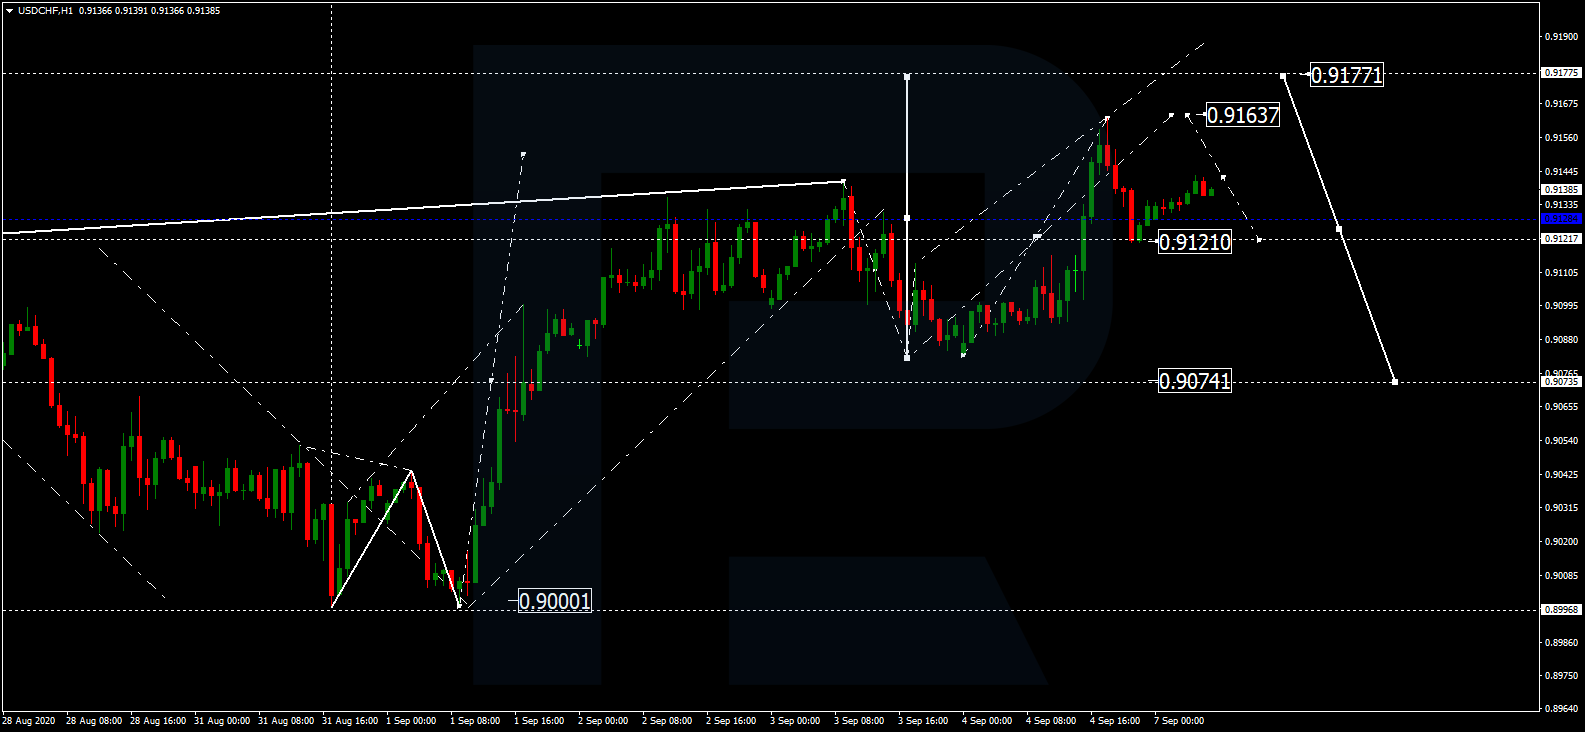
ВThe currency pair is supported at 0.9121. The range may extend to 0.9164 and even reach 0.9177. Then the price may correct to 0.9121, testing it from above, and then grow to 0.9260. The goal is first.

USDCHF
Risk Warning: the result of previous trading operations do not guarantee the same results in the future

AUDUSD, “Australian Dollar vs US Dollar”

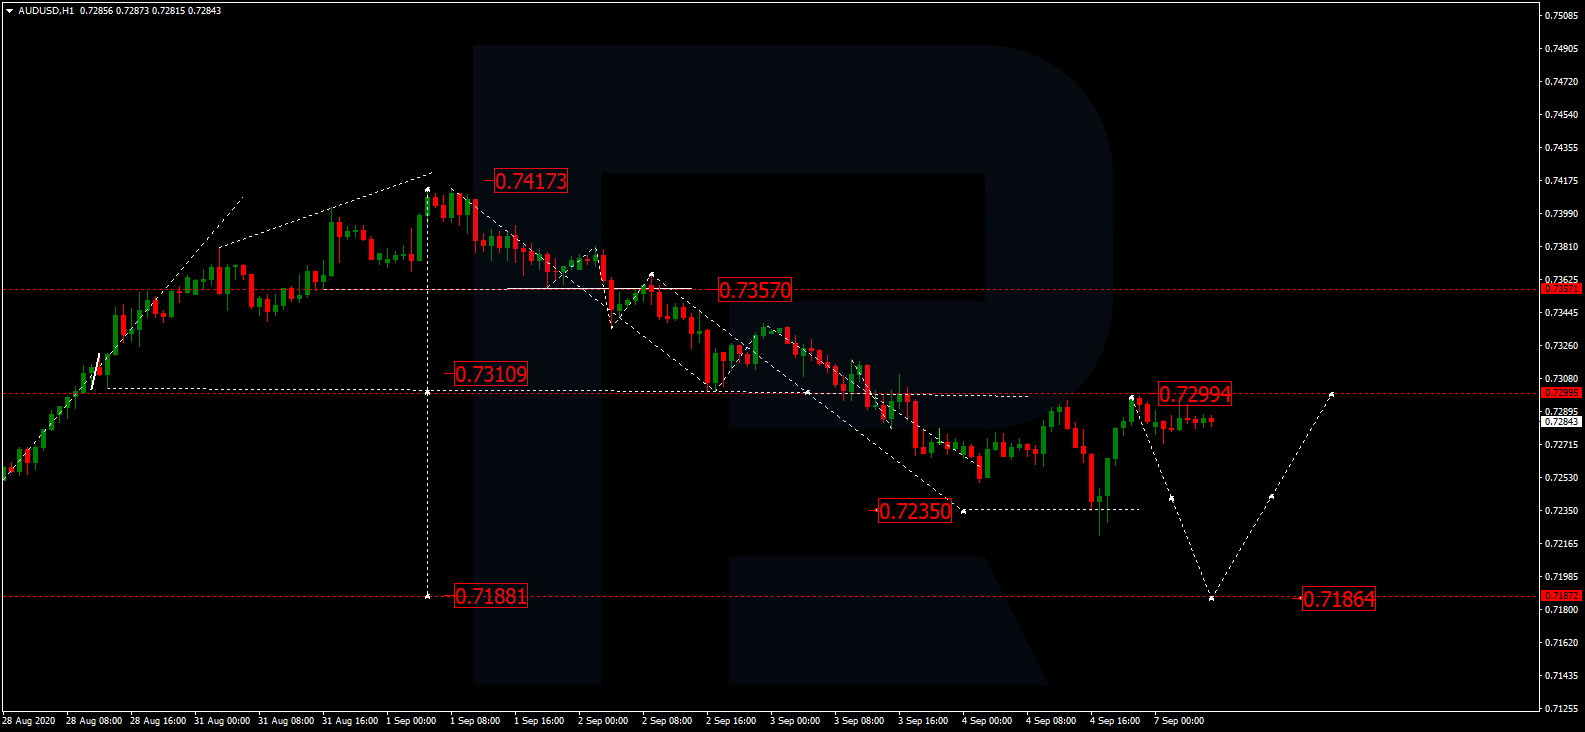
The currency pair performed a wave of declining to 0.7235 and corrected to 0.7290. At the moment, the market is trading in a narrow consolidation range under this level. Upon escaping it upwards, the price may go on correcting to 0.7357, and if it breaks the range downwards, a decline to 0.7186 might follow. The goal is first.

AUDUSD
Risk Warning: the result of previous trading operations do not guarantee the same results in the future

BRENT

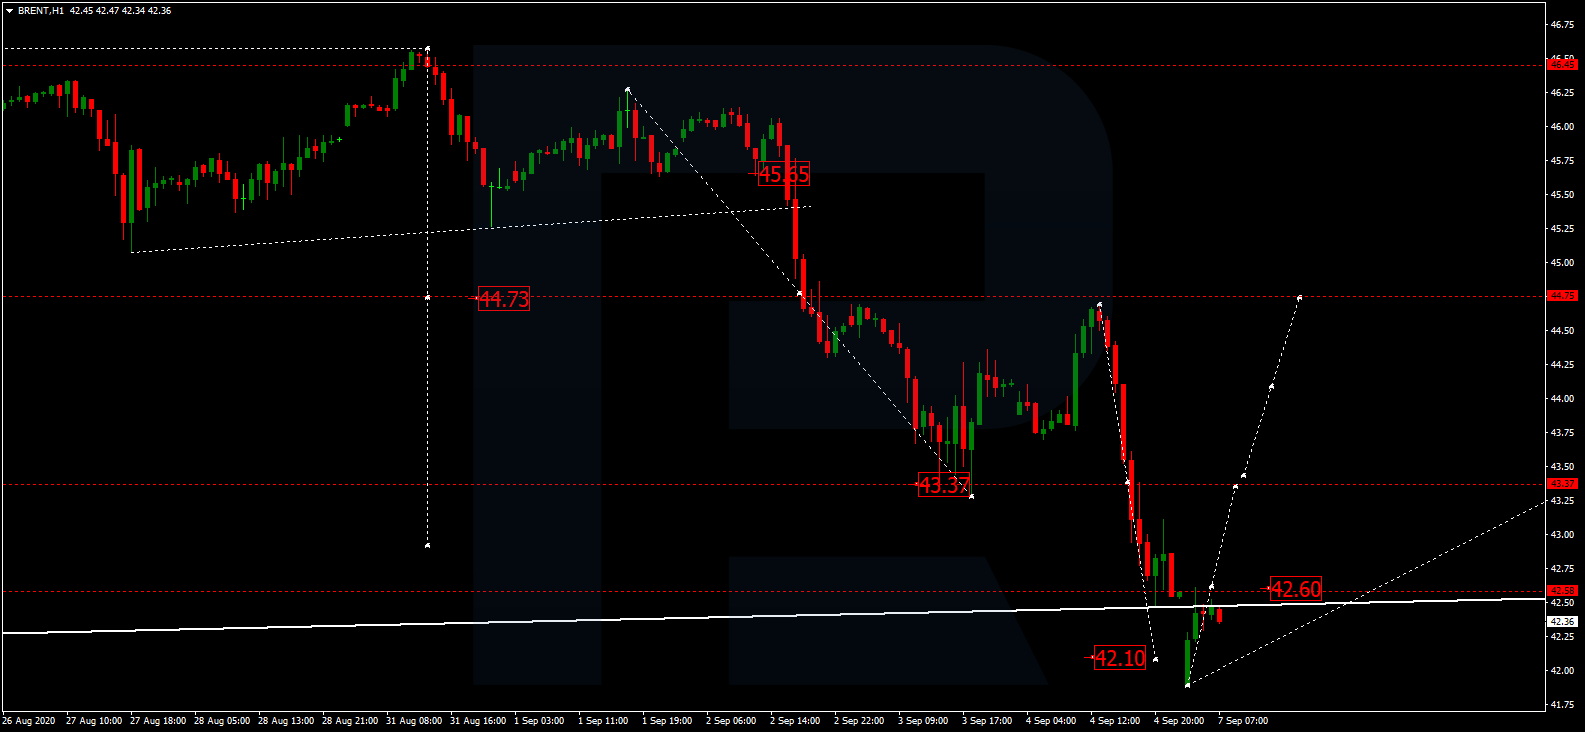
Oil bounced off 44.67 downwards and showed a wave of declining to 42.10. Today, the market is trading in a consolidation range at these lows. Growth to 43.47 might follow. Upon breaking this level upwards, the price may grow to 44.67.

BRENT
Risk Warning: the result of previous trading operations do not guarantee the same results in the future

XAUUSD, “Gold vs US Dollar”

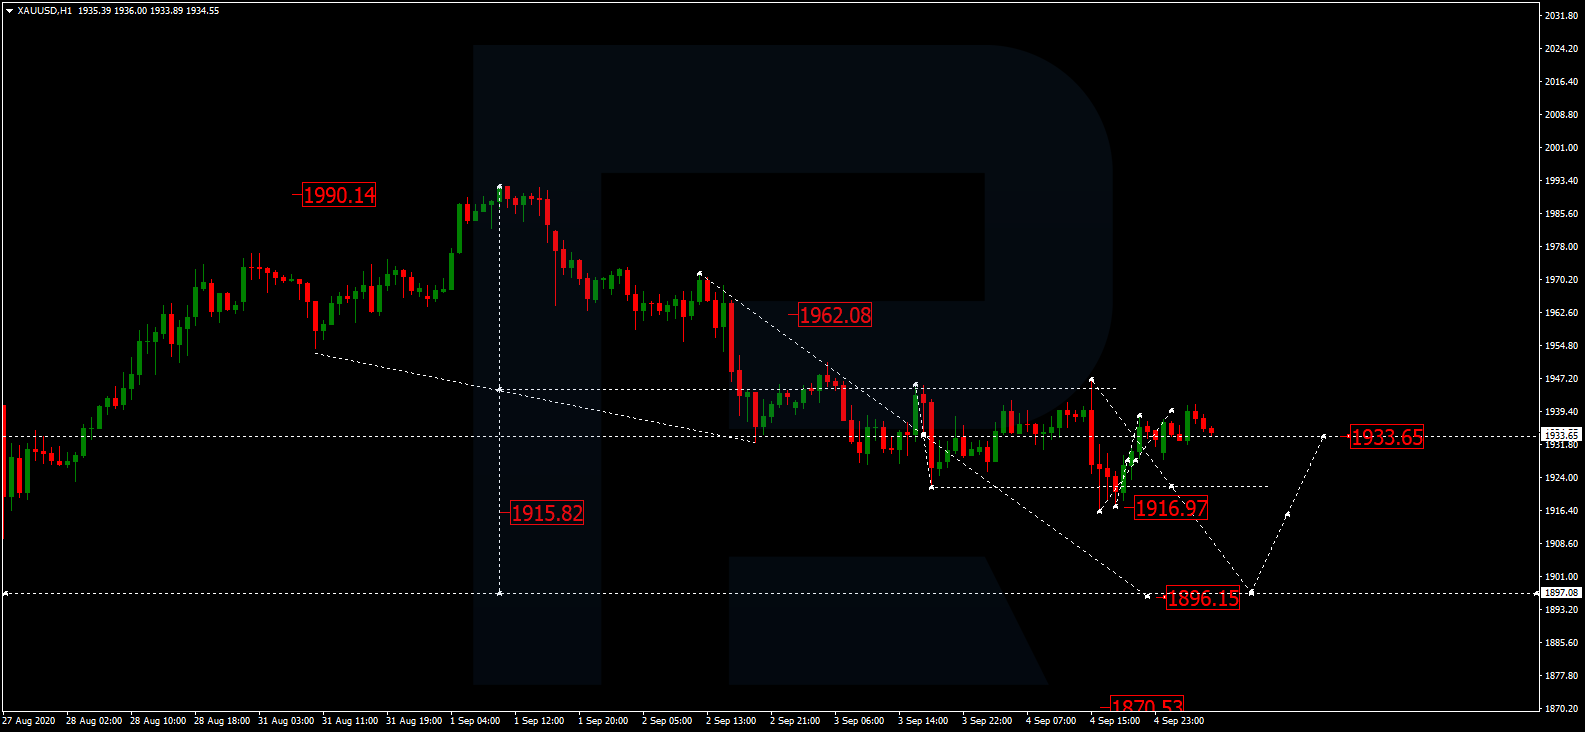
Gold keeps developing a consolidation range around 1933.77. If the price escapes the range upwards, it may correct to 1962.00. If it escapes the range downwards, the trend may continue to 1896.20 and even deeper, to 1850.00.

GOLD
Risk Warning: the result of previous trading operations do not guarantee the same results in the future

BTCUSD, “Bitcoin vs US Dollar”

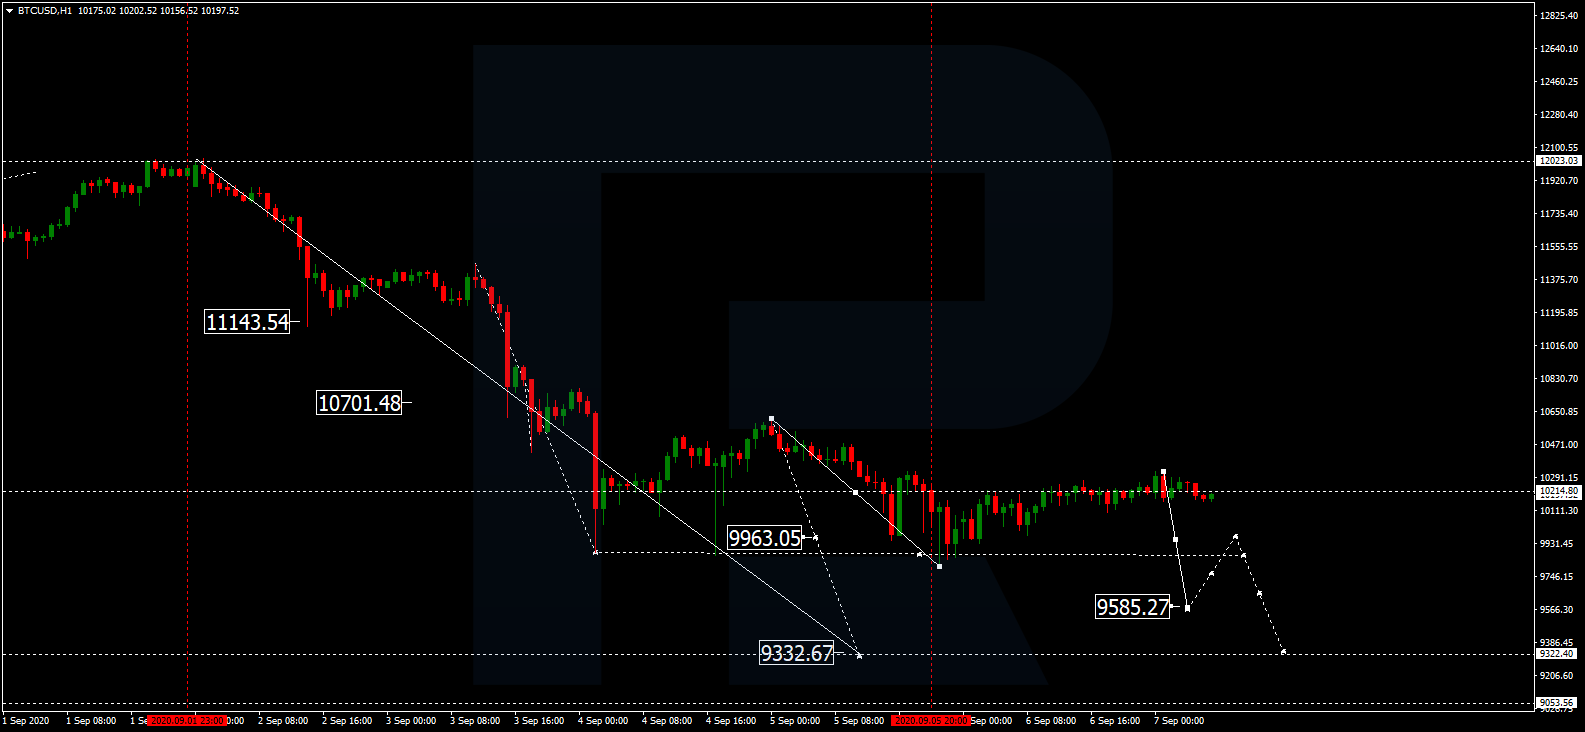
The market performed another wave of decline to 9960 and corrected to 10200. Practically, a consolidation range is forming around this level. Then the price is expected to fall to 9585, grow to 9900, testing it from below, and then decline to 9330. The goal is first.

BITCOIN
Risk Warning: the result of previous trading operations do not guarantee the same results in the future

S&P 500

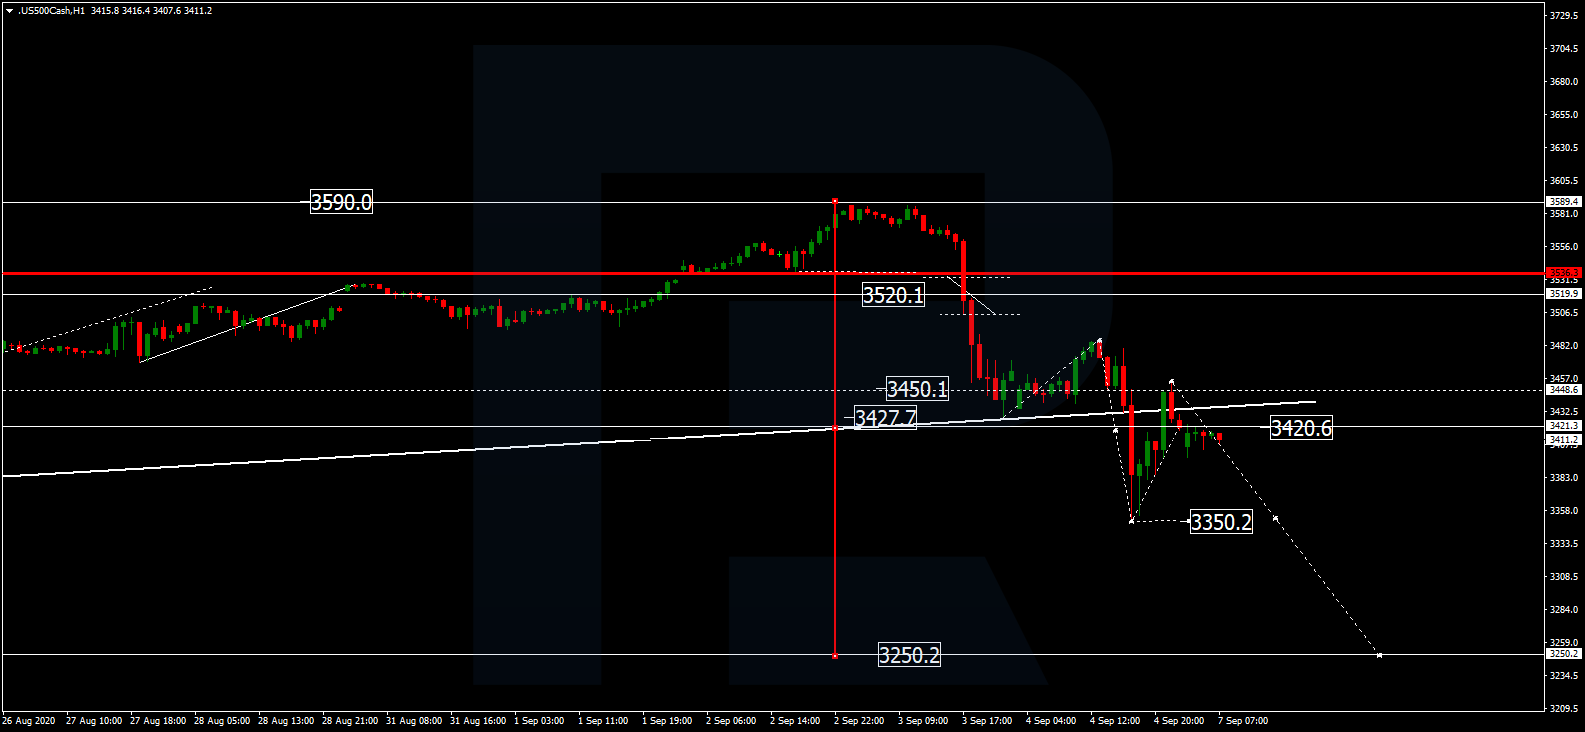
The stock index goes on developing a declining wave. The market reached the local goal at 3350.0 and corrected to 3450.1. Today, another declining wave to 3350.0 may develop, and upon breaking this level, the price may proceed to 3250.2. The goal is first.

S&P 500

Article By RoboForex.com

Attention!
Forecasts presented in this section only reflect the author’s private opinion and should not be considered as guidance for trading. RoboForex LP bears no responsibility for trading results based on trading recommendations described in these analytical reviews.

EURUSD Analysis: European economic recovery slowed down

By IFCMarkets.com

European economic recovery slowed down

Retail sales in the Eurozone fell by 1.3% monthly in July. This is much worse than both forecast of + 1.5%, and their June result of + 5.3%. Retail sales in Germany fell 0.9% month-on-month in July, while a 0.5% rise was expected. In the United States, retail sales grew by 1.2% in July. Industrial orders in Germany increased by 2.8% in July. This is worse than the forecast ( 5%) and the June figure ( 28.8%). Compared to the mid-March rate, EURUSD is now traded 11% higher. Last week, the ECB chief economist Philip Lane expressed concern about the over-strengthening of the European single currency. In theory, given the current low inflation, the ECB may go for additional monetary easing, since they believe that too strong euro reduces the efficiency of European exports. Recall that in August, the Eurozone’s consumer prices growth slowed to 0.4% in annual terms from 1.2% in July.

IndicatorVALUESignal
RSISell
MACDSell
MA(200)Neutral
FractalsNeutral
Parabolic SARSell
Bollinger BandsNeutral


Summary of technical analysis

OrderSell
Buy stopBelow 1,173
Stop lossAbove 1,203

Market Analysis provided by IFCMarkets.com

Fibonacci Retracements Analysis 07.09.2020 (GOLD, USDCHF)

Article By RoboForex.com

XAUUSD, “Gold vs US Dollar”

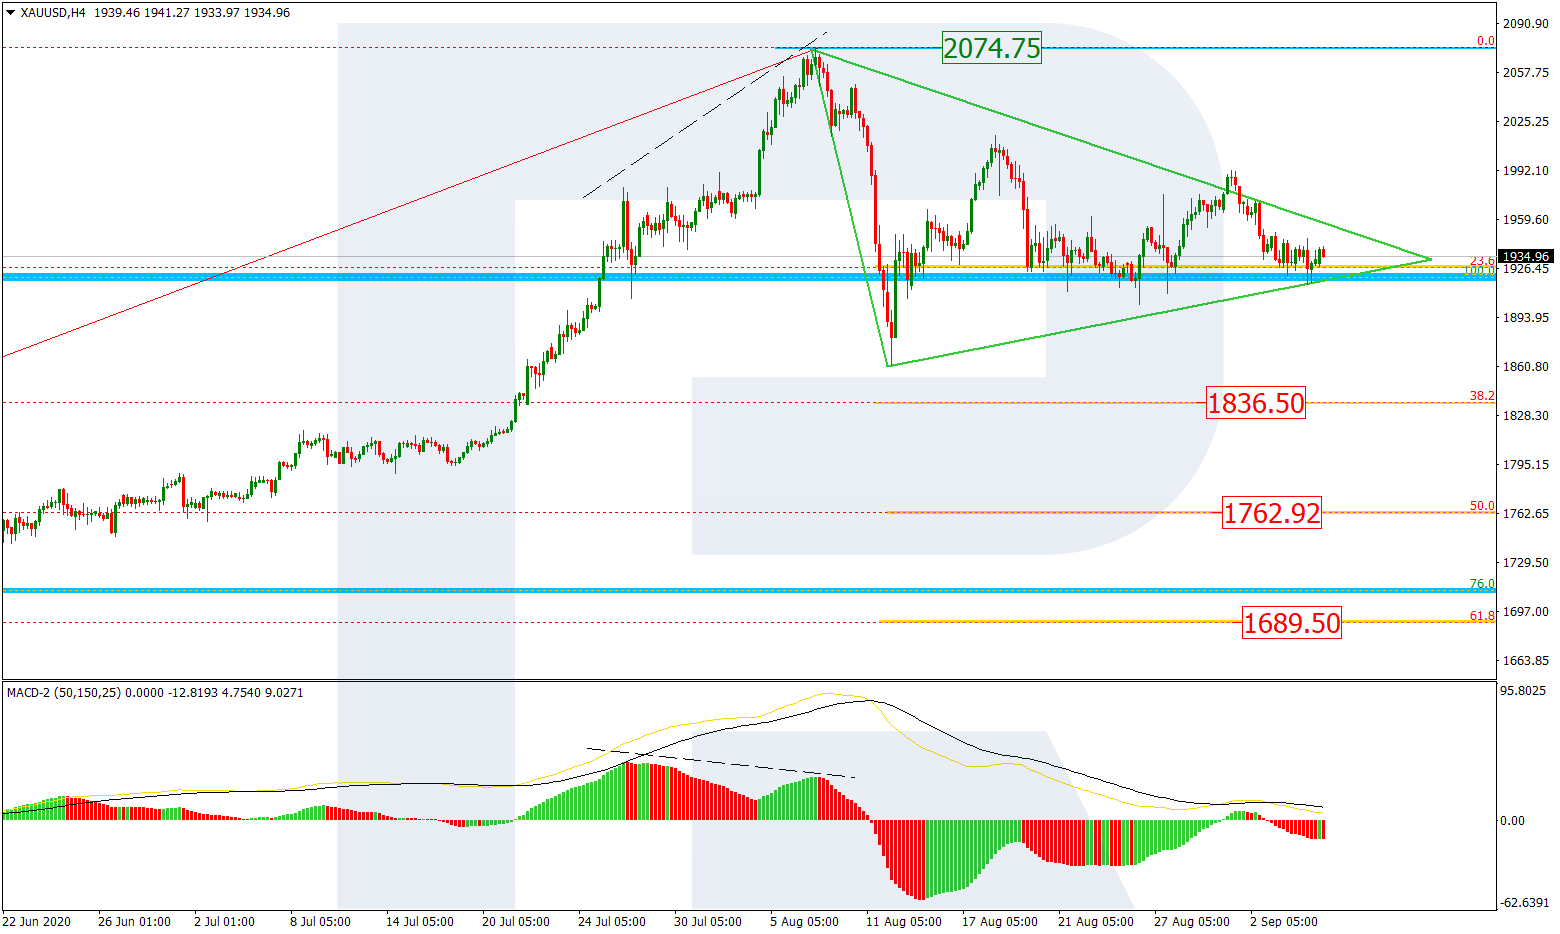
On H4, the quotations keep narrowing, forming a Triangle. This movement should be interpreted as a correction after a swift uptrend and a divergence. The Triangle is forming around 23.6% Fibo. A breakaway of the lower border of the Triangle may provoke another wave of a deeper decline, which may be aimed at 38.2% (1836.50), 50.0% (1762.92), and 61.8% (1689.50). The resistance is still at 2074.75.

GOLD_H4
Risk Warning: the result of previous trading operations do not guarantee the same results in the future

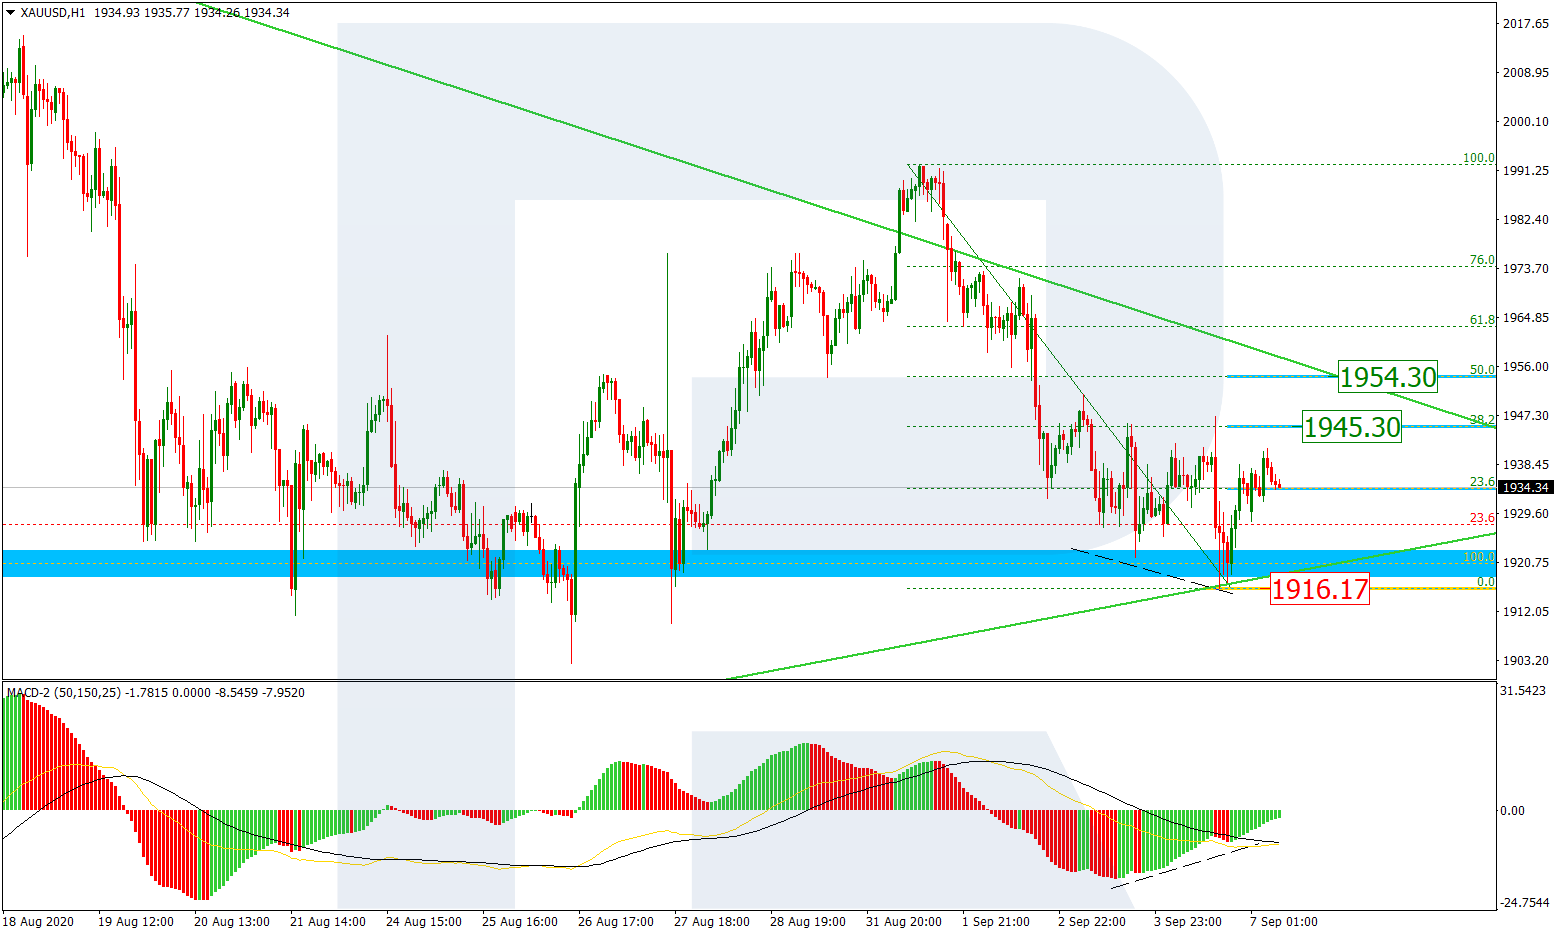
On H1, the quotations, upon declining to the lower border of the pattern, formed a convergence and performed a correctional bounce. By now, the quotations have risen to 23.6% Fibo, and then the growth may continue to 38.2% (1945.30) and 50.0% (1954.30). Breaking away the low of 1916.17, the quotations may form a downtrend.

GOLD_H1
Risk Warning: the result of previous trading operations do not guarantee the same results in the future

USDCHF, “US Dollar vs Swiss Franc”

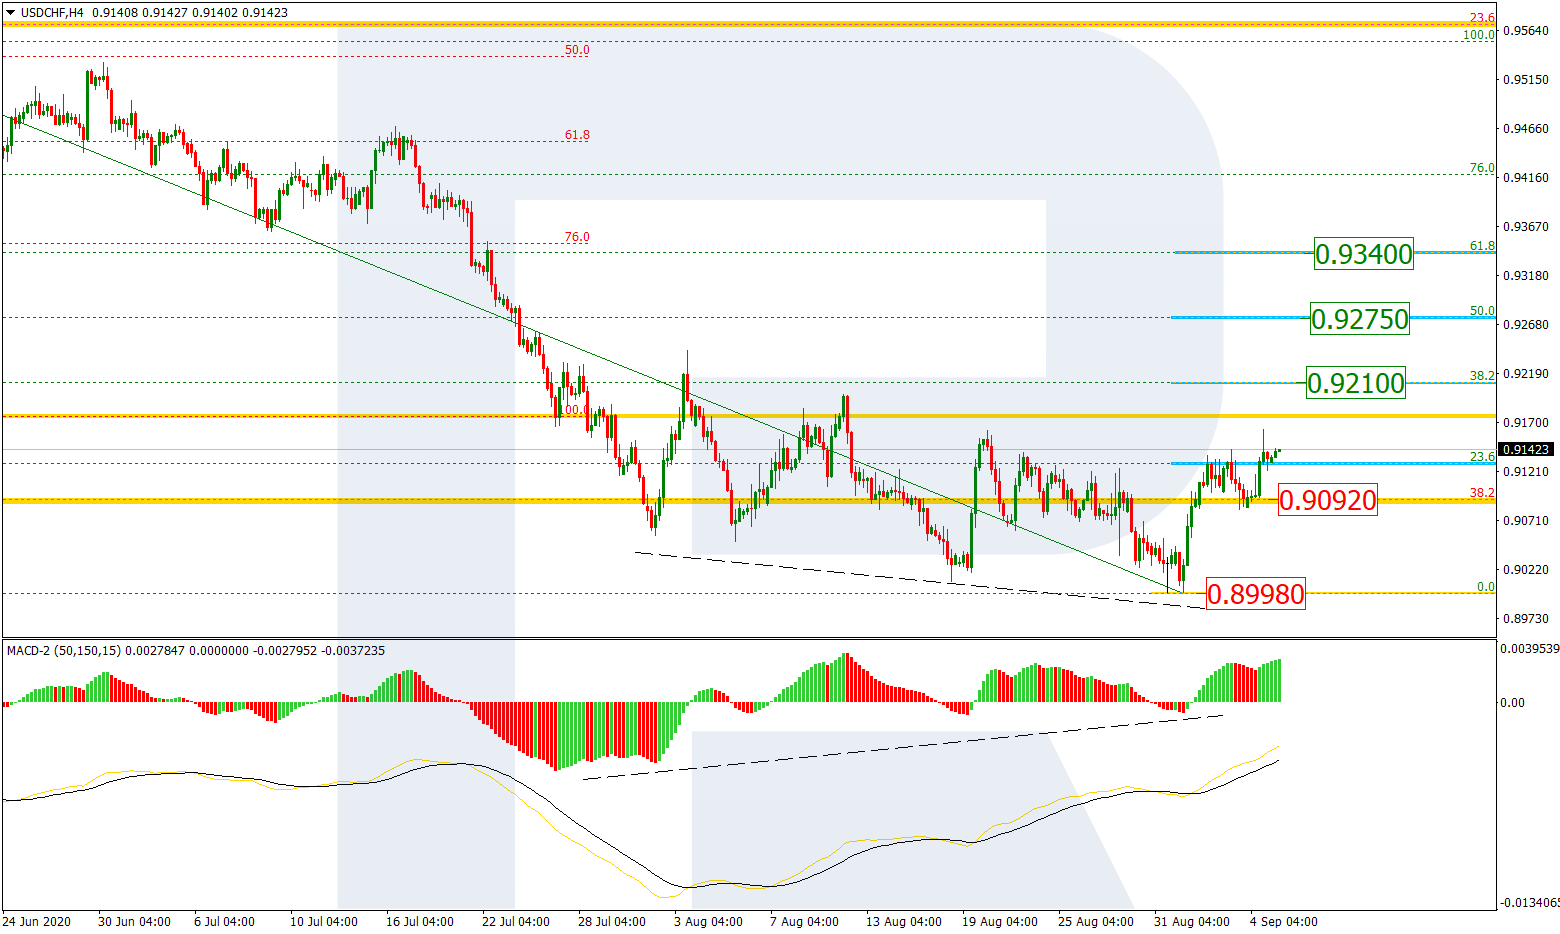
On H4, upon declining to the long-term level of 38.2% Fibo and a convergence, the market is beginning to grow, correcting the last wave of decline. By now, the quotations have risen to 23.6%,and later on may proceed to 38.2% (0.9210), 50.0% (0.9275), and 61.8% (0.9340). After the pullback, the downtrend will be aiming at breaking away the support line at 0.8998, and may head for the long-term level of 50.0% (0.8706).

USDCHF_H4
Risk Warning: the result of previous trading operations do not guarantee the same results in the future

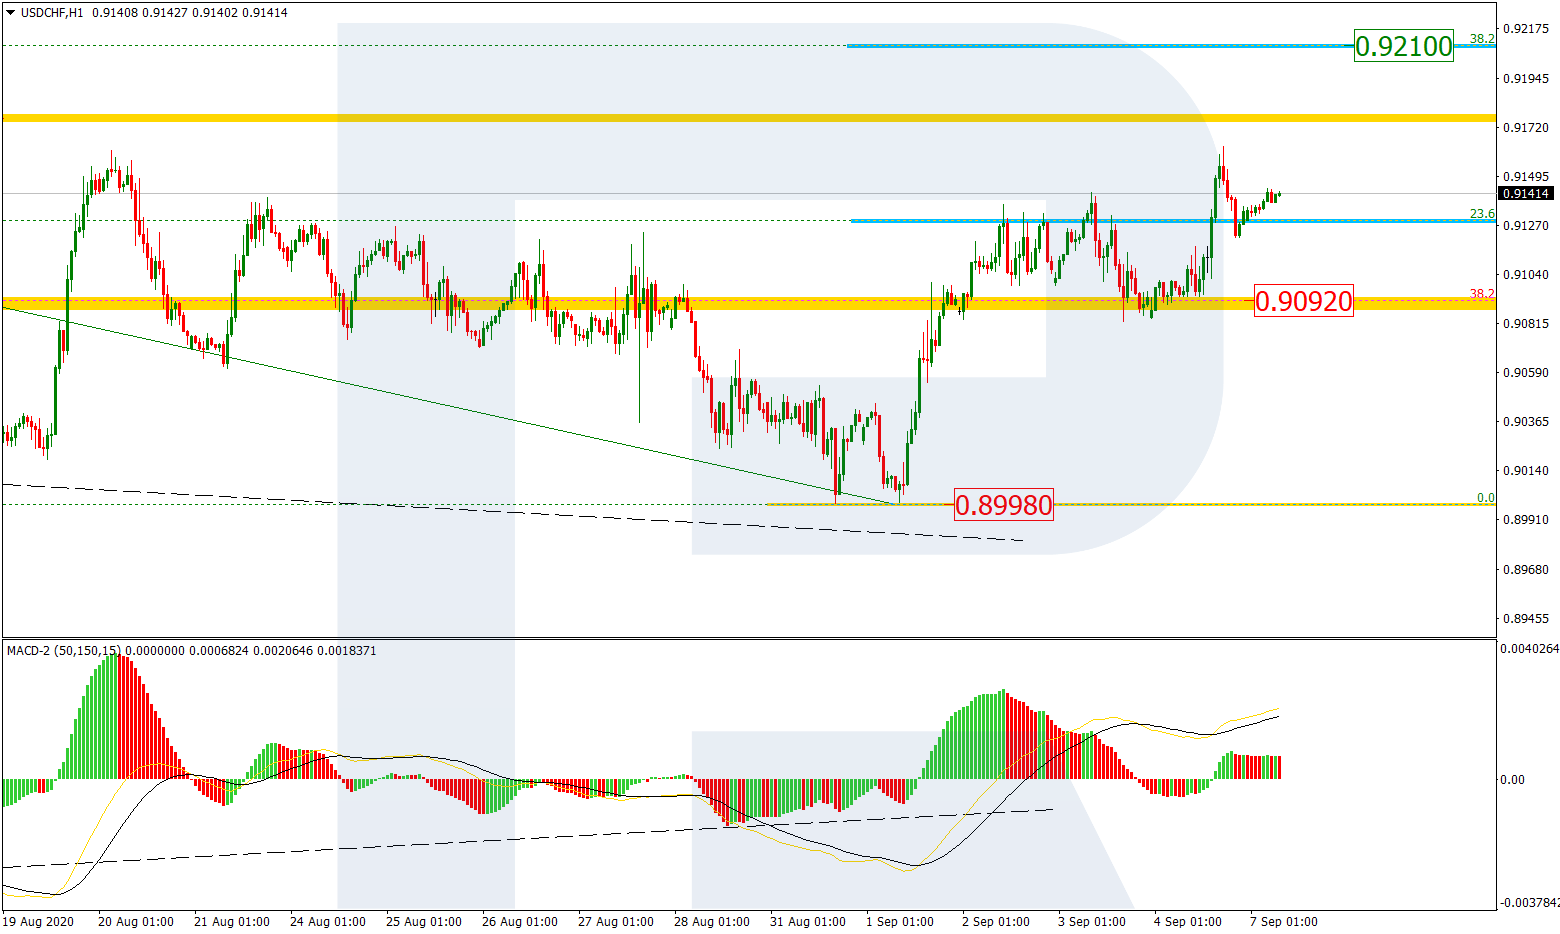
On H1, the market is developing a correctional uptrend. Breaking away the last high, the quotations are pulling back to 23.6%, the next aim of the growth being 38.2% (0.9210).

USDCHF_H1

Article By RoboForex.com

Attention!
Forecasts presented in this section only reflect the author’s private opinion and should not be considered as guidance for trading. RoboForex LP bears no responsibility for trading results based on trading recommendations described in these analytical reviews.

The Analytical Overview of the Main Currency Pairs on 2020.09.07

by JustForex

The EUR/USD currency pair

Technical indicators of the currency pair:
  • Prev Open: 1.18483
  • Open: 1.18453
  • % chg. over the last day: -0.02
  • Day’s range: 1.18246 – 1.18462
  • 52 wk range: 1.0637 – 1.2012

The EUR/USD currency pair continues to consolidate. The technical pattern is ambiguous. Financial market participants assess the US labor market report for August, which turned out to be quite optimistic. In the country’s nonfarm sector, 1.371K new jobs were created, which is slightly below market expectations at 1.400K. At the same time, the growth of average hourly earnings accelerated from 0.1% (MoM) to 0.4% (MoM). The unemployment rate fell to 8.4% from 10.2%. Investors expect the ECB meeting later this week. At the moment, EUR/USD quotes are consolidating in the range of 1.1820-1.1860. Positions should be opened from these marks.

Today, the news feed is calm. US financial markets are closed due to the holiday.

EUR/USD

Indicators do not give accurate signals: the price has crossed the 50 MA.

The MACD histogram is near the 0 mark.

Stochastic Oscillator is in the neutral zone, the %K line has crossed the %D line. There are no signals at the moment.

Trading recommendations
  • Support levels: 1.1820, 1.1785, 1.1765
  • Resistance levels: 1.1860, 1.1890, 1.1925

If the price fixes below 1.1820, further correction of EUR/USD quotes is expected. The movement is tending to 1.1780-1.1750.

An alternative could be the growth of the EUR/USD currency pair to 1.1900-1.1930.

The GBP/USD currency pair

Technical indicators of the currency pair:
  • Prev Open: 1.32640
  • Open: 1.32438
  • % chg. over the last day: -0.27
  • Day’s range: 1.31978 – 1.32638
  • 52 wk range: 1.1409 – 1.3516

The bearish sentiment prevails on the GBP/USD currency pair. The British pound has set new local lows. At the moment, the trading instrument is consolidating in the range of 1.3200-1.3260. The technical pattern signals a further decline in GBP/USD quotes. Brexit talks between UK and EU officials should resume in London on Tuesday. We recommend following up-to-date information on this issue. Positions should be opened from key levels.

The publication of important UK economic reports is not planned.

GBP/USD

Indicators signal the power of sellers: the price has fixed below 50 MA and 100 MA.

The MACD histogram is in the negative zone, which gives a signal to sell GBP/USD.

Stochastic Oscillator has started exiting the oversold zone, the %K line is above the %D line, which indicates the bullish sentiment.

Trading recommendations
  • Support levels: 1.3200, 1.3155, 1.3085
  • Resistance levels: 1.3260, 1.3310, 1.3355

If the price fixes below 1.3200, further correction of GBP/USD quotes is expected. The movement is tending to 1.3150-1.3120.

An alternative could be the growth of the GBP/USD currency pair to 1.3310-1.3350.

The USD/CAD currency pair

Technical indicators of the currency pair:
  • Prev Open: 1.31226
  • Open: 1.30464
  • % chg. over the last day: -0.50
  • Day’s range: 1.30450 – 1.31120
  • 52 wk range: 1.2949 – 1.4669

There is an ambiguous technical pattern on the USD/CAD currency pair. The trading instrument is consolidating. At the moment, the local support and resistance levels are 1.3080 and 1.3120, respectively. Investors assess reports on the US and Canada’s labor markets. We recommend paying attention to the dynamics of “black gold” prices. Positions should be opened from key levels.

Today, the news feed on Canada’s economy is calm.

USD/CAD

Indicators do not give accurate signals: the price has crossed the 50 MA and 100 MA.

The MACD histogram is near the 0 mark. There are no signals at the moment.

Stochastic Oscillator is in the overbought zone, the %K line has crossed the %D line. There are no signals at the moment.

Trading recommendations
  • Support levels: 1.3080, 1.3045, 1.2995
  • Resistance levels: 1.3120, 1.3160, 1.3200

If the price fixes above 1.3120, USD/CAD quotes are expected to grow. The movement is tending to 1.3160-1.3180.

An alternative could be a decline in the USD/CAD currency pair to 1.3045-1.3020.

The USD/JPY currency pair

Technical indicators of the currency pair:
  • Prev Open: 106.161
  • Open: 106.217
  • % chg. over the last day: +0.02
  • Day’s range: 106.132 – 106.384
  • 52 wk range: 101.19 – 112.41

The USD/JPY currency pair continues to consolidate. The technical pattern is ambiguous. At the moment, the local support and resistance levels are 106.00 and 106.35, respectively. Investors expect additional drivers. We recommend paying attention to the dynamics of US government bonds yield. Positions should be opened from key levels.

The news feed on Japan’s economy is calm.

USD/JPY

Indicators do not give accurate signals: the price has crossed the 50 MA and 100 MA.

The MACD histogram is near the 0 mark.

Stochastic Oscillator is in the neutral zone, the %K line is below the %D line, which indicates the bearish sentiment.

Trading recommendations
  • Support levels: 106.00, 105.80, 105.60
  • Resistance levels: 106.35, 106.55, 106.90

If the price fixes above 106.35, USD/JPY quotes are expected to grow. The movement is tending to 106.65-106.90.

An alternative could be a decline in the USD/JPY currency pair to 105.70-105.50.

by JustForex


This article reflects a personal opinion and should not be interpreted as an investment advice, and/or offer, and/or a persistent request for carrying out financial transactions, and/or a guarantee, and/or a forecast of future events.

Currency Majors Are Consolidating. Investors Assess the US Labor Market Report

by JustForex

The greenback demand has been recovered partially after the publication of quite optimistic data on the US labor market for August. Thus, the number of people employed in the nonfarm sector of the country counted to 1.371K, which is slightly below market expectations at 1.400K. At the same time, the unemployment rate fell to 8.4% instead of 9.8%. The growth in average hourly earnings accelerated from 0.1% (MoM) to 0.4% (MoM). At the same time, the US currency is still under pressure due to the statements by Fed Chairman Jerome Powell that the regulator plans to keep US rates at a lower level for an extended period. Currently, currency majors are consolidating.

Today, it became known that the UK government plans to issue a new law that will cancel key parts of the agreement on the country’s exit from the EU. This could lead to the fact that the conclusion of a new trade deal until the end of the agreement in December may be in question. Meanwhile, Brexit talks between UK and EU officials should continue tomorrow.

The “black gold” prices are consolidating after a sharp fall at the end of last week. At the moment, futures for the WTI crude oil are testing the $39.15 mark per barrel.

Market indicators

On Friday, there was the bearish sentiment in the US stock market: #SPY (-0.82%), #DIA (-0.55%), #QQQ (-1.33%).

On Friday, the 10-year US government bonds yield rose significantly. The figure reached 0.72-0.73%.

The news feed for 2020.09.07:

No important news is expected today. Please note that volatility may be reduced due to Labor Day celebrations in Canada and the US.

by JustForex


This article reflects a personal opinion and should not be interpreted as an investment advice, and/or offer, and/or a persistent request for carrying out financial transactions, and/or a guarantee, and/or a forecast of future events.

Are stocks heading for a further correction?

By Hussein Sayed, Chief Market Strategist (Gulf & MENA), ForexTime

Global equity markets are showing some signs of stabilisation following two brutal days late last week which dragged the S&P 500 and the tech-heavy Nasdaq 100 down by 4.3% and 6.4%, respectively. There was no specific trigger to the selloff but after extreme bullishness driven by monetary and fiscal policies, stock prices reached levels that could no longer be justified by fundamentals.

There is no doubt that the investment environment has drastically changed compared to a few years ago. Given the new approach of the Federal Reserve towards ’average inflation targeting’, investors are not concerned about tightening monetary policy, at least for the next couple of years. Theoretically, this means businesses will enjoy cheap debt financing in order to expand, leading to higher potential future earnings.

It’s true that valuing a company at a lower required rate of return provides a higher intrinsic value for the stock price, but what we have seen over the past several weeks was more euphoric and about momentum buying rather than rational investment. Fears of missing out on the rally also led many investors to jump into the market without doing proper analysis. While we still cannot compare the current environment to that of 1999-2000, investors need to be concerned about the price they pay to acquire stocks.

The steep correction seen on Thursday and Friday is healthy and much needed after the five-month rally, but it requires a more extended pullback to encourage long term investors to build positions. We probably need another 10 – 15% drop to end this euphoria and this will only happen if investors put more focus on current fundamentals that have been ignored for several months.  Let us not forget that we have not yet found a cure for the virus and corporate bankruptcies will be on the rise as we approach year-end. Liquidity and low interest rates alone cannot be the solution to everything, so it’s essential to see continued improvement in economic data and an end to the pandemic for sustainable upside in risk assets.

Disclaimer: The content in this article comprises personal opinions and should not be construed as containing personal and/or other investment advice and/or an offer of and/or solicitation for any transactions in financial instruments and/or a guarantee and/or prediction of future performance. ForexTime (FXTM), its affiliates, agents, directors, officers or employees do not guarantee the accuracy, validity, timeliness or completeness, of any information or data made available and assume no liability as to any loss arising from any investment based on the same.


Forex-Time-LogoArticle by ForexTime

ForexTime Ltd (FXTM) is an award winning international online forex broker regulated by CySEC 185/12 www.forextime.com

DAX30 facing selling pressure with US Equities – 13,000 in focus again

By Admiral Markets

Economic events

Source: Economic Events September 07, 2020 – Admiral Markets’ Forex Calendar

The DAX30 took a serious hit last week on Thursday with the Nasdaq100 seeing its biggest drop since March this year and the S&P500 seeing its third biggest decline, after making a new All Time High, by dropping 3.5% (the other two occasions were in November 1991 with a 3.9% drop and September 1955 with a 6.6% drop).

Most likely, the slow start into the new week, which is to be expected, due to the “Labour Day” bank holiday in the US (for changed trading hours please click here) is the “calm before the storm”.

After breaking above the July highs around 13,300 points everything was pointing to a direct run towards 13,800 points.

But, here is what transpired:

  • An “overdue” correction in US equities
  • This included Apple, with its market cap dropping by around 179 billion USD in only one day and, thus, more than the market cap of 491 companies in the S&P500
  • The German index followed its bigger brother and dropped back towards the region around 13,000 points.

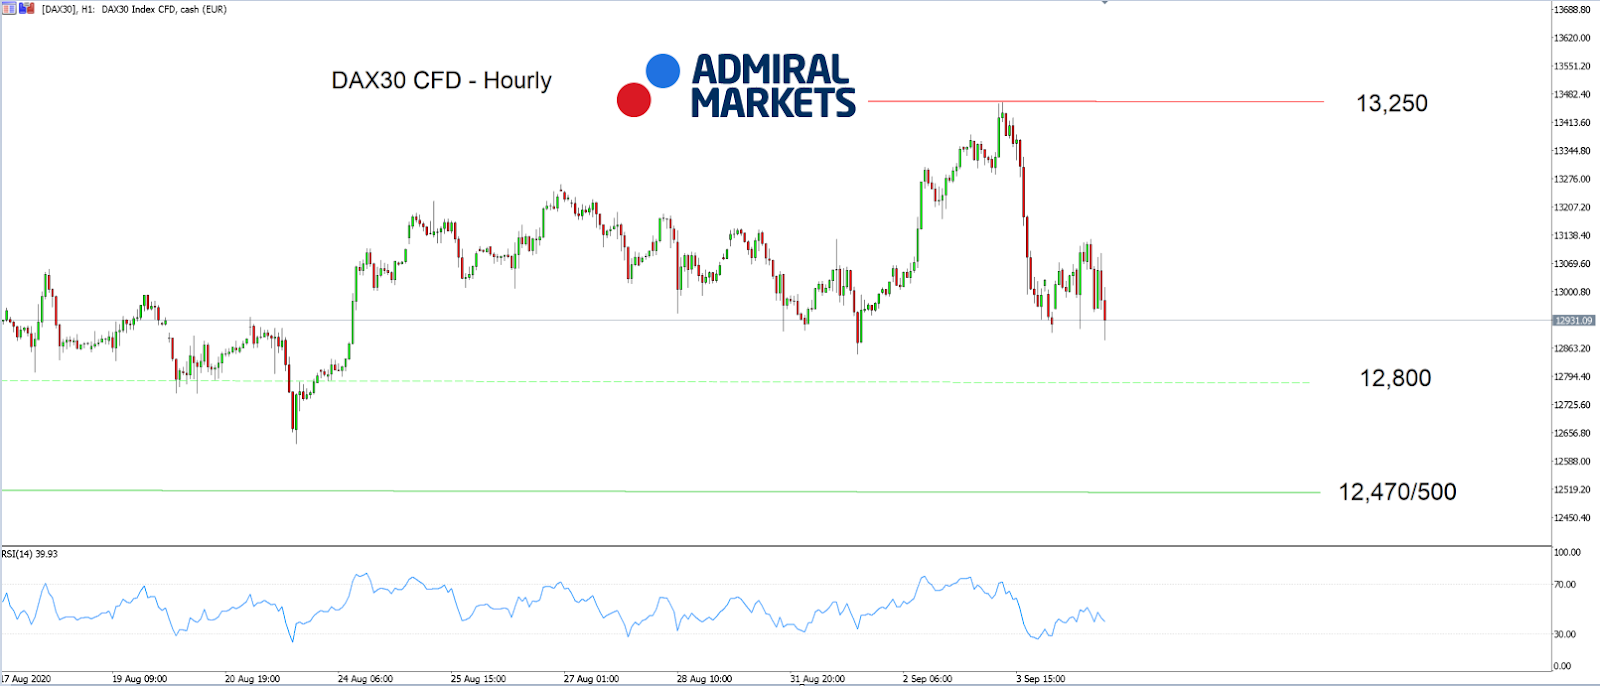
Purely technically speaking, the mode on H1 remains bullish for the DAX30, though with a neutral tendency.

While accelerating bearish momentum shouldn’t be necessarily expected on Monday, a sustainable break below 12,800 points in the days to come darkens the technical picture and makes a deeper correction likely, activating the region around 12,470/500 points as a first target.

If the bearish action on Thursday was only a “one-off”, another bullish stint with a successful break above the pre-weekly highs around 13,450 points levels the path to All Time Highs around 13,800 points, though with a stop-over around 13,600 points:

DAX30 hourly chart

Source: Admiral Markets MT5 with MT5SE Add-on DAX30 CFD Hourly chart (between August 17, 2020, to September 04, 2020). Accessed: September 04, 2020, at 10:00 PM GMT

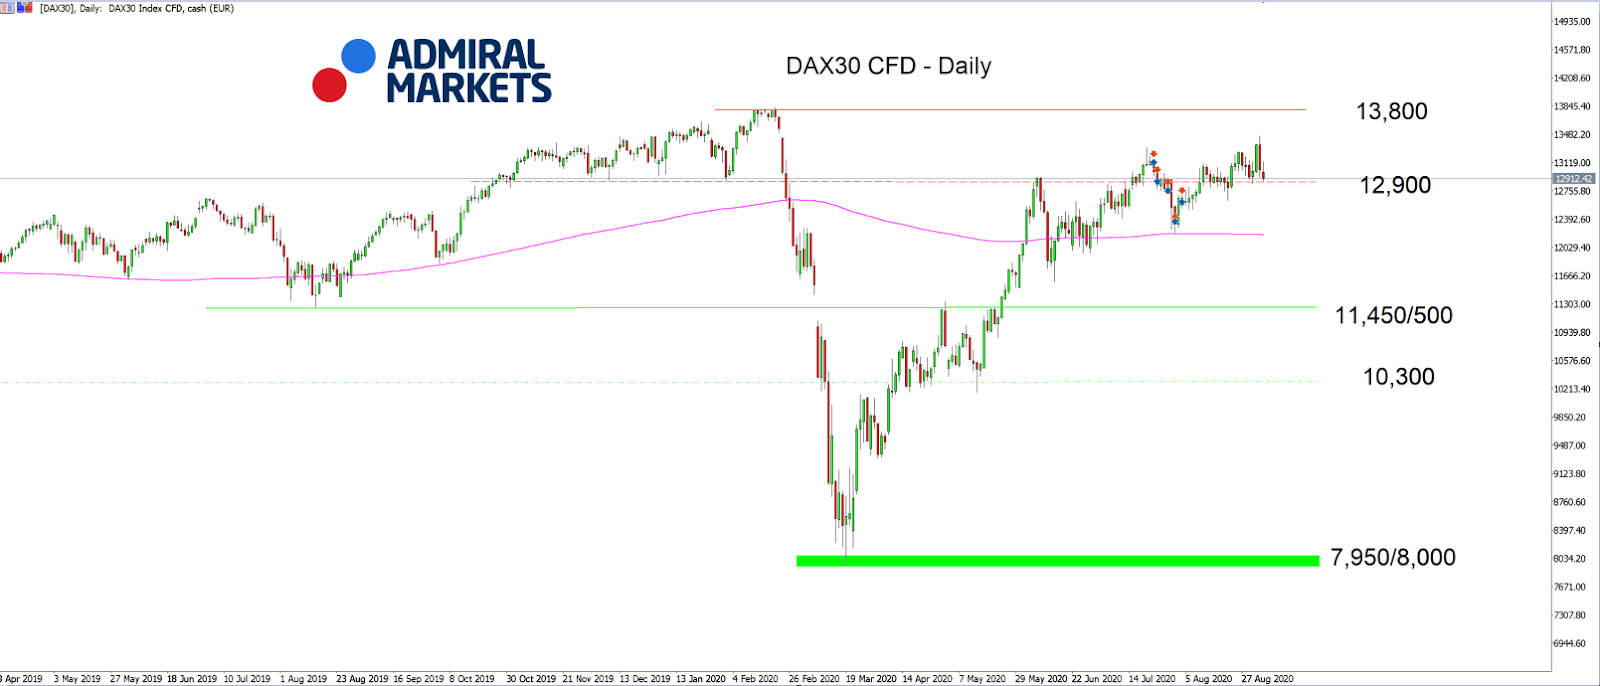
DAX30 daily chart

Source: Admiral Markets MT5 with MT5SE Add-on DAX30 CFD Daily chart (between April 08, 2019, to September 04, 2020). Accessed: September 04, 2020, at 10:00 PM GMT Please note: Past performance is not a reliable indicator of future results, or future performance.

In 2015, the value of the DAX30 CFD increased by 9.56%. In 2016, it increased by 6.87%. In 2017, it increased by 12.51%. In 2018, it fell by 18.26% and in 2019, it increased by 26.44%, meaning that in five years, it was up by 34.2%.

Check out Admiral Markets’ most competitive conditions on the DAX30 CFD and start trading on the DAX30 CFD with a low 0.8 point spread offering during the main Xetra trading hours.

Discover the world’s #1 multi-asset platform

Admiral Markets offers professional traders the ability to trade with a custom, upgraded version of MetaTrader 5, allowing you to experience trading at a significantly higher, more rewarding level. Experience benefits such as the addition of the Market Heat Map, so you can compare various currency pairs to see which ones might be lucrative investments, access real-time trading data, and so much more. Click the banner below to start your FREE download of MT5 Supreme Edition!

Trade With MetaTrader 5

Disclaimer: The given data provides additional information regarding all analysis, estimates, prognosis, forecasts or other similar assessments or information (hereinafter “Analysis”) published on the website of Admiral Markets. Before making any investment decisions please pay close attention to the following:

  1. This is a marketing communication. The analysis is published for informative purposes only and is in no way to be construed as investment advice or recommendation. It has not been prepared in accordance with legal requirements designed to promote the independence of investment research, and that it is not subject to any prohibition on dealing ahead of the dissemination of investment research.
  2. Any investment decision is made by each client alone whereas Admiral Markets shall not be responsible for any loss or damage arising from any such decision, whether or not based on the Analysis.
  3. Each of the Analysis is prepared by an independent analyst (Jens Klatt, Professional Trader and Analyst, hereinafter “Author”) based on the Author’s personal estimations.
  4. To ensure that the interests of the clients would be protected and objectivity of the Analysis would not be damaged Admiral Markets has established relevant internal procedures for prevention and management of conflicts of interest.
  5. Whilst every reasonable effort is taken to ensure that all sources of the Analysis are reliable and that all information is presented, as much as possible, in an understandable, timely, precise and complete manner, Admiral Markets does not guarantee the accuracy or completeness of any information contained within the Analysis. The presented figures that refer to any past performance is not a reliable indicator of future results.
  6. The contents of the Analysis should not be construed as an express or implied promise, guarantee or implication by Admiral Markets that the client shall profit from the strategies therein or that losses in connection therewith may or shall be limited.
  7. Any kind of previous or modeled performance of financial instruments indicated within the Publication should not be construed as an express or implied promise, guarantee or implication by Admiral Markets for any future performance. The value of the financial instrument may both increase and decrease and the preservation of the asset value is not guaranteed.
  8. The projections included in the Analysis may be subject to additional fees, taxes or other charges, depending on the subject of the Publication. The price list applicable to the services provided by Admiral Markets is publicly available from the website of Admiral Markets.

Leveraged products (including contracts for difference) are speculative in nature and may result in losses or profit. Before you start trading, you should make sure that you understand all the risks.

By Admiral Markets

Global stocks down with US markets closed for Labor Day

By IFCMarkets.com

Top daily news

Equity markets are retreating currently after another bearish session last Friday following Thursday selloff. Retreat continued despite a better than expected US jobs report.

Forex news

Currency PairChange
EUR USD-0.12%
GBP USD-0.24%
USD JPY-0.05%
The Dollar strengthening continues currently . The live dollar index data show the ICE US Dollar index, a measure of the dollar’s strength against a basket of six rival currencies, edged up less than 0.1% Friday after Labor Department data showing US economy added 1.4 million jobs in August and the unemployment rate fell to 8.4% from 10.2%. GBP/USD halted its sliding Friday while EUR/USD continued falling with both pairs lower currently. AUD/USD joined USD/JPY’s continued climbing Friday with yen higher against the greenback currently while Australian dollar has given up much of its Friday gain.

Stock Market news

IndicesChange
Dow Jones Index+0.17%
GB 100 Index+0.74%
Nikkei Index-0.5%
Futures on US equity benchmark are down currently with US markets closed in observance of Labor Day today. The three main US stock indexes recorded losses ranging from 1.3% to 3.3% last week led mainly by large capitalization technology shares. European stock indexes are rising currently after a pullback Friday following a weaker than expected German factory orders report for July. Asian indexes are mostly lower today despite report China’s August exports were stronger than expected, surging 11.6% in August.

Commodity Market news

CommoditiesChange
Brent Crude Oil-0.6%
WTI Crude-1.2%
Brent is extending losses today after world’s top oil exporter Saudi Arabia cut the October official selling price for Arab Light crude it sells to Asia by the most since May. Oil prices ended lower last session. The US oil benchmark West Texas Intermediate (WTI) futures are lower currently after October WTI tumbled 3.9% Friday. November Brent crude lost 3.2% to $42.66 a barrel on Friday.

Gold Market News

MetalsChange
Gold+0.16%
Gold prices are edging up today. December gold slipped 0.2% to $1934.30 an ounce on Friday.

Market Analysis provided by IFCMarkets.com

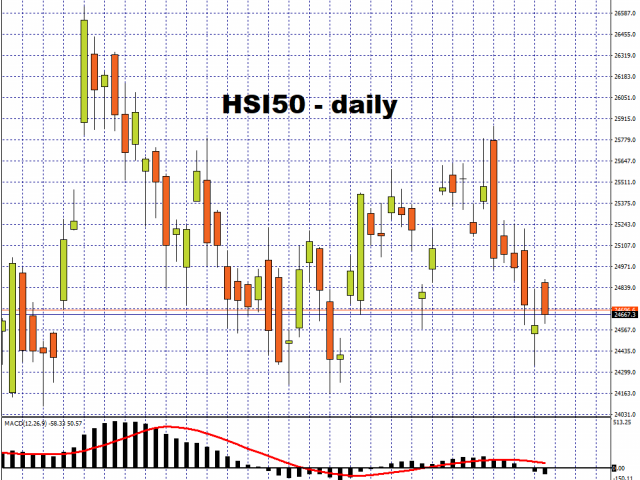
New-look Hang Seng gains as global selloff takes a breather

By Han Tan, Market Analyst, ForexTime

Starting today, the Hang Seng Index now features the likes of Alibaba, Xiaomi, and WuXi Biologics, after the new lineup on the 50-member index was announced some three weeks ago. The stock benchmark managed to overcome early losses to climb higher as the new trading week got underway, with all three debutants also attempting to start off on the right foot. At the time of writing, Xiaomi shares are edging higher, while Alibaba and WuXi Biologics are in the red.

Still, the inclusion into the city’s benchmark index had been a boon for the three new entrants since the announcement was made on August 14th. Over the past three weeks, Alibaba’s shares in Hong Kong had climbed by over 12 percent, Wuxi Biologics advanced more than 16 percent, while Xiaomi surged nearly 60 percent!

Asian stock markets are mostly in the green on Monday, as it tries to bring a halt to the selloff in global stocks. The MSCI’s flagship global equity index fell 2.28 percent last week, its largest since the week ending June 12th, which brought an end to a run of five consecutive weekly gains.

Investors’ nerves have been left understandably raw after last week’s selloff, led by US tech stocks. US futures are now mixed, with the slight gains in the Dow Jones futures offset by the declines in their Nasdaq 100 counterparts. European futures however are moving decisively into the green at the time of writing.

The rest of the world will have to tow their own line today, with US markets closed for Labour Day. Perhaps US market participants could use the longer weekend to mull decisively whether to extend the slide in US equities or bring a halt to the latest selloff.

Investors will also be eyeing key event risks, such as the fate of the next round of US fiscal stimulus measures, in perhaps deciding how US equities should fare over the near-term. A longer delay to another injection of support for the US economy however could mean further losses in US tech counters, with the Nasdaq 100 having already flirted with a 10 percent correction last week. The resumption of Brexit talks, as well as the ECB policy decision later this week, all add to the potential event risks over the coming days.


Disclaimer: The content in this article comprises personal opinions and should not be construed as containing personal and/or other investment advice and/or an offer of and/or solicitation for any transactions in financial instruments and/or a guarantee and/or prediction of future performance. ForexTime (FXTM), its affiliates, agents, directors, officers or employees do not guarantee the accuracy, validity, timeliness or completeness, of any information or data made available and assume no liability as to any loss arising from any investment based on the same.


Forex-Time-LogoArticle by ForexTime

ForexTime Ltd (FXTM) is an award winning international online forex broker regulated by CySEC 185/12 www.forextime.com

From Shenzhen’s Economic Miracle to Greater Bay’s Global Innovation

By Dan Steinbock

– Since the 1980s, China’s reforms and Special Economic Zones have sparked Shenzhen’s economic miracle, Guangdong’s industrial transformation and Greater Bay Area’s innovation engine.

Paced by strong economic growth, industrialization and urbanization that took almost a century in the West occurred in just a few decades in China, following more than a century of colonial intrusions.

Nothing exemplifies the success story more than Shenzhen. *

From subsistence fishing village to world-class innovation megacity

In 1979, Shenzhen was still a poor fishing village with some 20,000 inhabitants struggling at a subsistence level. It was a rural backwater, next to the modern and thriving Hong Kong.

Yet, already half a decade ago, GDP per capita in Nanshan, a district of Shenzhen, rose to $49,000, the highest for any district in China, overtaking Hong Kong, and catching up with Singapore.

Today, Shenzhen’s urban population hovers around 14 million, while the metro area is some 10 million larger. The megacity’s GDP amounts to $390 billion, which – if it was a country – would include Shenzhen among the top-30 economies worldwide.

More importantly, Shenzhen’s GDP per capita now exceeds $30,000, even at the nominal level, which is at par with South Korea and Spain.

What accounts for such an “economic miracle”? The key to Shenzhen’s transformation involves Deng Xiaoping’s economic reforms and opening-up policies – most notably, the rise of the Special Economic Zones (SEZs).

Four decades of reforms and SEZs four major industry complexes

Shenzhen was China’s first major SEZ experiment in which special tax incentives were offered for foreign investments and greater independence from the central government in international trade. Driven by market forces, manufactured products would be mainly export-oriented.

Embracing reforms, Shenzhen developed its four-pillar sectors of advanced technology, supportive finance, efficient logistics, and entrepreneurial culture. Today, it hosts the world’s most advanced information and communication technology (ICT) giants, including Huawei, Tencent, ZTE, and the drone-maker DJI.

In addition to “China’s Silicon Valley,” it is seen among the world’s top-10 financial centers housing mighty financial institutions. In logistics and transportation, its courier giants (SF Express), shipping companies (CIMC), ports, and railway networks are some of the busiest in the world, while real estate accounts for a 10th of its economy.

Shenzhen’s GDP surpassed that of neighboring Hong Kong a couple of years ago. In the Chinese mainland it ranks third, right after Shanghai and Beijing. With growth at 6.7 percent last year, it is still expanding two to three times faster than Hong Kong and Singapore, and the stagnating metropolises in the West.

From assembly plants and imitation to global innovation leadership

If Guangdong is today the trendsetter in global innovation, Shenzhen is the very center of its technology progress.

As measured by R&D per GDP, China’s innovation expenditures have steadily climbed to about 2.2 percent. Despite huge population, that puts the Chinese mainland before Singapore and Australia, and far ahead the UK and Canada.

In relative terms, China’s R&D per GDP is already twice as high as that of Italy and France. In Guangdong with its 115 million people, the comparable R&D figure is over 2.7 percent. It is right behind Germany but ahead of the United States.

But in Shenzhen, R&D per GDP is even higher – estimated at 4.2 percent – which puts it right behind the current world leaders, the tiny Israel (4.9%) and South Korea (4.3%).

Like Western Europe and Japan in the postwar era, Chinese companies used to imitate the global technology leaders in the past. But today, Chinese giants innovate while being imitated by global competitors and cooperators.

The rise of the Greater Bay Area, China’s Silicon Valley

Until recently, industrial transformation and world-class innovation was driven by Shenzhen and supported by Guangdong and the Pearl River Delta. But the region moved to a new stage when the blueprint of the Greater Bay Area (GBA) was launched in February 2018.

The GBA is driven by multiple mega-metro areas, intercity and regional railway networks, and several world-class airports. It comprises the nine cities of Guangdong – including Guangzhou, Shenzhen, and Dongguan – and the special administrative regions of Hong Kong and Macau. It is thus interconnecting some 125 million people.

Just as San Francisco has its Silicon Valley in the Santa Clara Valley, the GBA aspires to become the sprawling economic engine in China. Last year, Silicon Valley’s GDP was $275 billion, according to the US Bureau of Economic Analysis.

As a regional giant, the GBA, which accounts for 40 percent of China’s total exports, is already nearly three times bigger. Its combined GDP is $810 billion.

Obviously, living standards remain significantly higher in Silicon Valley. Then again, the US regional engine has evolved since the postwar era, whereas GBA has barely been born.

Technology wars against regional innovation engines worldwide

And perhaps that’s one reason why the Trump White House’s trade war has expanded into high-tech. Unlike its predecessors, the current administration hopes to marginalize Chinese innovators in the US, neutralize their executives, sanction their international partners, and ultimately destabilize their broad global ecosystems.

Such a trade war against regional innovation engines in China, Europe, Japan and elsewhere violates the very rules of international trade. It reflects a desperate political re-election campaign, which has alienated most Americans. And it is undermining the role of the US as a responsible stakeholder in the multilateral, global economy.

Not so long ago, international observers projected doom in Shenzhen because the forces that once boosted Guangdong’s economic boom – industrialization, world trade, and low-cost manufacturing – were fading. But they missed the big picture.

As industrialization decelerated, Guangdong was already moving into post-industrial society while transforming into an advanced manufacturing and global innovation hub. In that scheme, Shenzhen will have a central role as the global center for high technology, innovation and venture capital, and social media.

In the short-term, the GBA will have to cope with adverse international headwinds but its time horizon is not based on quarterly results, or even four-year outlook. It is looking toward the mid-21st century.


*  These are some of my works on the topic (the non-proprietary ones can be found via Amazon.com): The Nokia Revolution (2001), Wireless Horizon: Strategy and Competition in the Worldwide Mobile Marketplace (2002), The Mobile Revolution (2005), Winning Across Global Markets (2010), Huawei in America (2012), Asian New Deal in Global Innovation (2014), Erosion of American Innovation (2015), The Rise of Chinese Robotics (2017), Shenzhen’s Economic Miracle and Chinese Greater Bay Area (2020).

 About the Author:

Dr. Dan Steinbock is an internationally recognized strategist of the multipolar world and the founder of Difference Group. He has served at the India, China and America Institute (USA), Shanghai Institutes for International Studies (China) and the EU Center (Singapore). For more, see https://www.differencegroup.net/ 

A version of the commentary was published by China Daily on August 26, 2020