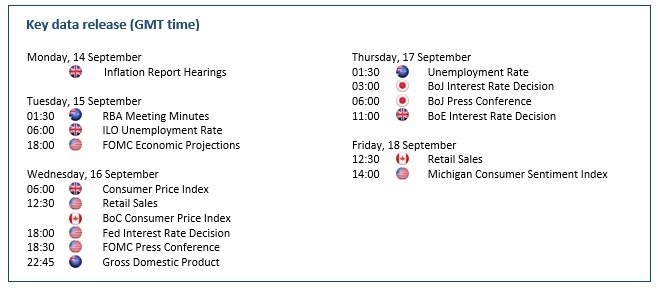
The Week Ahead: One Step Forward, Two Steps Back

By Orbex

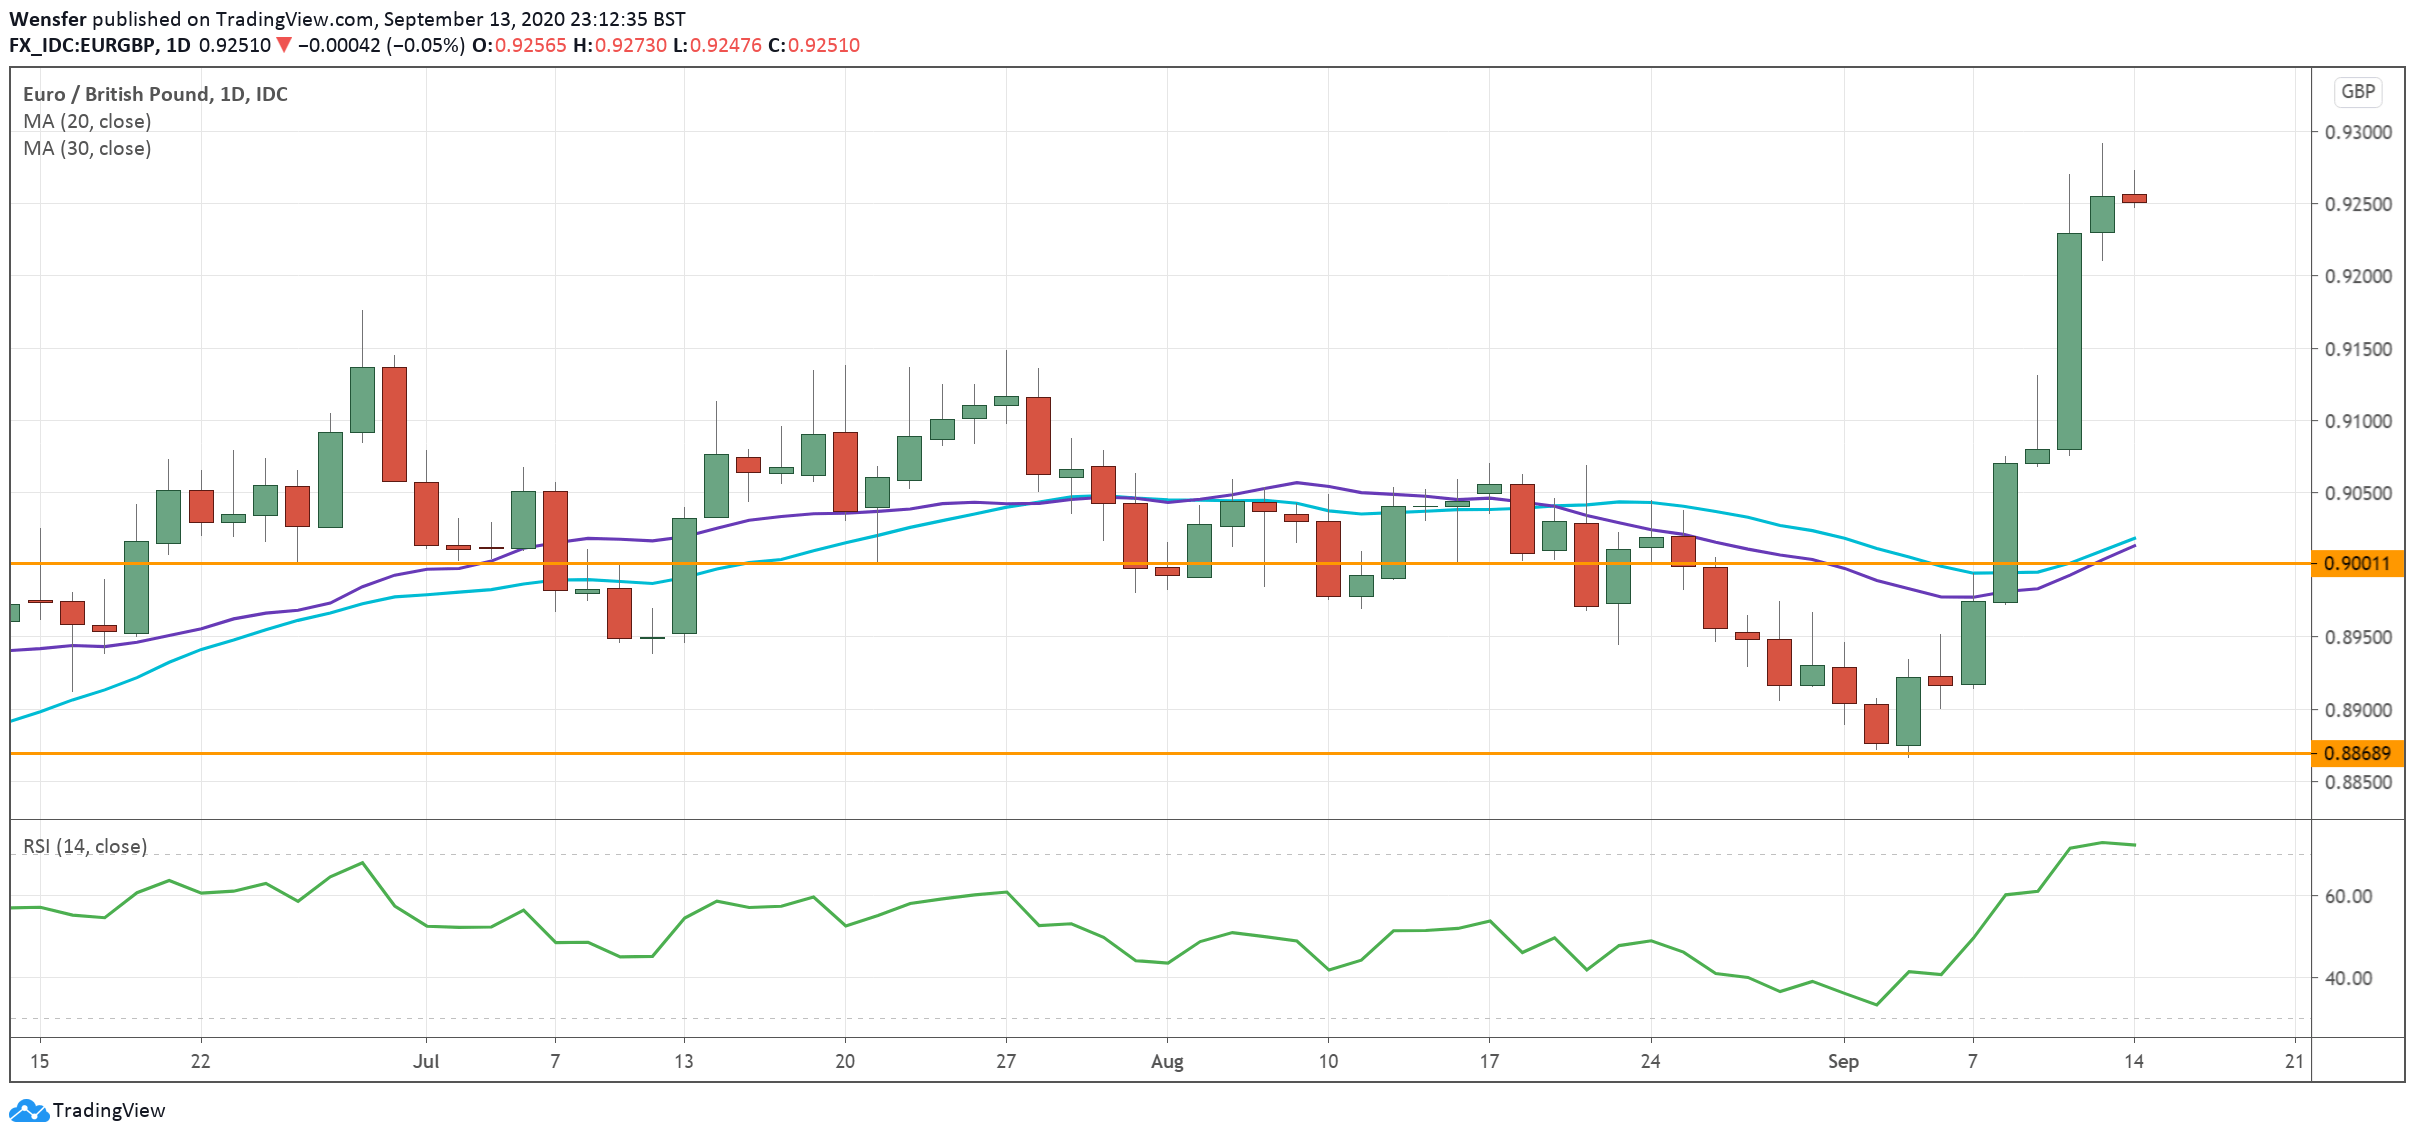
EURGBP Surges as Brexit Talks Stall

The British pound slipped into troubled waters after Brexit became the flashpoint once again.

Boris Johnson’s Internal Market Bill, which could override the withdrawal agreement in regards to Irish borders could wage another tug-of-war with the EU.

Tensions have risen as talks resume this Monday, and the pound’s sell-off is yet to end as markets anticipate significant roadblocks ahead. The hint of a no-deal by the October 15 deadline is likely to keep UK’s currency under pressure.

The euro has broken above 0.9050 and is on its way to last March high of 0.9500. In case of a pullback 0.9000 is the immediate support.

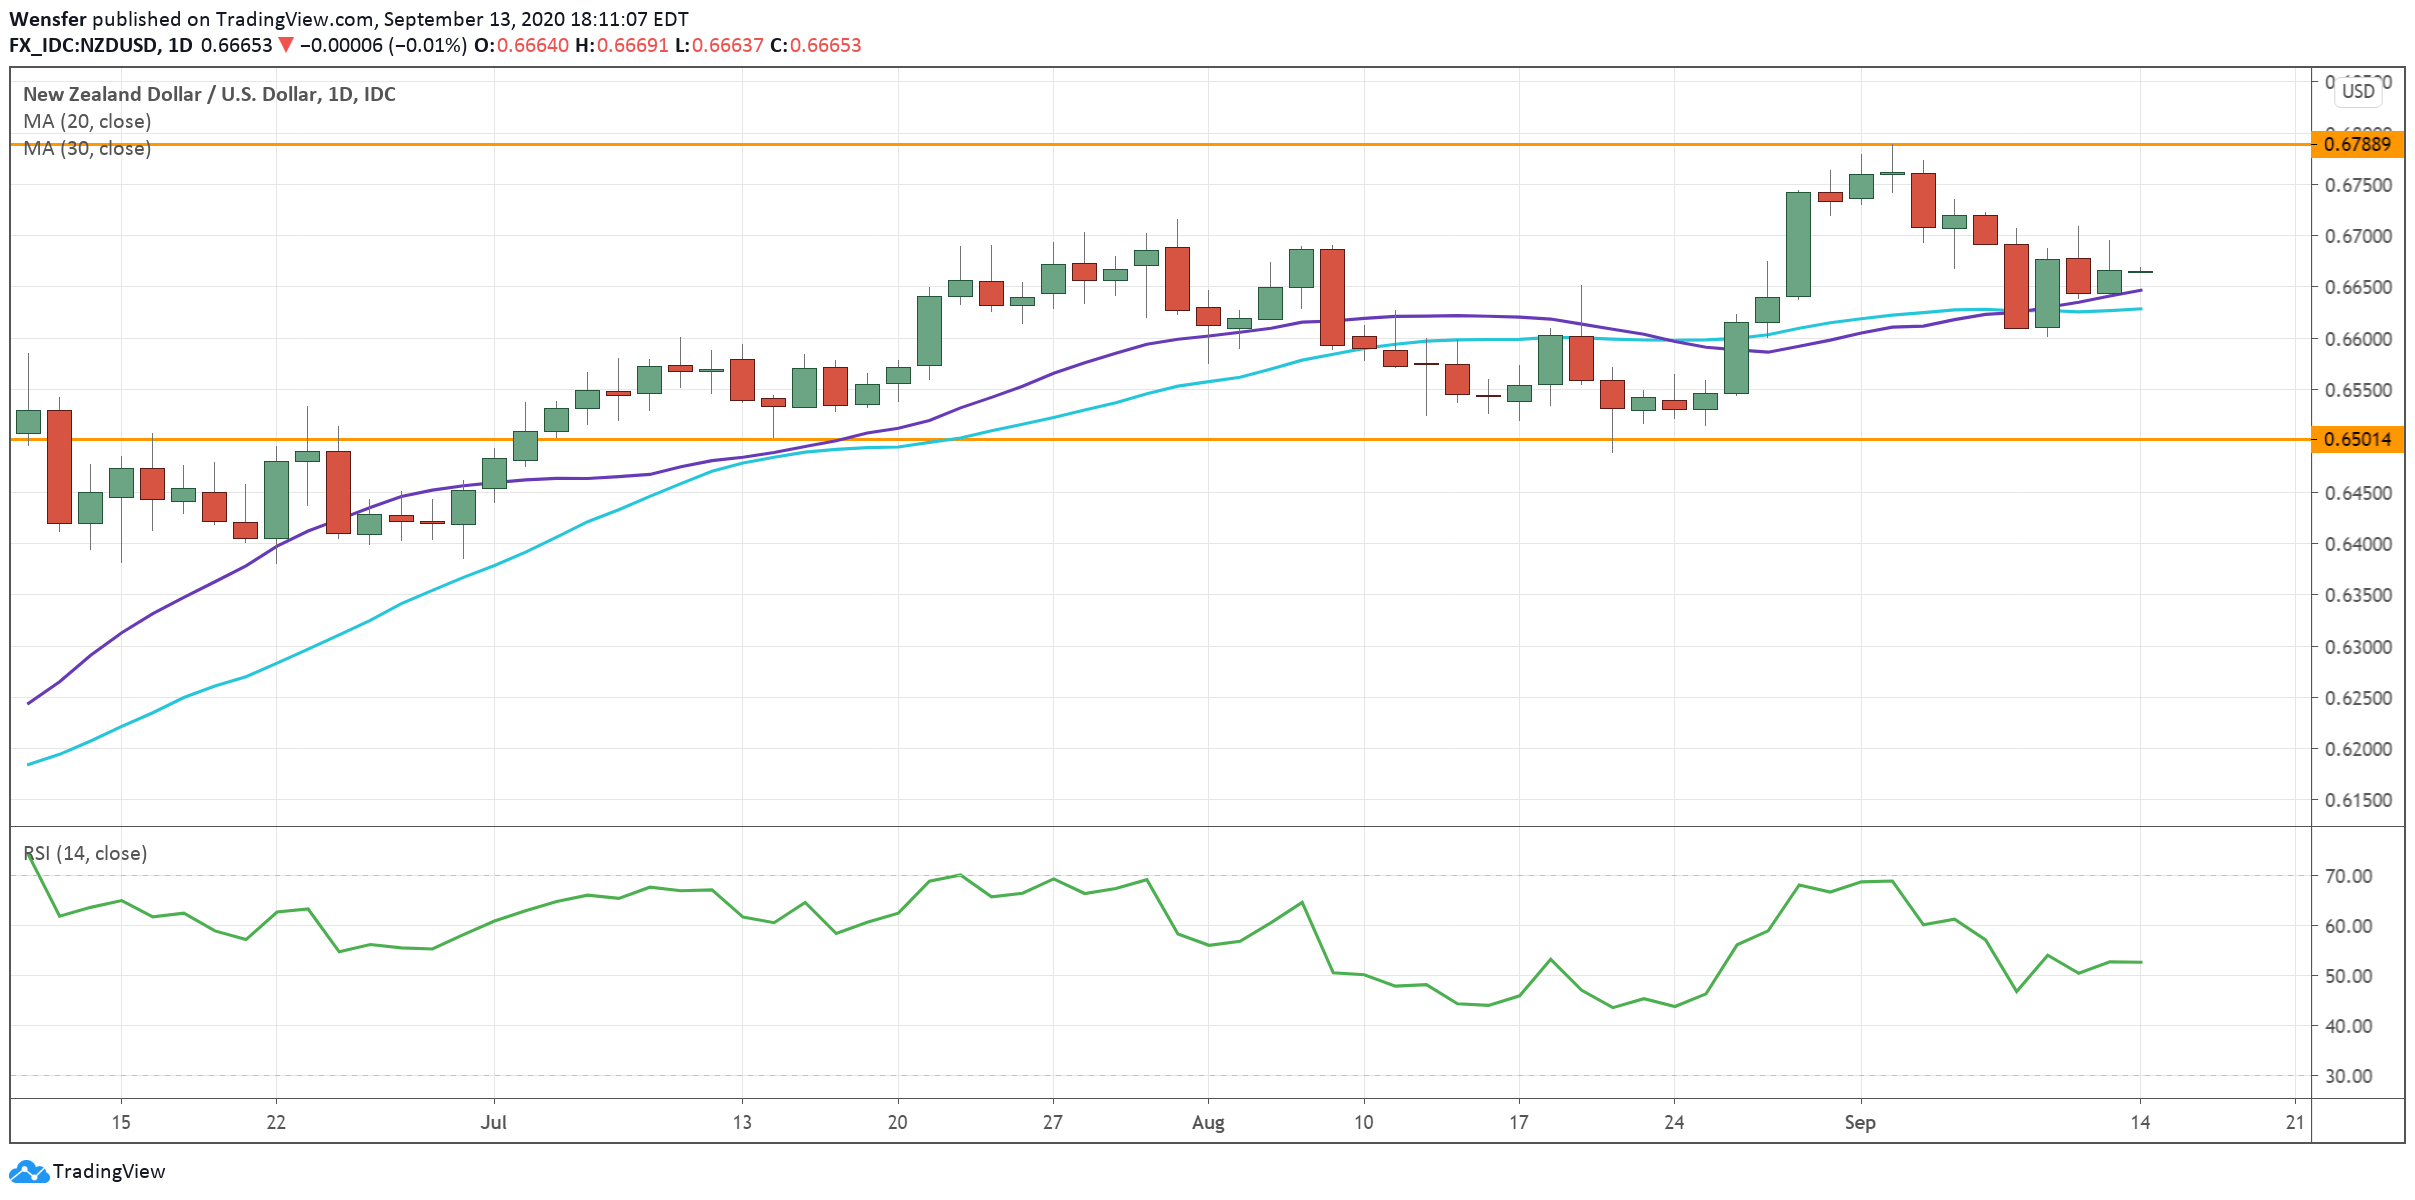
NZDUSD Grinds Higher Ahead of FOMC

The US dollar’s latest comeback may turn out to be short-lived as markets brace for the upcoming FOMC. Rising jobless claims would argue in favor of additional stimulus measures.

As Congress failed to deliver on the fiscal front, markets have switched their attention to the Fed to tie up loose ends. Further easing would prop up riskier assets like equities and the kiwi, while the greenback falls victim of a dead cat bounce.

The pair is making another attempt at the resistance at 0.6790. The demand area between 0.6500 and the rising trend line is a major support to keep the bullish action intact.

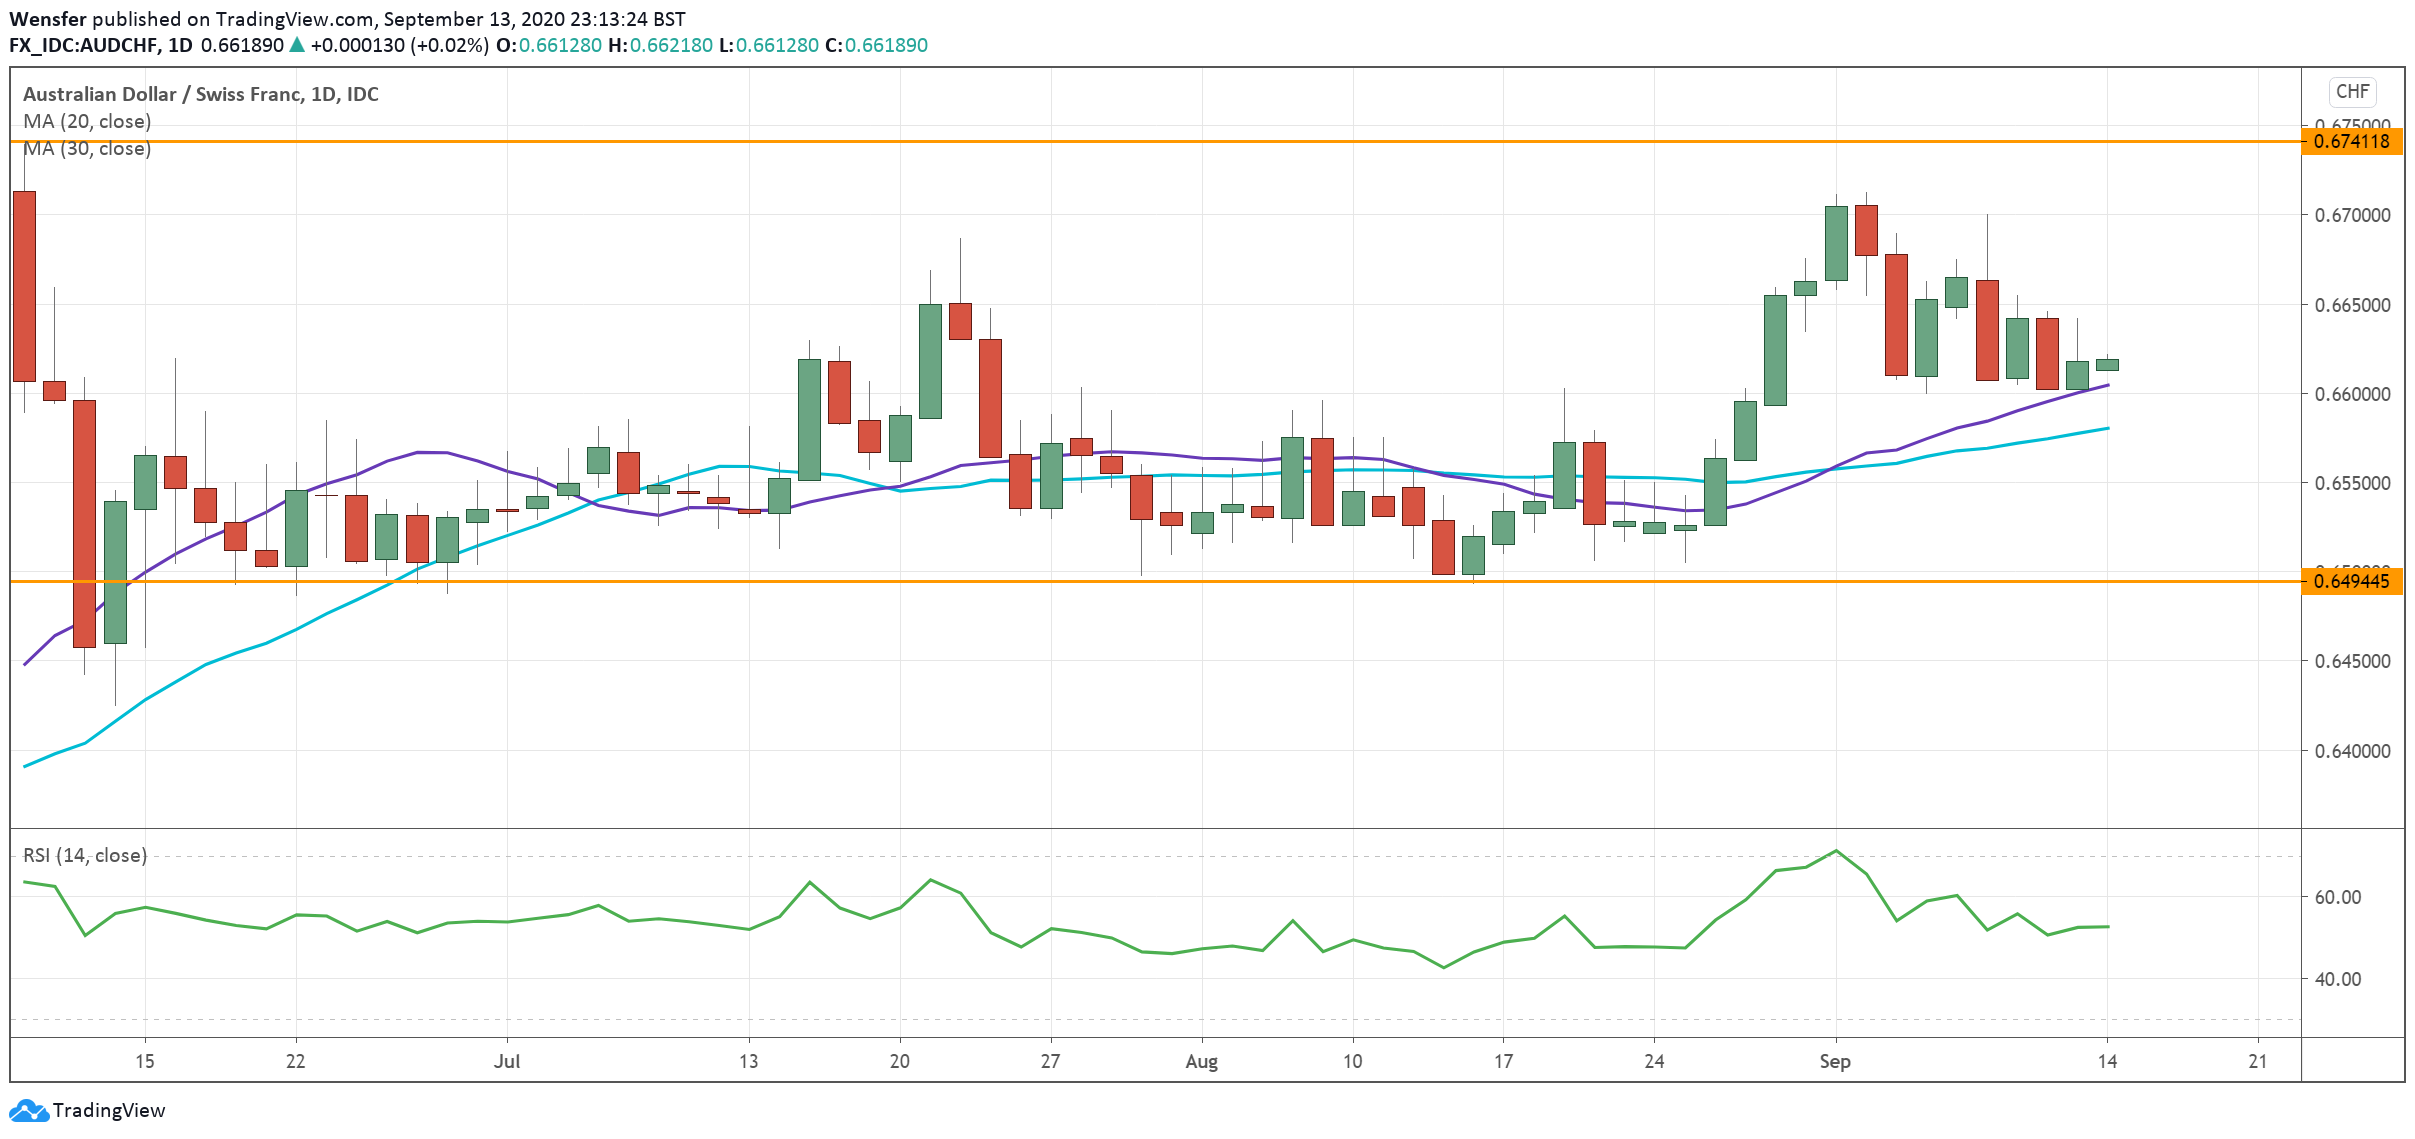
AUDCHF Keeps High Ground Ahead of Jobs Data

The pair’s latest pullback might be temporary as markets shrugged off extended COVID restrictions in Melbourne. The Reserve Bank of Australia’s refusal to consider negative interest policy has effectively put a floor under the currency.

Thursday’s unemployment rate could heighten market volatility. An improvement would give the central bank confidence in its current wait-and-see approach. A deterioration, however, might signal “further monetary measures” down the road at the expense of the Aussie.

0.6500 is a key support to the half-year-long uptrend. A surge above 0.6740 could trigger an extended rally.

CADJPY Gathers Momentum as BoJ Meets

The Canadian dollar may benefit from a combination of a rebound in oil markets and a weaker yen this week.

Japanese Prime Minister Shinzo Abe’s likely successor Yoshihide Suga has pledged to maintain Abenomics, a nod to the loose monetary policy from the Bank of Japan.

The central bank may reiterate its willingness to take additional easing measures at this week’s meeting, should the fragile recovery show signs of stalling. As risk sentiment makes its way back, a dovish BoJ may further add pressure to the yen.

The pair is hovering under last June’s high of 81.80, and a bullish breakout may propel the rate towards 84.

By Orbex


Bitcoin to replace gold as top safe-haven asset within a generation

By George Prior

Bitcoin will replace gold as the ultimate financial safe haven within a generation, predicts the CEO of one of the world’s largest independent financial advisory and fintech organizations.

The prediction from Nigel Green, chief executive and founder of deVere Group, comes as growing geopolitical uncertainty, including Brexit and the U.S. presidential election, and central banks’ historic money printing policies, amongst other issues, are prompting many investors to urgently rebalance their portfolios.

He comments: “For thousands of years, gold has been the ultimate financial safe haven.

“It’s always been the go-to asset in times of political, social and economic uncertainty as it is expected to retain its value or even grow in value when other assets fall, therefore enabling investors to reduce their exposure to losses.

“Moving forward, older investors are likely to continue with gold, but millennials and Generation Z, who are so-called ‘digital natives’, can be expected to go for Bitcoin and other digital currencies instead.

“I believe that the precious metal will lose its crown as the most sought-after reserve asset to Bitcoin within a generation – particularly because the biggest-ever generational transfer of wealth – likely to be more than $60tn – from baby boomers to millennials is already underway.”

Mr Green continues: “Bitcoin’s key characteristics, such as its fixed supply and how transactions are immutable, distributed, non-sovereign and decentralised are highly attractive for investors in an uncertain but increasingly digitalised, tech-driven world.

“It has already earned it the label ‘digital gold’ and I believe its status in this regard will grow exponentially over the next year or two, especially with the economic fallout from Covid, central banks’ record-shattering levels of money-printing, heightening trade tensions between economic superpowers, and mounting social and political unrest.”

The deVere CEO concludes: “Until now, gold has been known as the ultimate safe-haven asset, but Bitcoin — which shares its key characteristics of being a store of value and scarcity — will take over.

“As the world turns ever-more digital and is more and more financially dominated by those who have grown up surrounded by technology, from an investment point of view, gold will increasingly be seen as a relic of the past.”

About:

deVere Group is one of the world’s largest independent advisors of specialist global financial solutions to international, local mass affluent, and high-net-worth clients.  It has a network of more than 70 offices across the world, over 80,000 clients and $12bn under advisement.

Ichimoku Cloud Analysis 14.09.2020 (BRENT, GBPUSD, NZDUSD)

Article By RoboForex.com

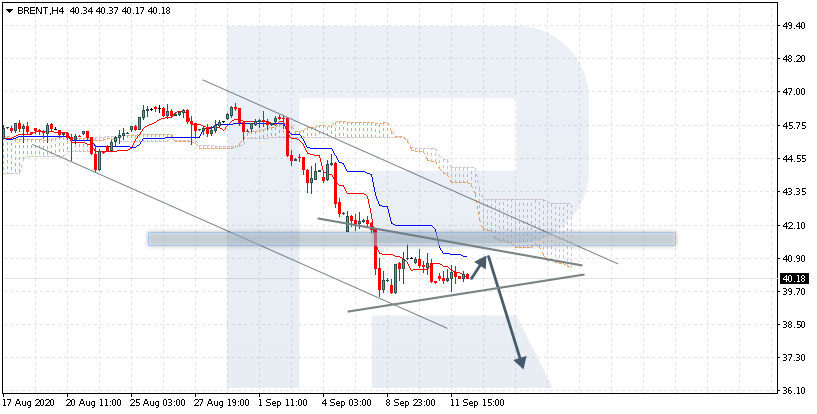
BRENT

Brent is trading at 40.18; the instrument is moving below Ichimoku Cloud, thus indicating a descending tendency. The markets could indicate that the price may test Tenkan-Sen and Kijun-Sen at 40.90 and then resume moving downwards to reach 37.05. Another signal in favor of further downtrend will be a rebound from the upside border of the Triangle pattern. However, the bearish scenario may no longer be valid if the price breaks the cloud’s upside border and fixes above 43.65. In this case, the pair may continue growing towards 44.55. To confirm further decline, the asset must break the pattern’s downside border and fix below 39.45.

BRENT
Risk Warning: the result of previous trading operations do not guarantee the same results in the future

GBPUSD, “Great Britain Pound vs US Dollar”

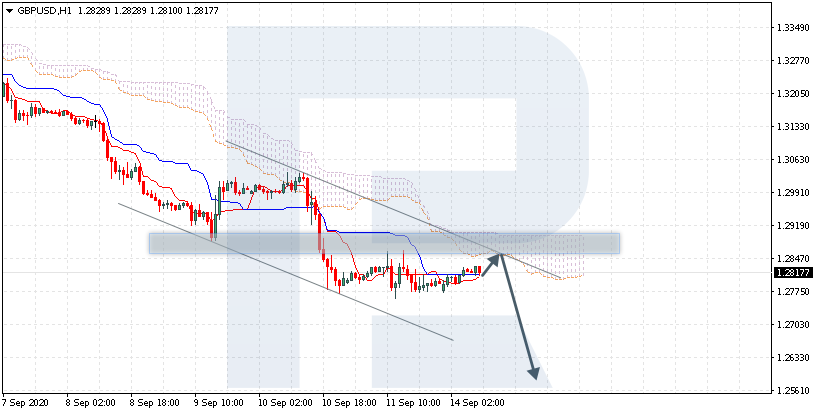
GBPUSD is trading at 1.2817; the instrument is moving below Ichimoku Cloud, thus indicating a descending tendency. The markets could indicate that the price may test the cloud’s downside border at 1.2845 and then resume moving downwards to reach 1.2565. Another signal in favor of further downtrend will be a rebound from the descending channel’s upside border. However, the bearish scenario may no longer be valid if the price breaks the cloud’s upside border and fixes above 1.2935. In this case, the pair may continue growing towards 1.3025.

GBPUSD
Risk Warning: the result of previous trading operations do not guarantee the same results in the future

NZDUSD, “New Zealand Dollar vs US Dollar”

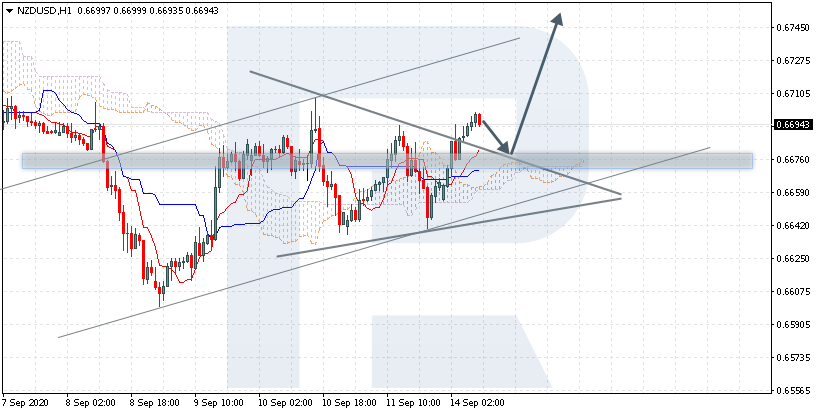
NZDUSD is trading at 0.6694; the instrument is moving above Ichimoku Cloud, thus indicating an ascending tendency. The markets could indicate that the price may test the cloud’s upside border at 0.6675 and then resume moving upwards to reach 0.6755. Another signal in favor of further uptrend will be a rebound from the upside border of a Triangle pattern. However, the bullish scenario may be canceled if the price breaks the cloud’s downside border and fixes below 0.6635. In this case, the pair may continue falling towards 0.6555.

NZDUSD

Article By RoboForex.com

Attention!
Forecasts presented in this section only reflect the author’s private opinion and should not be considered as guidance for trading. RoboForex LP bears no responsibility for trading results based on trading recommendations described in these analytical reviews.

Weekly Fundamental Bulletin: Fed & BoE Meetings

By Orbex

Last Week’s Highlights

Eurozone Economy Contracts Less than Forecast in Q2

The revised Q2 GDP data from the eurozone had some good news.

Economic activity fell at a slower pace than initially reported. The Eurozone’s GDP fell at a pace of 11.8% compared to the initial reports that showed a 12.1% decline.

Despite the modest improvement, the declines in the GDP were the largest since record-keeping began. The annual GDP recorded a 14.7% decline compared to 15% as per initial estimates.

German Exports Rise for Three Consecutive Months

The monthly export data from Germany, Europe’s largest economy, is showing signs of a rebound, rising for three months in a row.

The latest data for July showed that exports from Germany grew at a pace of 4.7% on a monthly basis.

Despite the increase, the pace was much slower compared to June’s increase of 14.9%. Economists were hoping for a 5% increase for the period.

Imports for the same period fell by 1.1%, compared to a 7% decline in the previous month. The data was a bit disappointing as the forecasts pointed to a 3.3% increase for the period.

Japan’s Economy Contracts More than Expected in Q2

The latest revised GDP numbers from Japan showed that the economy fell at a faster pace than initial estimates. The data covers the second quarter of the year with capital investments posting the sharpest decline.

Japan’s gross domestic product fell by 7.9% on a sequential basis. This was slightly more than the initial estimates showing a 7.8% decline.

On an annual basis, Japan’s economy is down by 28.1% compared to 27.8% in the first quarter.

Capital investment was revised down from -1.5% to -4.7%, while private consumption fell 7.9%.

China’s Inflation Slows in August

The latest consumer price data from China showed that inflation grew at a slower pace in August compared to the month prior.

However, factory price or the producer price index continued to improve. Official data showed that China’s headline inflation rose at a pace of 2.4% in August on a yearly basis. This is a slower pace compared to the 2.7% increase on the year in July.

The data was, however, in line with general forecasts. On a monthly basis, China’s inflation rose by 0.4%.

Producer prices, on the other hand, showed a decline of 2% on the year. This comes on the back of a 2.4% decline in July.

ECB Keeps Rates Steady

The European Central bank held its monetary policy meeting last week. No changes were made to interest rates and the monetary policy also refrained from tweaking its asset purchases.

While the broader market speculation was that the ECB would address the exchange rate concerns, the ECB fell short.

Chief Lagarde said that while the monetary policy committee is monitoring the exchange, the ECB was not targeting the exchange rate. This led to a modest rally in the euro.

Upcoming Economic Events

UK Unemployment Rate to Rise to 4.1%

The monthly labor market report from the UK is scheduled this week. Economists forecast that the unemployment rate will rise from 3.9% in July to 4.1% in August.

This comes as the average wages are set to fall 1.3%, following a 1.2% decline in the previous month. The UK’s unemployment rate is expected to rise higher largely due to a fall in the participation rate.

Speculation is that those who lost the jobs were facing challenges looking for work. The UK government also recently launched an effective furlough scheme. However, as the scheme is set to unwind towards the end of this year, there is a good chance the UK’s unemployment rate will continue to rise in the coming months.

New Zealand GDP to Drop 12.9% in Q2

The Q2 GDP report from New Zealand is forecast to show a 12.9% decline. This comes during the period when the country was in lockdown.

The lockdown is said to have put nearly a third of the economy out of action. The second-quarter decline comes following a 1.6% contraction during the first quarter of this year.

Most of the impact is said to come from the transportation, hospitality, and accommodation sectors.

Household consumption is forecast to contract nearly 20% while residential construction is forecast to fall by over 20%.

Australia Unemployment to Rise Slightly Higher in August

Australia’s monthly labor market report is forecast to show that the unemployment rate will rise by 7.7% in August. This follows an increase to 7.5% in the previous month.

However, underlying data suggests that the number of people re-entering the workforce will continue to rise. This was evident from the data seen in the months of June and July.

There are also expectations that part-time employment figures will also rise. In July, part-time employment was weaker compared to full-time employment while the hours worked had declined.

Fed to Keep Policy on Hold

Investors will be looking to the US Federal Reserve Board meeting this week.

No changes are expected to the US interest rates this week. In August, Fed Chair Powell signaled the Fed’s intention to pursue a strong labor market.

This meant that the Fed would temporarily allow inflation to rise over the 2% target rate.

The Fed will also be releasing its updated economic forecasts. It will be interesting to see if the Fed’s projections show a continued decline in US growth.

BoE to Strike a Dovish Tone

The Bank of England will be holding its monetary policy meeting on Thursday.

While no changes are expected to the interest rates, the central bank is likely to strike a dovish tone this week.

The expectations come amid a possible rise in the unemployment rate and Brexit tensions.

Ahead of the BoE meeting, UK inflation data will also be available. Forecasts point to UK inflation rise just 0.1% in August, following a rise of 1.0% in July on an annual basis.

By Orbex

Forex Technical Analysis & Forecast 14.09.2020

Article By RoboForex.com

EURUSD, “Euro vs US Dollar”

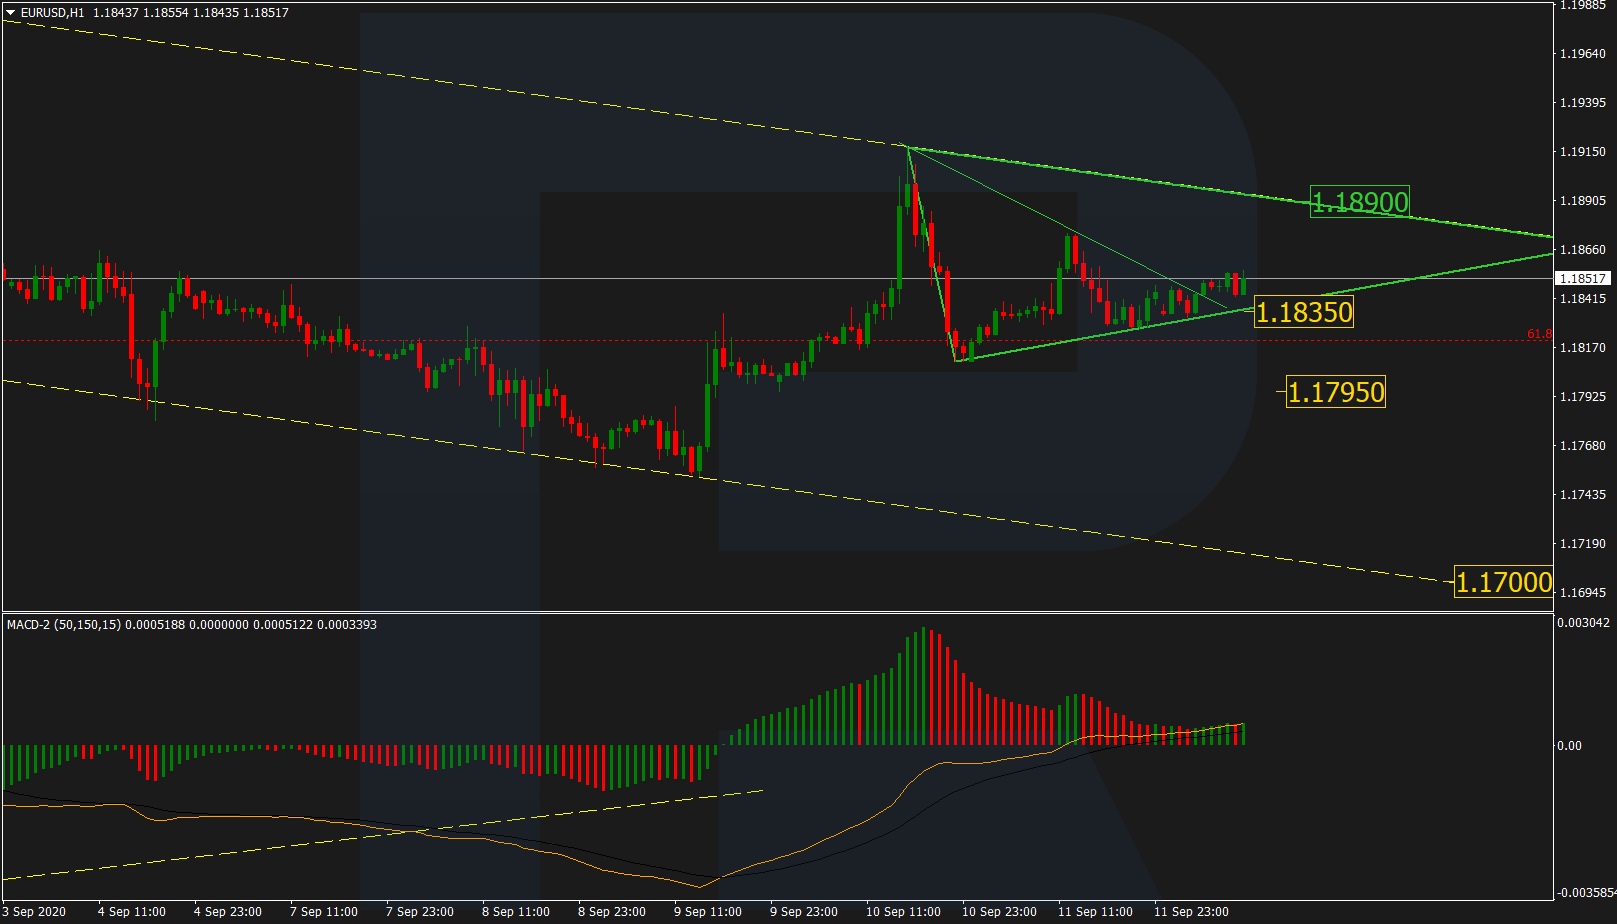
EURUSD is consolidating within a Triangle pattern. After testing the pattern’s downside border, the pair may grow to test the key resistance line of the descending channel at 1.1890. This scenario is confirmed by the MACD indicator, which is directed to the upside. However, considering that the major trend is bearish, one shouldn’t exclude the possibility of a breakout of the support level at 1.1835. In this case, the price may reach 1.1795 and fix below it. Later, the market may continue the downtrend towards 1.17.

EURUSD
Risk Warning: the result of previous trading operations do not guarantee the same results in the future

GBPUSD, “Great Britain Pound vs US Dollar”

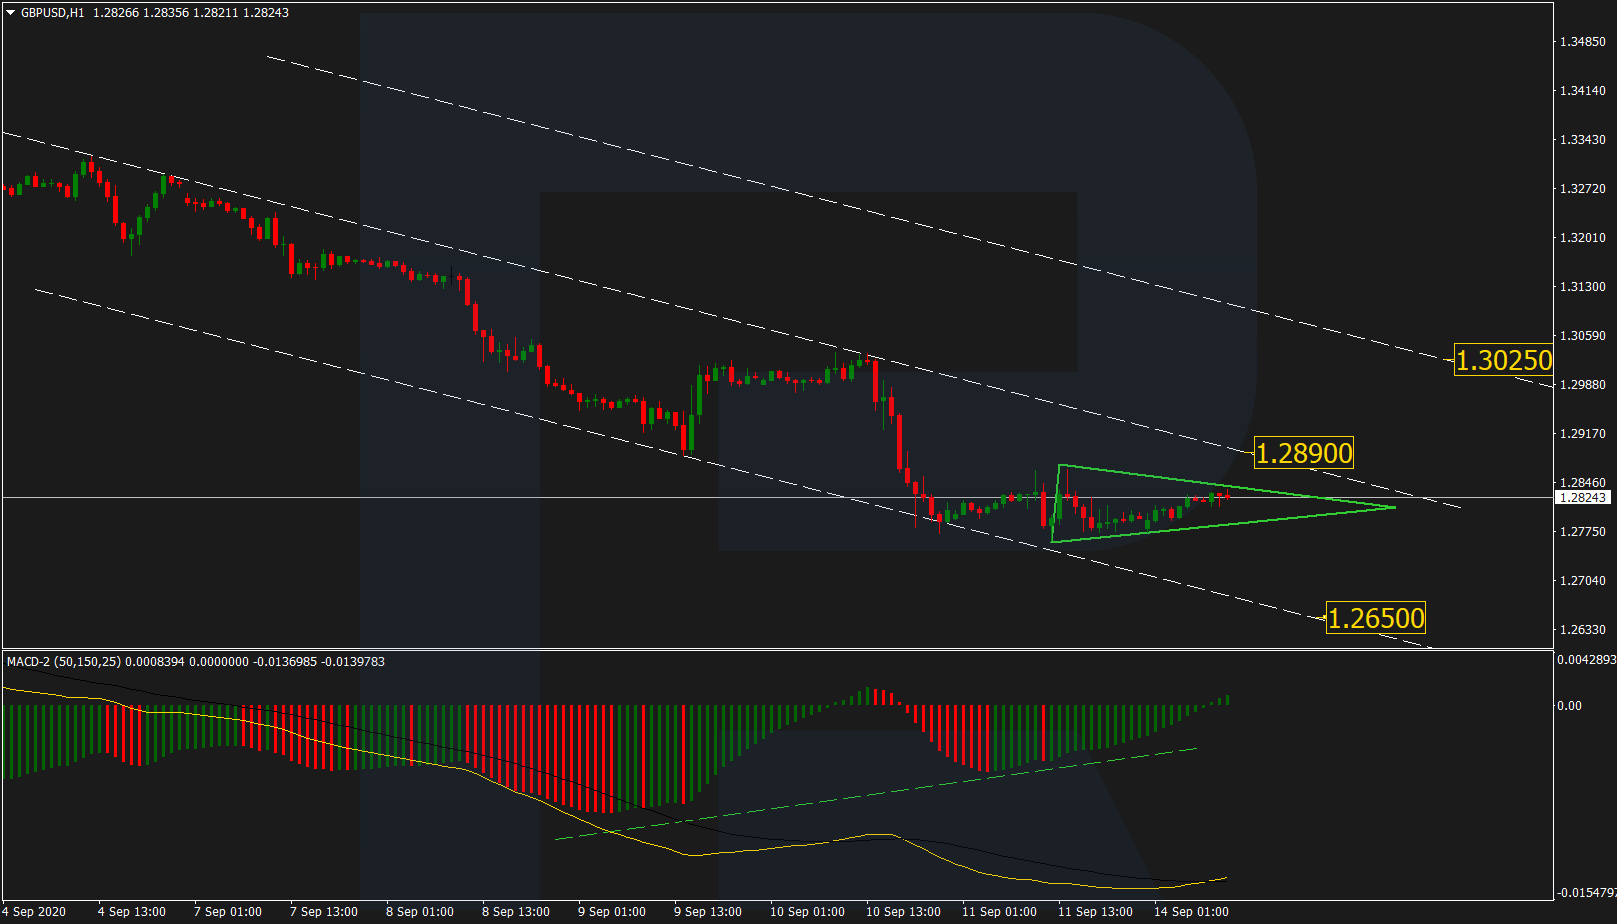
GBPUSD is still falling. After updating the short-term low and the convergence on MACD, the pair is forming a local correction in the form of a Triangle. In this case, both scenarios are possible – the price may break the pattern either to the upside or downside. In the former case, the instrument may test the resistance line at 1.2890 and then continue growing with the target at 1.3025. Otherwise, the market may continue trading downwards to reach 1.2650.

GBPUSD
Risk Warning: the result of previous trading operations do not guarantee the same results in the future

USDRUB, “US Dollar vs Russian Ruble”

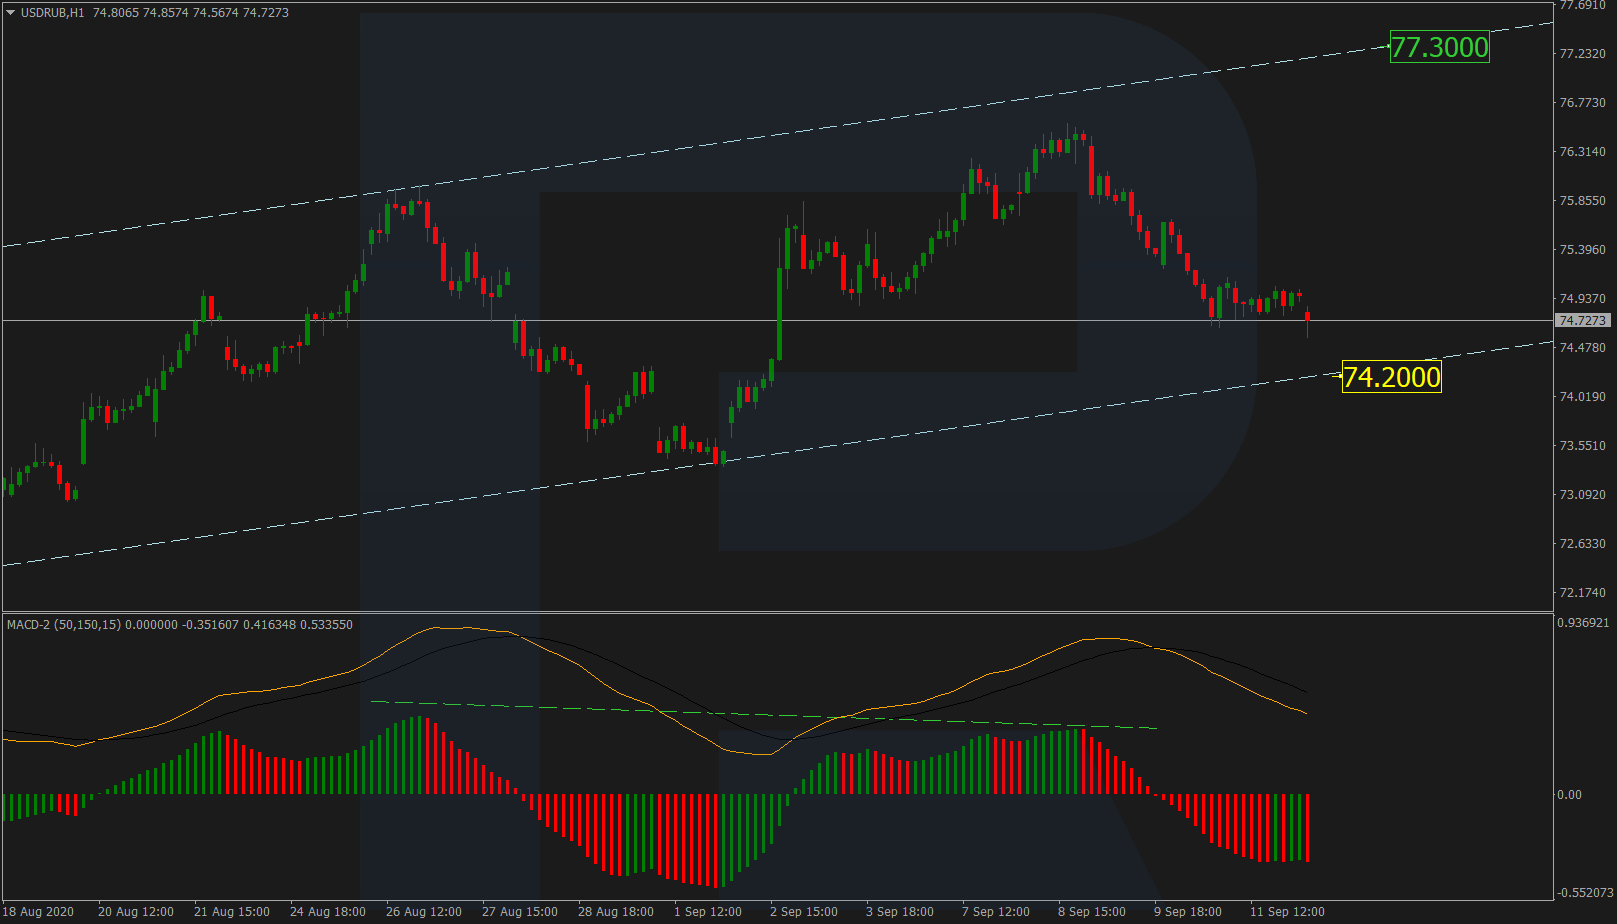
After completing a quick descending wave, USDRUB is consolidating. In the nearest future, the pair may fall towards the key support level at 74.20. This scenario is confirmed by the MACD indicator, which is directed to the downside. After testing the level, the instrument may rebound and form a new ascending wave to reach the resistance line at 77.30.

USDRUB
Risk Warning: the result of previous trading operations do not guarantee the same results in the future

USDJPY, “US Dollar vs Japanese Yen”

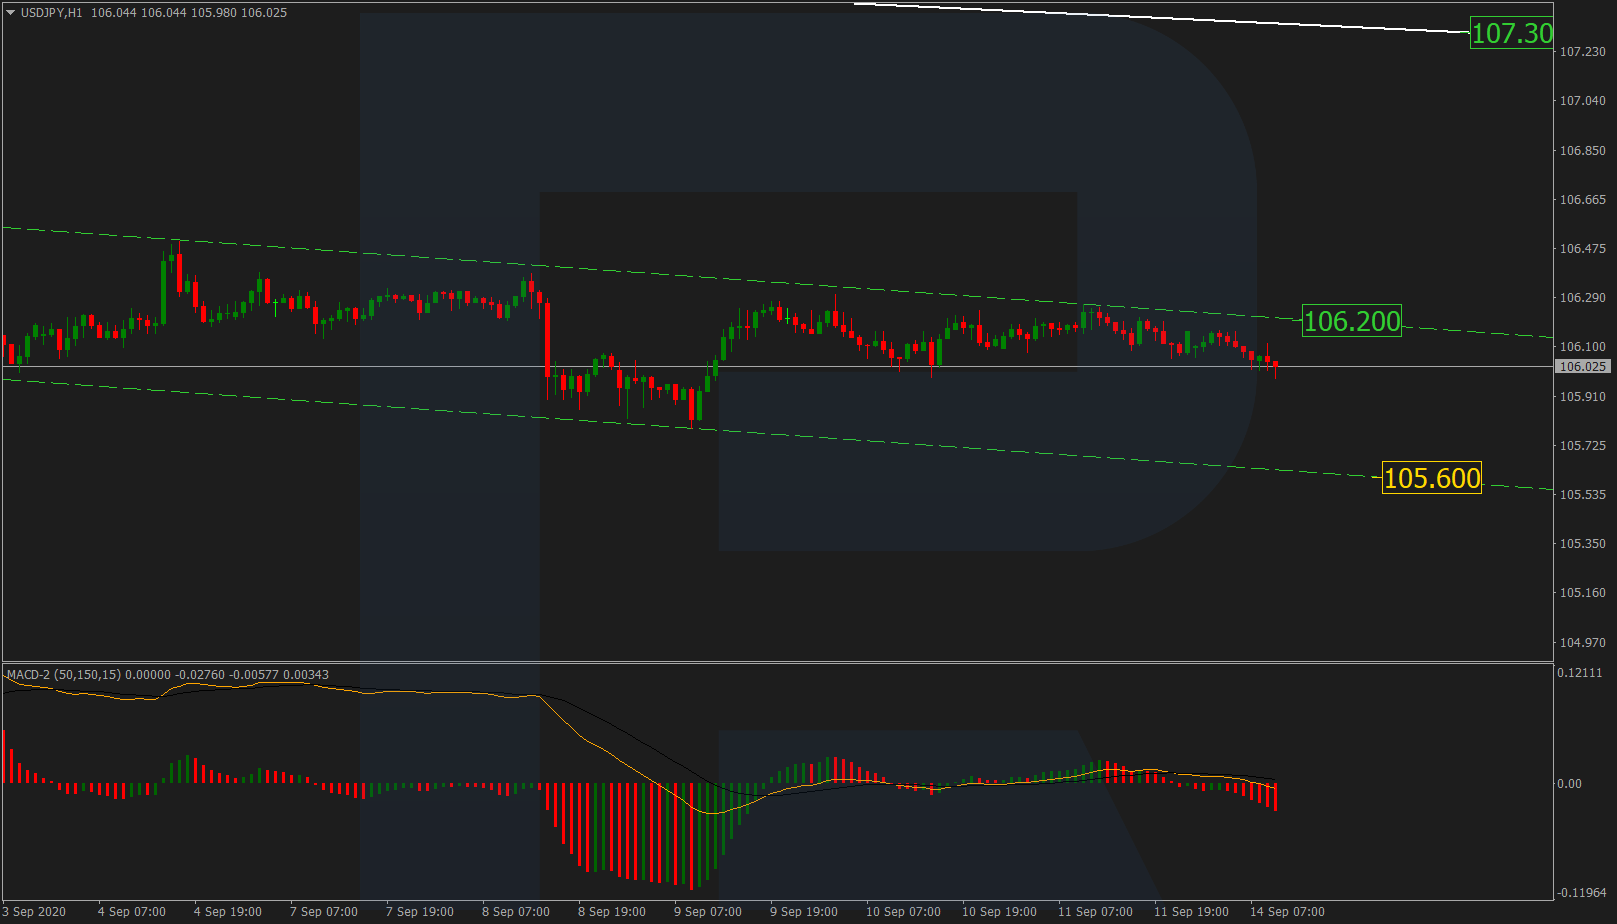
After rebounding from the descending channel’s upside border, USDJPY is moving towards the support line at 105.60. This scenario is confirmed by the MACD indicator, which is also directed to the downside. However, there might be an alternative scenario that implies a possible breakout of the resistance line at 106.20 and further growth to reach the key resistance line at 107.30.

USDJPY
Risk Warning: the result of previous trading operations do not guarantee the same results in the future

BRENT

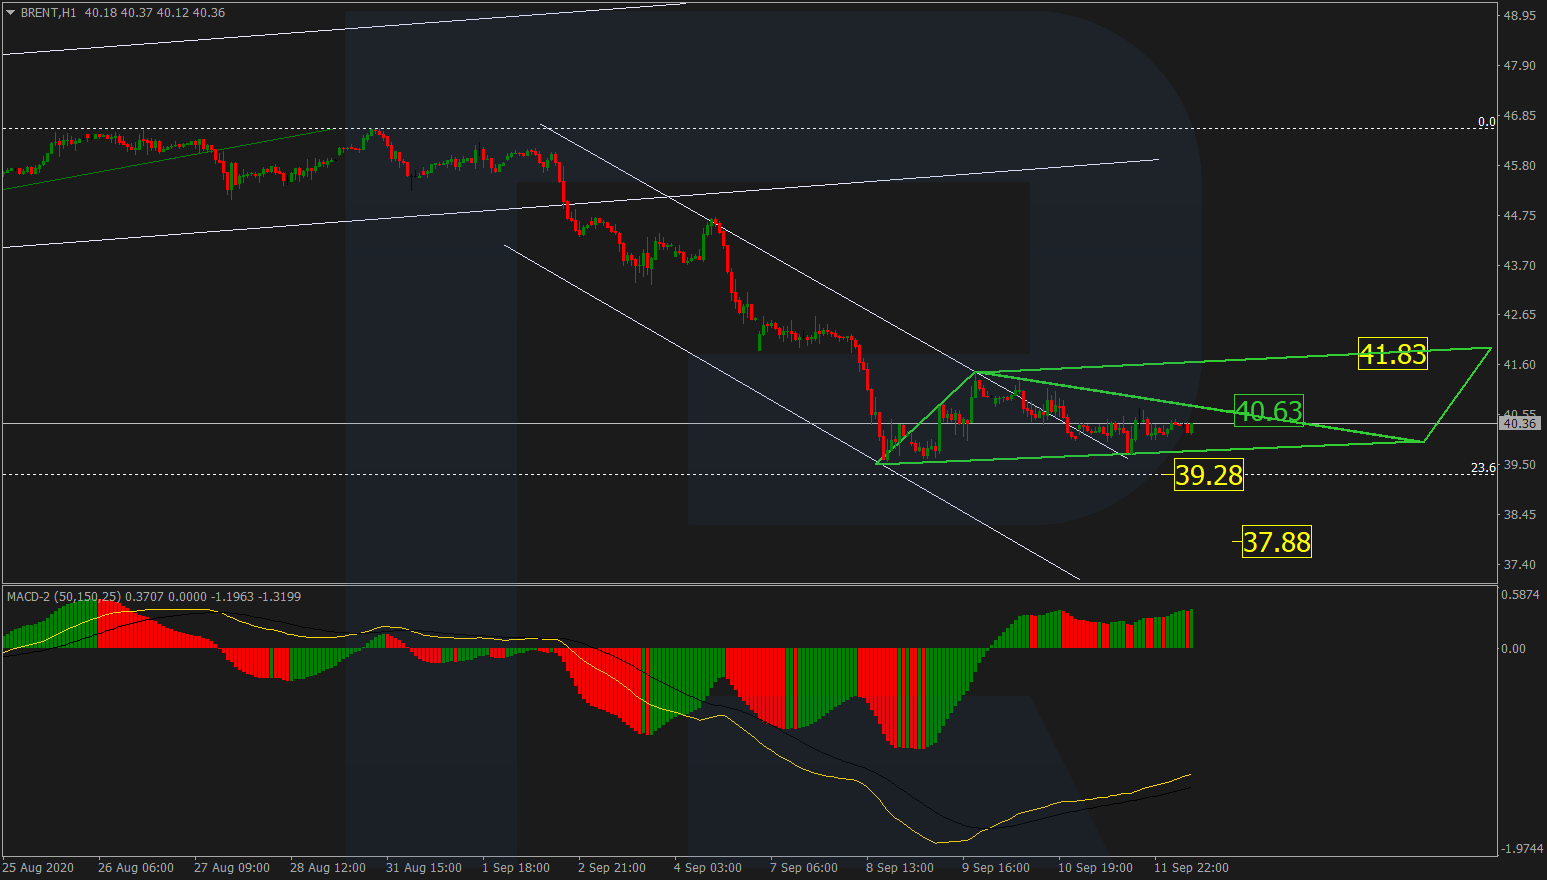
Brent is correcting within a Triangle pattern. However, judging by the MACD indicator, which is directed to the upside, the price is expected to break the resistance line at 40.63 and then expand the correctional channel up to 41.83. Still, if the pair breaks the support line at 39.70, the market may fall to break 23.6% fibo (39.28) and then reach 37.88.

BRENT
Risk Warning: the result of previous trading operations do not guarantee the same results in the future

XAUUSD, “Gold vs US Dollar”

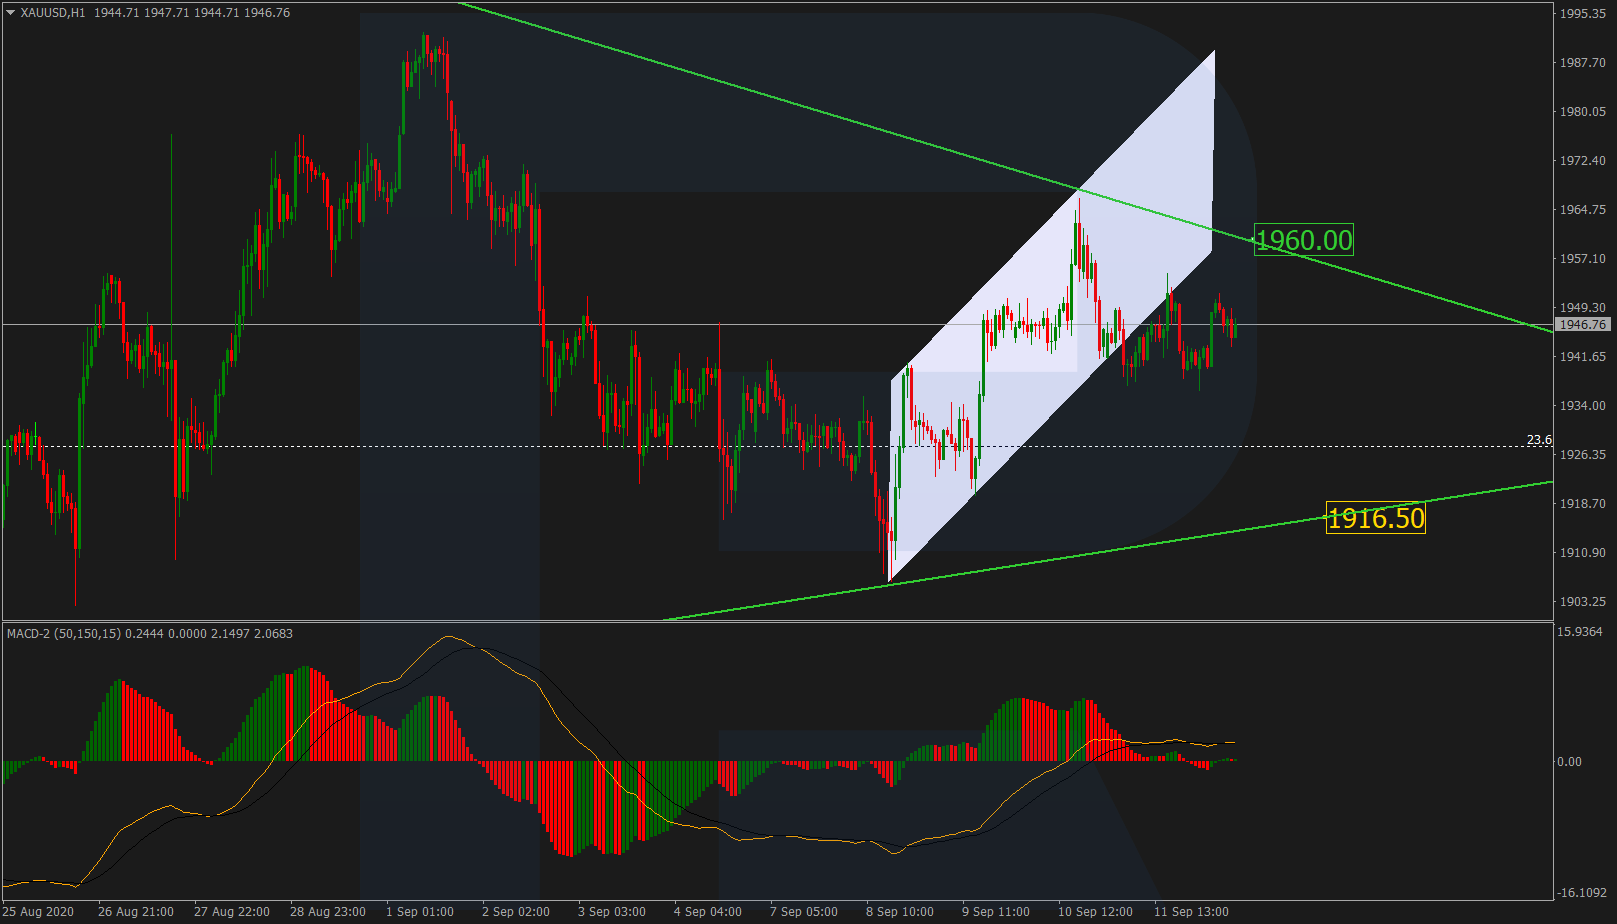
Gold is forming a mid-term triangle channel. After breaking the downside border of the previous ascending channel, the pair is moving sideways, which may be a signal for a short-term growth towards the resistance line at 1960.00. However, the key trend remains bearish, that’s why the instrument is expected to continue trading downwards with the target at 1916.50.

GOLD
Risk Warning: the result of previous trading operations do not guarantee the same results in the future

BTCUSD, “Bitcoin vs US Dollar”

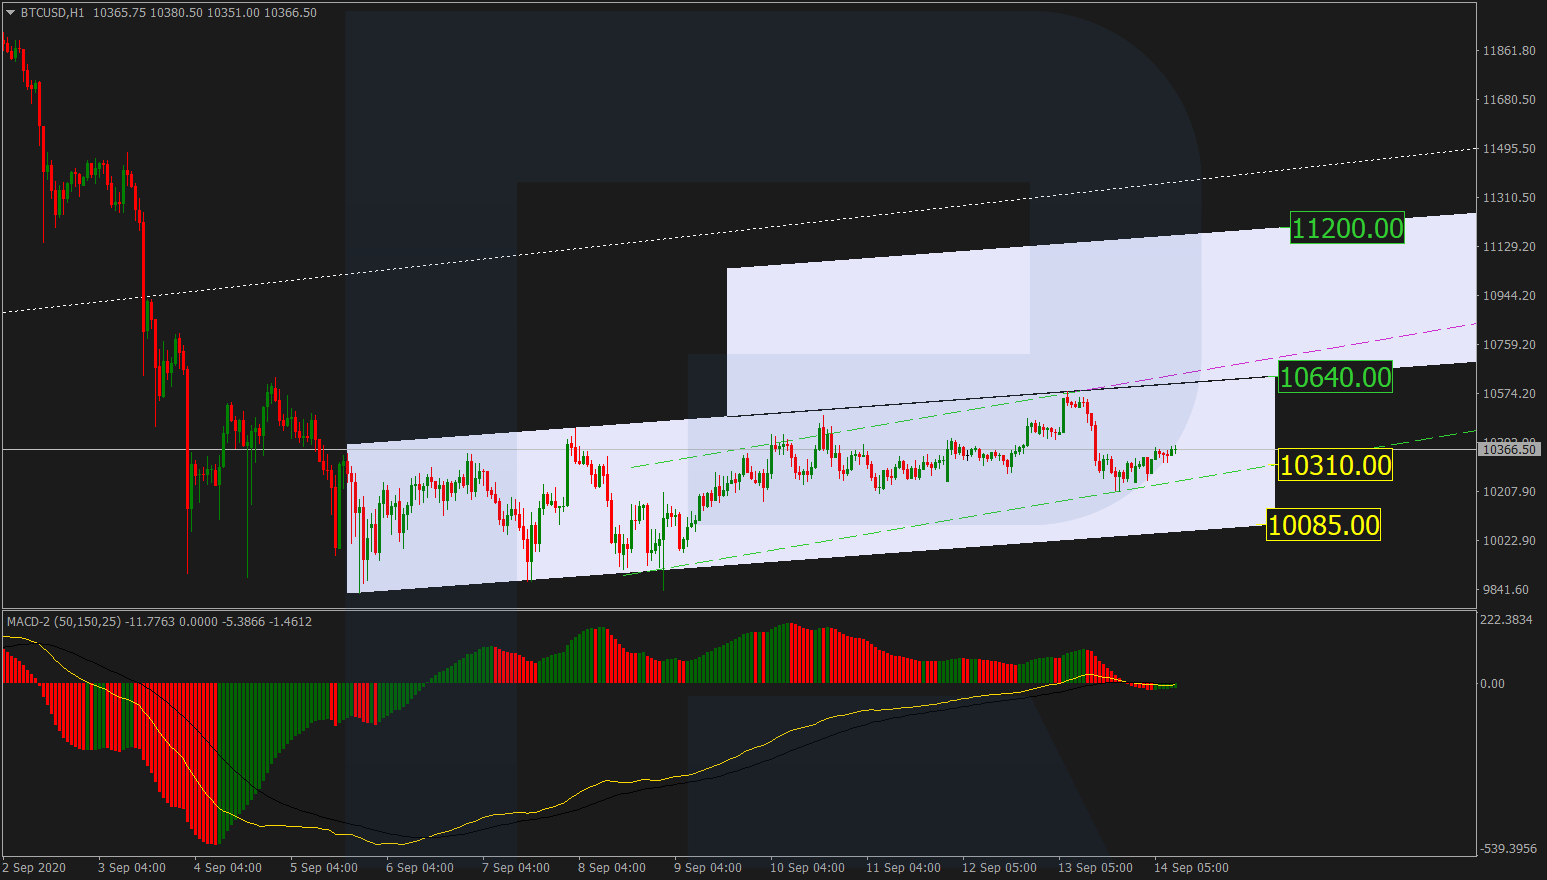
After rebounding from the support line and transforming a correctional channel into an ascending one, BTCUSD is growing towards the key resistance line at 10640.00. Later, the market may break it and continue trading upwards to reach 11200.00. However, if the price fails to break the above-mentioned resistance level and rebounds from it, the market may start a new descending structure towards the key support line at 10085.00.

BITCOIN

Article By RoboForex.com

Attention!
Forecasts presented in this section only reflect the author’s private opinion and should not be considered as guidance for trading. RoboForex LP bears no responsibility for trading results based on trading recommendations described in these analytical reviews.

The Analytical Overview of the Main Currency Pairs on 2020.09.14

by JustForex

The EUR/USD currency pair

Technical indicators of the currency pair:
  • Prev Open: 1.18103
  • Open: 1.18356
  • % chg. over the last day: -0.04
  • Day’s range: 1.18433 – 1.18552
  • 52 wk range: 1.0637 – 1.2012

There is no defined trend on the EUR/USD currency pair. This week investors will be focused on the Fed meeting, which will take place on Wednesday, September 16. The regulator is expected to keep the key interest rate unchanged at 0.25%. At the moment, the key support is the level of 1.1835, the key resistance level is 1.1870. We recommend opening positions from these levels.

The publication of economic data is not planned today. We recommend paying attention to the speech by the ECB representative Lane.

EUR/USD

Indicators point to the power of buyers: the price has fixed above 50 MA and 100 MA.

The MACD histogram is in the positive zone and above the signal line, which also gives a signal to buy EUR/USD.

Stochastic Oscillator is located near the overbought zone, the %K line has crossed the %D line. There are no accurate signals.

Trading recommendations
  • Support levels: 1.1835, 1.1800, 1.1755
  • Resistance levels: 1.1870, 1.1900, 1.1940

If the price fixes above 1.1870, EUR/USD quotes are expected to grow. The movement is tending to the round level of 1.1900.

An alternative could be a decline in the EUR/USD currency pair to 1.1800-1.1755.

The GBP/USD currency pair

Technical indicators of the currency pair:
  • Prev Open: 1.27942
  • Open: 1.27753
  • % chg. over the last day: -0.08
  • Day’s range: 1.28403 – 1.28473
  • 52 wk range: 1.1409 – 1.3516

The GBP/USD currency pair is still being traded at local lows. The British currency is under pressure since the UK may not conclude a trade agreement with the EU until the end of the transition period after Brexit. The EU has demanded Britain to urgently abandon its intentions to violate the terms of the agreement to exit from the bloc, but the government of Prime Minister Boris Johnson is pushing for a bill that could reverse all outcomes of the Brexit negotiations. At the moment, the key support and resistance levels are 1.2790 and 1.2870, respectively. Positions should be opened from these levels.

Today, the economic news feed in the UK is calm.

GBP/USD

Indicators do not give accurate signals: the price is being traded between 50 MA and 100 MA.

The MACD histogram is near the 0 mark.

Stochastic Oscillator is in the overbought zone, the %K line has crossed the %D line. There are no signals at the moment.

Trading recommendations
  • Support levels: 1.2790, 1.2750
  • Resistance levels: 1.2870, 1.2930, 1.3000

If the price fixes below 1.2790, a further drop in GBP/USD quotes is expected. The movement is tending to 1.2750-1.2730.

An alternative could be the correction of the GBP/USD currency pair to 1.2900-1.2930.

The USD/CAD currency pair

Technical indicators of the currency pair:
  • Prev Open: 1.31861
  • Open: 1.31779
  • % chg. over the last day: -0.12
  • Day’s range: 1.31568 – 1.31624
  • 52 wk range: 1.2949 – 1.4669

The USD/CAD currency pair is in a sideways trend. There is no defined trend. Investors expect additional drivers. At the moment, the key support and resistance levels are 1.3150 and 1.3190, respectively. We recommend paying attention to the dynamics of “black gold” prices. Positions should be opened from key levels.

Today, the news feed in Canada is calm.

USD/CAD

Indicators do not give accurate signals: 50 MA has crossed 100 MA.

The MACD histogram is near the zero mark. There are no accurate signals.

Stochastic Oscillator is in the neutral zone, the %K line is above the %D line, which gives a signal to buy USD/CAD.

Trading recommendations
  • Support levels: 1.3150, 1.3110, 1.3070
  • Resistance levels: 1.3190, 1.3230, 1.3265

If the price fixes below 1.3150, USD/CAD quotes are expected to fall. The movement is tending to 1.3110-1.3090.

An alternative could be the growth of the USD/CAD currency pair to 1.3230-1.3250.

The USD/JPY currency pair

Technical indicators of the currency pair:
  • Prev Open: 106.169
  • Open: 106.066
  • % chg. over the last day: +0.01
  • Day’s range: 105.907 – 105.989
  • 52 wk range: 101.19 – 112.41

During today’s trading session, the USD/JPY currency pair has been declining. Investors expect Japan’s Liberal Democratic Party to elect its Chairman today, who will become the country’s Prime Minister. The key candidate for this post is Yoshihide Suga, Japan Chief Cabinet Secretary. At the moment, the local support and resistance levels are: 105.90 and 106.25, respectively. Positions should be opened from key support and resistance levels.

The publication of major economic news from Japan is not expected today.

USD/JPY

Indicators point to the power of sellers: the price is being traded below 50 MA and 100 MA.

The MACD histogram is in the negative zone and below the signal line, which also gives a signal to sell USD/JPY.

Stochastic Oscillator is in the neutral zone, the %K line has crossed the %D line. There are no signals.

Trading recommendations
  • Support levels: 105.90, 105.60
  • Resistance levels: 106.25, 106.50, 106.90

If the price fixes below 105.90, USD/JPY quotes are expected to decline. The movement is tending to 105.60-105.40.

An alternative could be the correction of the USD/JPY currency pair to 106.50-106.70.

by JustForex


This article reflects a personal opinion and should not be interpreted as an investment advice, and/or offer, and/or a persistent request for carrying out financial transactions, and/or a guarantee, and/or a forecast of future events.

A not-so-happy birthday for OPEC

By Han Tan, Market Analyst, ForexTime

On 14th September 1960, OPEC was born in Baghdad, aiming to “co-ordinate and unify petroleum policies among Member Countries”. 60 years later, the alliance is being strained by a global pandemic.

OPEC’s birthday week holds key events that could influence the near-term performance of Oil prices. Later today, OPEC is set to release its Monthly Oil Market Report, complete with its outlook on global demand and output. Then on Thursday, the OPEC+ Joint Ministerial Monitoring Committee is scheduled to meet and discuss the efficacy of its supply cuts, while assessing the level of compliance among members.

Recall that back in April, OPEC+ agreed to an unprecedented supply cuts deal, shaving off 9.7 million barrels per day (bdp) from its collective output, only to then ease off by about two million bpd starting last month in hopes that global demand will stage a sustained recovery.

However, things haven’t quite panned out as they hoped.


Both Crude and Brent are coming off back-to-back weekly drops for the first time since April. On a month-to-date basis, Brent and WTI futures have fallen by over 12 percent respectively, leaving both to be ‘scooped up’ by their 100-day simple moving averages. Both these instruments are also trying to claw themselves out of the ‘oversold’ domain, judging by their respective 14-day relative strength indices having dipped into sub-30 levels recently. At the time of writing, Brent and WTI futures are about 35 percent lower so far in 2020.

The slide in Oil prices comes amid signs that the global demand recovery appears to have stalled. Diesel stockpiles in Singapore are at their highest since 2011, while Saudi Arabia, Iraq, and other Gulf producers have slashed the pricing on their respective crude grades to the US and Asia. Oil supermajor, BP, recently cited the risk that global demand may never recover to pre-pandemic levels, while traders are buying up tankers in case they need to hold crude supplies for months. According to CFTC data, short-selling on Oil has risen to its highest levels since the historic crash in April this year, when WTI futures were sent into negative territory.

This week, investors will be monitoring how much sway the alliance could still have over global markets, even as these major Oil-producing nations aim to shore up prices. While its 60th birthday celebrations had to be put on hold due to Covid-19 restrictions, OPEC may not be able to hold off further intervention for much longer if Oil prices keep unwinding more of its recovery from the past five months.


Disclaimer: The content in this article comprises personal opinions and should not be construed as containing personal and/or other investment advice and/or an offer of and/or solicitation for any transactions in financial instruments and/or a guarantee and/or prediction of future performance. ForexTime (FXTM), its affiliates, agents, directors, officers or employees do not guarantee the accuracy, validity, timeliness or completeness, of any information or data made available and assume no liability as to any loss arising from any investment based on the same.


Forex-Time-LogoArticle by ForexTime

ForexTime Ltd (FXTM) is an award winning international online forex broker regulated by CySEC 185/12 www.forextime.com

This week in monetary policy: Poland, Armenia, Georgia, USA, Brazil, Japan, Taiwan, Indonesia, UK, South Africa, Russia, Azerbaijan & Mongolia

By CentralBankNews.info

This week – September 14 through September 19 – central banks from 13 countries or jurisdictions are scheduled to decide on monetary policy: Poland, Armenia, Georgia, United States of America, Brazil, Japan, Taiwan, Indonesia, United Kingdom, South Africa, Russia, Azerbaijan and Mongolia.

This week also features the OECD’s latest interim economic outlook on Sept. 16, with a summary on the OECD website at 09:00 GMT.
Following table includes the name of the country, the date of the next policy decision, the current policy rate, the result of the last policy decision, the change in the policy rate year to date, and the rate one year ago.
The table is updated when the latest decisions are announced and can always accessed by clicking on This Week.

WEEK 38SEP 14 – SEP 19, 2020:

POLAND15-Sep0.10%0-1401.50%         EM
ARMENIA15-Sep4.50%0-1005.50%
GEORGIA16-Sep8.00%-25-1007.50%
UNITED STATES16-Sep0.25%0-1502.00%         DM
BRAZIL16-Sep2.00%-25-2505.50%         EM
JAPAN17-Sep0.10%000.10%         DM
TAIWAN17-Sep1.125%0-251.375%         EM
INDONESIA17-Sep4.00%0-1005.25%         EM
UNITED KINGDOM17-Sep0.10%0-650.75%         DM
SOUTH AFRICA17-Sep3.50%-25-3006.50%         EM
RUSSIA18-Sep4.25%-25-2007.00%         EM
AZERBAIJAN18-Sep6.75%-25-758.00%
MONGOLIA18-Sep9.00%0-20011.00%


www.CentralBankNews.info

DAX30 outlook depends on US tech sector – below 13,000 or stint towards 13,450?

By Admiral Markets

Economic Events September 14

Source: Economic Events September 14 , 2020 – Admiral Markets’ Forex Calendar

The DAX30 presented itself initially as quite strong after the ECB last week on Thursday, which was a little surprising given the fact that the ECB didn’t deliver anything new. They kept rates unchanged, while the rhetoric within the ECB statement suggested no clear tendency towards more stimulus to be decided on in the ECB meeting in December.

What became clear was that the German index and its performance currently heavily depends on US Equities, especially the Nasdaq100.

We consider the DAX30 bullish on H1. However, here are some key points to consider:

  • As long as we trade above 13,100 points, there will be the potential of seeing another attempt to break above 13,300 points into the start of the week
  • This could level the path up to the September highs around 13,450 points
  • Any Nasdaq100 weakness and break below 11,000 points would likely bring the DAX under pressure again and make a drop below 13,000 points likely
  • Even a drop back below 13,000 points wouldn’t necessarily be bearish, at least not initially

In fact, we consider the German DAX30, short-term and on H1, bullish as long as we trade above 13,100 points (region around the Thursday lows) and neutral as long as the DAX30 trades above 12,750 points, the current September lows:

DAX30 CFD Hourly chart

Source: Admiral Markets MT5 with MT5SE Add-on DAX30 CFD Hourly chart (between August 24, 2020, to September 11, 2020). Accessed: September 11, 2020, at 10:00 PM GMT

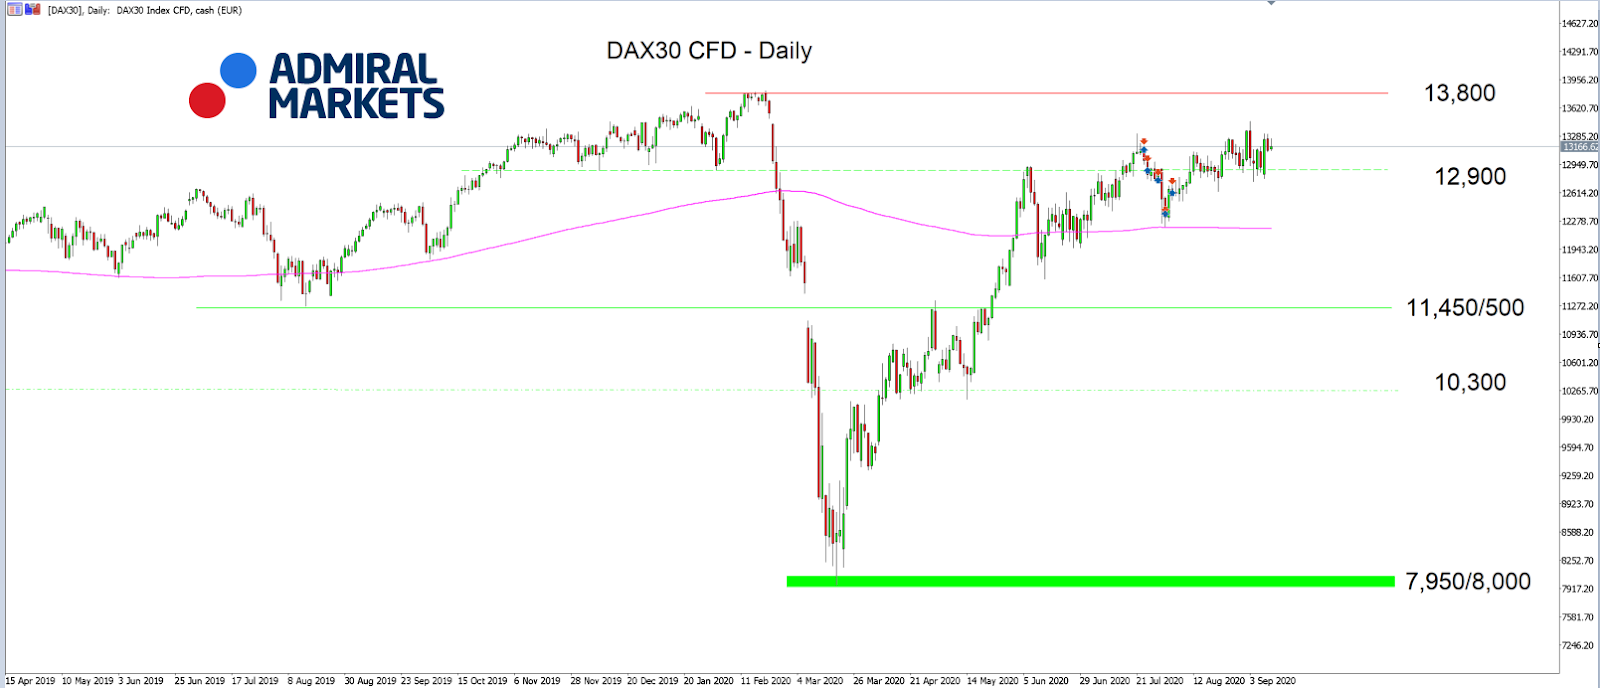
DAX30 CFD Daily chart

Source: Admiral Markets MT5 with MT5SE Add-on DAX30 CFD Daily chart (between April 15, 2019, to September 11, 2020). Accessed: September 11, 2020, at 10:00 PM GMT – Please note: Past performance is not a reliable indicator of future results, or future performance.

In 2015, the value of the DAX30 CFD increased by 9.56%, in 2016 it increased by 6.87%, in 2017 it increased by 12.51%, in 2018 it fell by 18.26%, and in 2019 it increased by 26.44%, meaning that in five years, it was up by 34.2%.

Check out Admiral Markets’ most competitive conditions on the DAX30 CFD and start trading on the DAX30 CFD with a low 0.8 point spread offering during the main Xetra trading hours.

Download MetaTrader 5 Supreme Edition

Disclaimer: The given data provides additional information regarding all analysis, estimates, prognosis, forecasts or other similar assessments or information (hereinafter “Analysis”) published on the website of Admiral Markets. Before making any investment decisions please pay close attention to the following:

  1. This is a marketing communication. The analysis is published for informative purposes only and is in no way to be construed as investment advice or recommendation. It has not been prepared in accordance with legal requirements designed to promote the independence of investment research, and that it is not subject to any prohibition on dealing ahead of the dissemination of investment research.
  2. Any investment decision is made by each client alone whereas Admiral Markets shall not be responsible for any loss or damage arising from any such decision, whether or not based on the Analysis.
  3. Each of the Analysis is prepared by an independent analyst (Jens Klatt, Professional Trader and Analyst, hereinafter “Author”) based on the Author’s personal estimations.
  4. To ensure that the interests of the clients would be protected and objectivity of the Analysis would not be damaged Admiral Markets has established relevant internal procedures for prevention and management of conflicts of interest.
  5. Whilst every reasonable effort is taken to ensure that all sources of the Analysis are reliable and that all information is presented, as much as possible, in an understandable, timely, precise and complete manner, Admiral Markets does not guarantee the accuracy or completeness of any information contained within the Analysis. The presented figures that refer to any past performance is not a reliable indicator of future results.
  6. The contents of the Analysis should not be construed as an express or implied promise, guarantee or implication by Admiral Markets that the client shall profit from the strategies therein or that losses in connection therewith may or shall be limited.
  7. Any kind of previous or modeled performance of financial instruments indicated within the Publication should not be construed as an express or implied promise, guarantee or implication by Admiral Markets for any future performance. The value of the financial instrument may both increase and decrease and the preservation of the asset value is not guaranteed.
  8. The projections included in the Analysis may be subject to additional fees, taxes or other charges, depending on the subject of the Publication. The price list applicable to the services provided by Admiral Markets is publicly available from the website of Admiral Markets.
  9. Leveraged products (including contracts for difference) are speculative in nature and may result in losses or profit. Before you start trading, you should make sure that you understand all the risks.

By Admiral Markets

Risk assets push higher on vaccine hopes; eyes on the Fed

By Hussein Sayed, Chief Market Strategist (Gulf & MENA), ForexTime

After two consecutive weeks of back-to-back declines, global stocks kicked off Monday with solid gains amid a surge in M&A activity and positive signs towards vaccine developments. Currency markets were little changed ahead of a busy week of monetary policy announcements, while Oil and Gold ticked slightly higher.

The two big deals announced over the weekend were Softbank’s plan to sell chipmaker ARM to Nvidia for more than $40 billion and Gilead Sciences to acquire Immunomedics for a price tag of $21 billion. Meanwhile, on the vaccine front, AstraZeneca resumed its phase-3 trial on Covid-19 after being suspended last week following a neurological illness developed in one participant, and Pfizer announced that its vaccine could be distributed before year-end if found safe and effective.

Central Banks will take centre stage this week with the Federal Reserve, Bank of England and Bank of Japan all due to announce policy decisions. Out of the three meetings, the Fed is likely to be the most watched following its historic shift towards average inflation targeting. The big question remains how will the FOMC put this policy into action?

From what we know now, the Fed is set up to keep interest rates near zero for a long time, possibly for several years. Given the new framework, any spike in inflation won’t translate into immediate rate hikes as the Fed wants to compensate for the lost years when they have failed to hit the target. The dot plot will be the key guide for investors and traders alike. If inflation projections remain at 2% or below for the foreseeable future, this will solidify market expectations for a low rate environment for many years to come. That said, Jay Powell would still have to explain in more detail how the new framework will be translated into policy action.

In June’s economic projections, the Fed anticipated unemployment would be at 9.3% by year-end, but, in August, unemployment was well below that forecast at 8.4%. Many other economic data surprised to the upside during the June – August period in a clear sign that most economists were overly pessimistic towards the strength of the recovery. However, there is still a considerable amount of uncertainty given the latest surge in Covid-19 cases worldwide and the US, especially as we get closer into the winter season. A second wave will undoubtedly put the recovery at risk in the final quarter of the year and it will be interesting to see the Fed’s view on that issue.

As for the market selloff over the past two weeks, the Fed isn’t likely to show any signs of concern. In fact, policymakers should be satisfied with the pullback as the risk of a bubble in several assets has been growing due to the Fed’s extremely accommodative policies. Unless we see another 10 -15% drop, do not expect the Fed to intervene.

Disclaimer: The content in this article comprises personal opinions and should not be construed as containing personal and/or other investment advice and/or an offer of and/or solicitation for any transactions in financial instruments and/or a guarantee and/or prediction of future performance. ForexTime (FXTM), its affiliates, agents, directors, officers or employees do not guarantee the accuracy, validity, timeliness or completeness, of any information or data made available and assume no liability as to any loss arising from any investment based on the same.


Forex-Time-LogoArticle by ForexTime

ForexTime Ltd (FXTM) is an award winning international online forex broker regulated by CySEC 185/12 www.forextime.com