Belize City, Belize, Sept. 29, 2020 — RoboForex, a company that provides brokerage services on global financial markets, was presented with the “Most Transparent Asian Forex Broker” award within the frameworks of “Global Forex Awards 2020 – Retail”.
Global Forex Awards organizers bestow honorary titles to the companies that demonstrate outstanding results in the area of providing services on the Forex market. By means of open voting, they choose more than 20 laureates on global and regional levels, each of which is nominated according to a territorial basis: Asia, Africa, the Middle East, or Europe.
“Global Forex Awards – Retail” are presented to the most successful forex companies and brands on a global and regional scale – the ones that implement cutting-edge technologies, provide the best trading conditions, use complex market research tools, offer “advanced” educational programs, and deliver services of worldwide standards.
Denis Golomedov, Chief Marketing Officer at RoboForex: “We’re very pleased to get an award in the “Most Transparent Asian Forex Broker” category. Being an international company, RoboForex particularly appreciates regional acknowledgment – it means that our clients recognized our efforts and the strategy we’ve chosen is right. This award is another motivation to become the best broker in each category”.
About RoboForex
RoboForex is a company, which delivers brokerage services. The company provides traders, who work on financial markets, with access to its proprietary trading platforms. RoboForex Ltd has the brokerage license IFSC 000138/107. More detailed information about the Company’s products and activities can be found on the official website at www.roboforex.com.
The end-of-the-month rebound in global equities is fading as investors assess a scaled-back fiscal proposal in the US against the rising toll of the pandemic. US equity futures are pointing to losses just after the open after Monday’s rally, while banks are again leading broad-based declines in European bourses. For sure, if the two US parties can agree on more stimulus, it may be the trigger for shifting the recent risk headwind into a tailwind. But the chances of an agreement with the current Administration still look slim. Is this a political gambit ahead of the election?
King Dollar has retained a soft undertone on the day as traders fade recent gains and look to pick up ‘cheap’ looking higher yielding currencies, with AUD and NZD outperforming. Markets still hold a large overall short position in USD and even though the recent rally in the buck was probably helped by some short trimming, active traders have slightly surprisingly been adding even more USD shorts.
The razzmatazz of two octogenarians facing off on television will grab all the headlines overnight. Will the Trump vs Biden showdown beat the record 84 million viewers who watched Trump vs Clinton in their first televised debate? What matters most in the end for markets is not really the two protagonists, but more whether we get one party taking a majority over both the Senate and the House. This will determine if we get a fiscal boost or not, though there’s no doubt you should grab the popcorn and some caffeine if you want to see some eye-rolling, cringeworthy TV gold from 2am GMT!
How much more can USD rebound?
While the TV debate may or may not be a turning point in the electoral campaign, it could give us a small indication of the market’s reaction to any perceived advantage of one candidate over the other. A contested outcome, which betting markets are moving closer towards, may keep the Dollar’s upside capped in the run-up to the November election day, although if Trump’s chances of re-election are rising, this is forecast to be a USD-positive event.
The monthly DXY chart will probably show a bullish outside range September with prices supported by the 100-month Moving Average. Prices are no hovering around the bullish trendline from the April 2011 lows, but have been capped on the daily chart by the lows from March this year.
Disclaimer: The content in this article comprises personal opinions and should not be construed as containing personal and/or other investment advice and/or an offer of and/or solicitation for any transactions in financial instruments and/or a guarantee and/or prediction of future performance. ForexTime (FXTM), its affiliates, agents, directors, officers or employees do not guarantee the accuracy, validity, timeliness or completeness, of any information or data made available and assume no liability as to any loss arising from any investment based on the same.
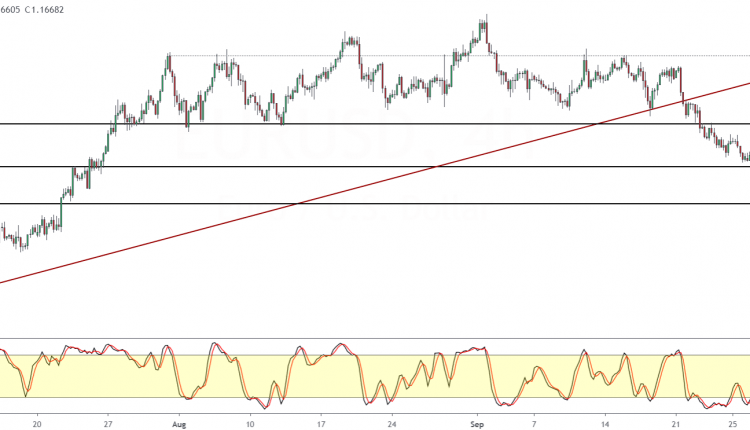
The euro is attempting to erase gains from last Friday in what could be a near term correction.
After losing the 1.1900 handle, the EURUSD has been steadily posting a decline.
Price action is somewhat stable, close to the 1.1600 level of support.
The current rebound could see the EURUSD attempting to test the 1.1715 handle. If resistance forms here, we expect to see price eventually breaking down past the 1.1600 level.
Alternatively, a close above the 1.17150 level could potentially see the bullish momentum resuming, putting the EURUSD on track to test the 1.1900 level next.
GBPUSD Rises Amid Brexit Talks
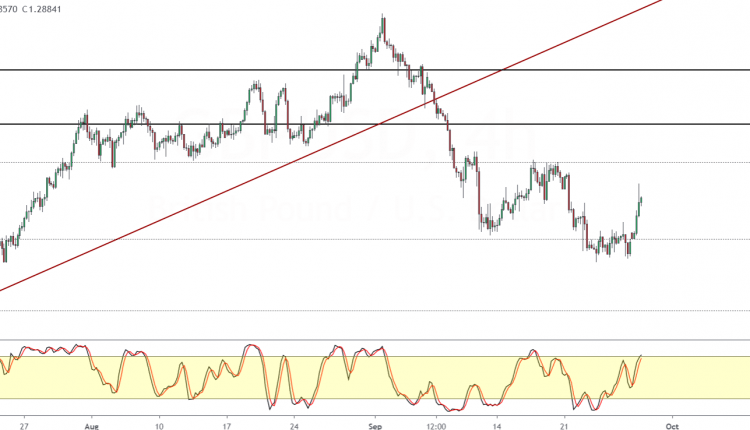
The British pound sterling is trading stronger on Monday as price action managed to post a recovery.
This comes after cable-stayed flat since Wednesday last week.
The bullish follow-through after Friday’s doji candlestick pattern suggests some near term upside.
The key level for GBPUSD will be the 1.3000 handle.
A close above 1.3000 could open the way for price to rise to the 1.3035 level next.
In the medium term, we expect GBPUSD to hold steady within the 1.3000 level and the current lows near 1.2700.
Oil Prices Hold Steady Below 41
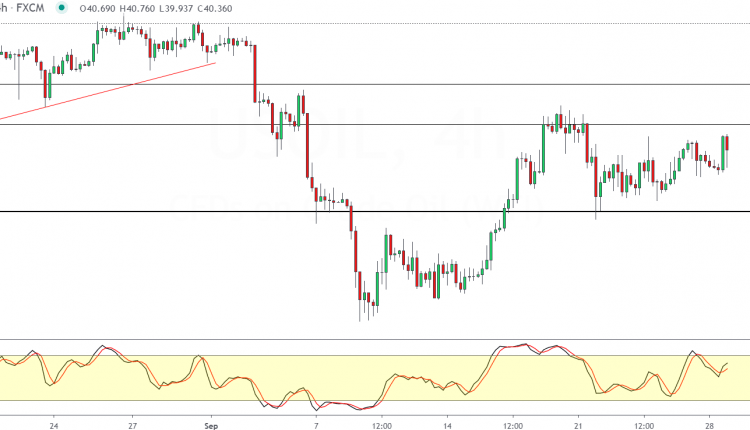
WTI crude oil prices continue to trade mixed with price action holding steady below the 41.00 level of resistance.
Monday’s price action marks the fifth session where oil prices have been trading in a range, within the high and lows from last Monday.
A breakout from this range could see the larger sideways range giving way to a stronger trend.
For the moment, watch how the price action unfolds as WTI crude oil approaches the 41.00 level.
Above this level, the 42.00 level will be the next crucial resistance level to break.
As a result, we could expect this sideways range to continue in the near term. There is also a risk that prices could fall back to the 38.83 level, given that the lower support area was not fully tested.
Gold Likely To Trade Flat For 3rd Consecutive Session
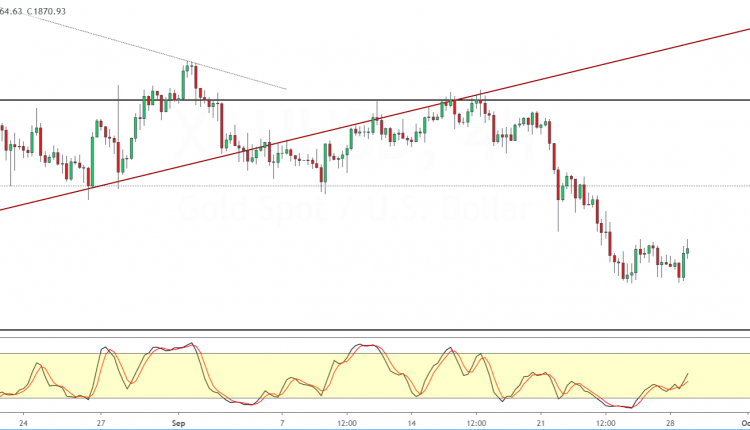
The precious metal is caught in a sideways range right after prices fell sharply last week to a two-month low.
Gold prices are currently steady with price action holding up above the 1850 level of support.
The near-term consolidation could lead the way to price making a correction to the upside.
This could see gold prices testing the 1900 -1911 region once again.
As long as resistance holds near this level, we could expect this sideways range to hold in the near term.
However, the bias will shift to the upside if gold manages to break past the 1900 threshold once again.
Meanwhile, the descending triangle pattern continues to hold for the moment, putting the downside target toward the 1750 level of support.
Preparing for the publication of the significant statistics
An upward movement signifies the weakening of the Japanese yen against the US dollar. This week, Japan will release various economic indicators every day. Tokyo Core CPI for September will be released on Tuesday, Retail Sales, Housing Starts and Industrial Production for August – on Wednesday, Tankan Large Manufacturers Index (indicator of industrial activity) for the 3rd quarter – on Thursday, Unemployment Rate (unemployment) for August and Consumer Confidence (indicator of consumer confidence) for September – on Friday. Most preliminary forecasts are weak, which could negatively affect the yen. Non-Farm Payrolls publication on Friday may become the main economic event of the week in the United States.
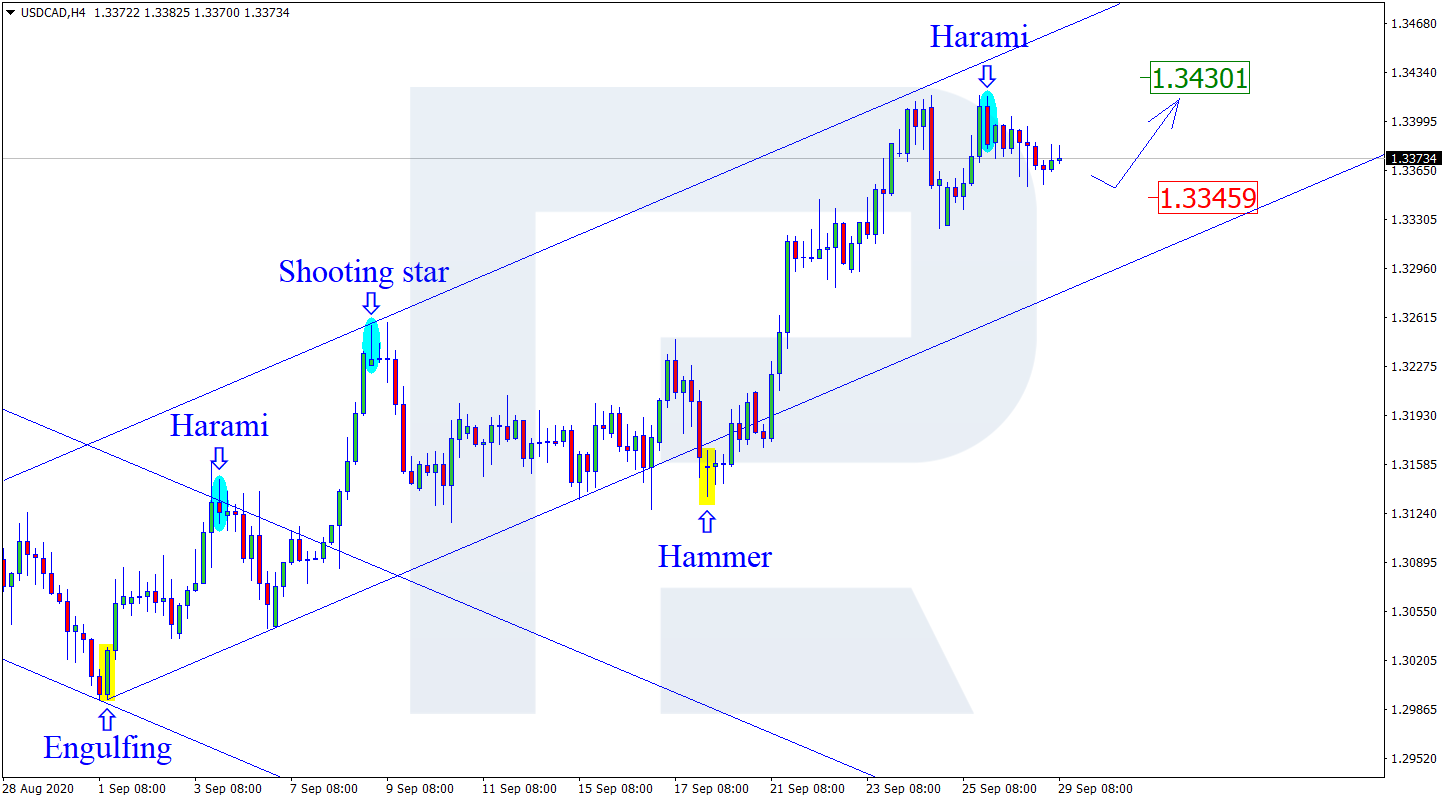
As we can see in the H4 chart, the rising tendency continues. By now, after testing the resistance area and forming several reversal patterns, such as Harami, USDCAD has reversed to form a slight correction. The upside target may be at 1.3430. However, an alternative scenario implies that the instrument may fall and correct towards 1.3345.
AUDUSD, “Australian Dollar vs US Dollar”
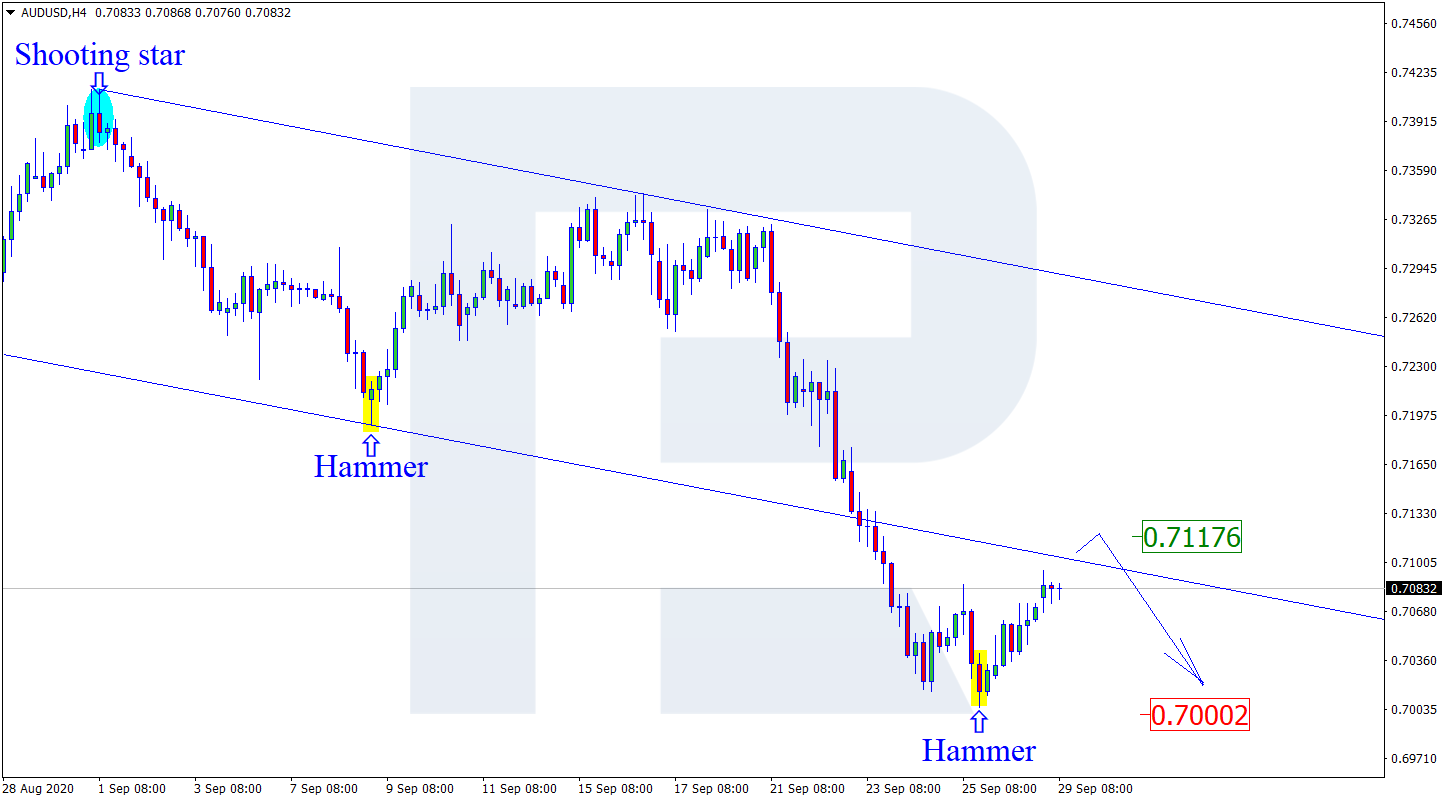
As we can see in the H4 chart, the correction within the downtrend continues. Right now, after forming a Hammer pattern, AUDUSD is reversing. The next upside target may be at 0.7117. Later, the price may test this level and resume trading downwards. In this case, the downside target may be at 0.7000.
USDCHF, “US Dollar vs Swiss Franc”
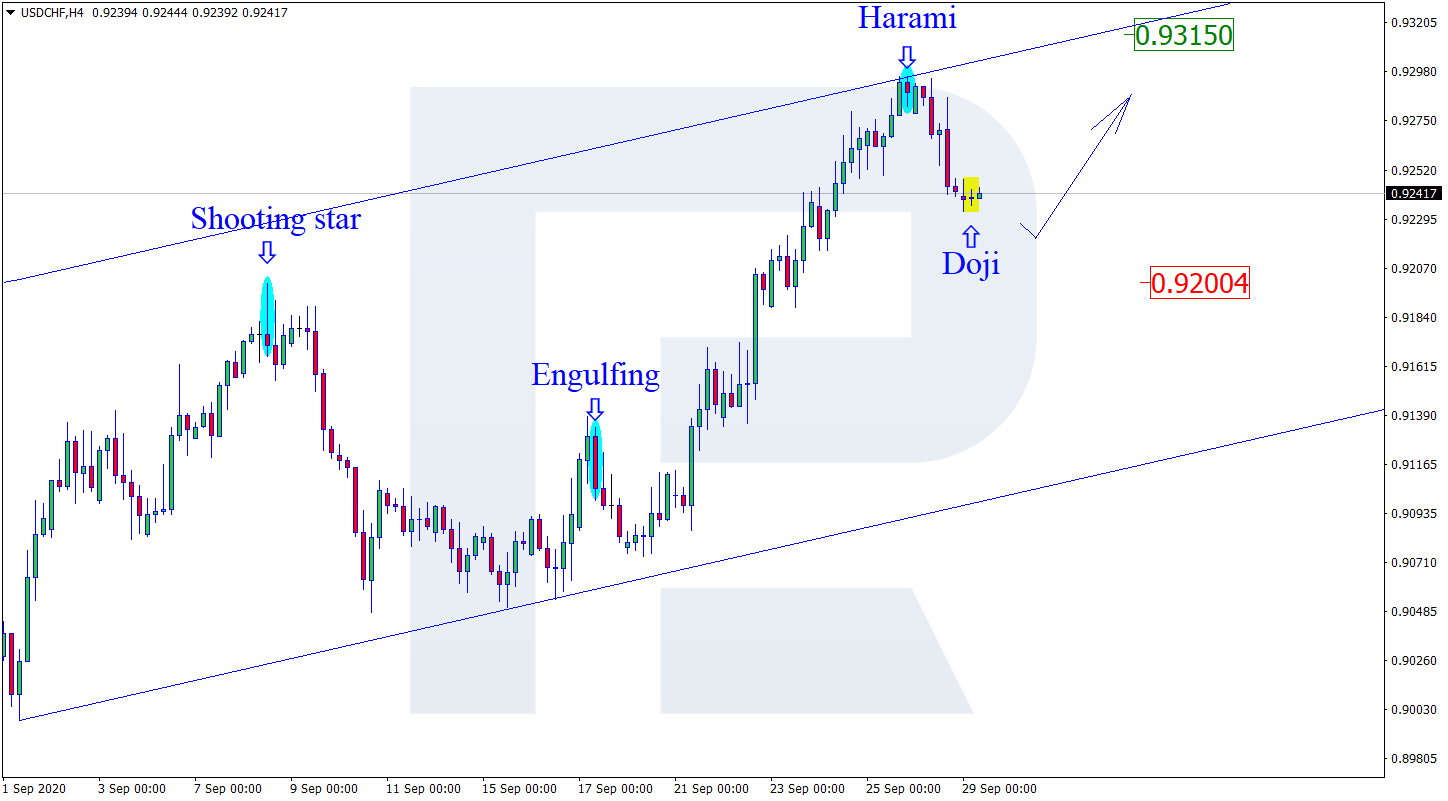
As we can see in the H4 chart, the pair is finishing the correction within the ascending tendency. By now, after forming several reversal patterns, such as Doji, not far from the support level, USDCHF is expected to reverse and continue growing. In this case, the upside target may be at 0.9315. Still, there might be an alternative scenario, according to which the asset may correct towards 0.9200 before resuming the downtrend.
Attention! Forecasts presented in this section only reflect the author’s private opinion and should not be considered as guidance for trading. RoboForex LP bears no responsibility for trading results based on trading recommendations described in these analytical reviews.
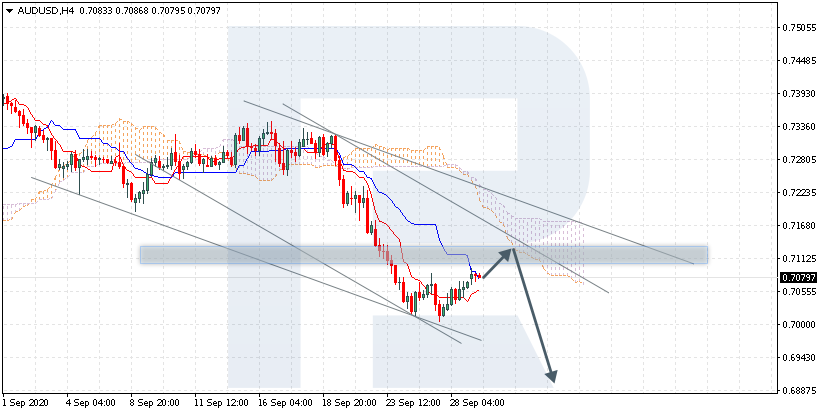
AUDUSD is trading at 0.7079; the instrument is moving below Ichimoku Cloud, thus indicating a descending tendency. The markets could indicate that the price may test the cloud’s downside border at 0.7115 and then resume moving downwards to reach 0.6890. Another signal in favor of further downtrend will be a rebound from the resistance level. However, the bearish scenario may no longer be valid if the price breaks the cloud’s upside border and fixes above 0.7230. In this case, the pair may continue growing towards 0.7315.
BRENT
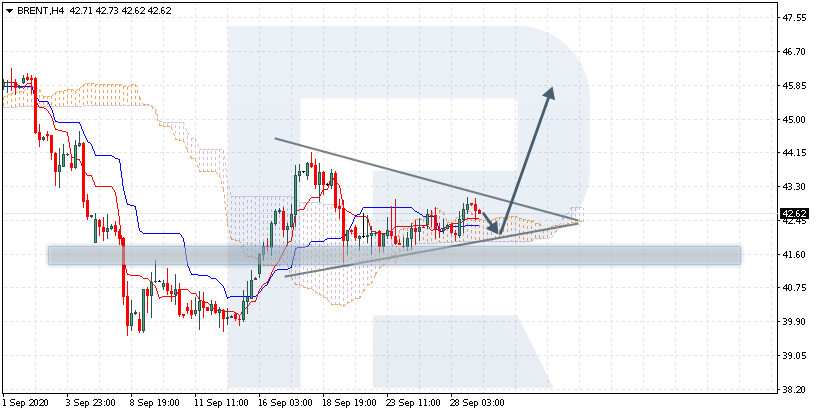
Brent is trading at 42.62; the instrument is moving above Ichimoku Cloud, thus indicating an ascending tendency. The markets could indicate that the price may test at the cloud’s downside border 41.95 and then resume moving upwards to reach 45.85. Another signal in favor of further uptrend will be a rebound from the downside border of the Triangle pattern. However, the bullish scenario may no longer be valid if the price breaks the cloud’s downside border and fixes below 41.05. In this case, the pair may continue falling towards 39.25. To confirm further growth, the asset must break the pattern’s upside border and fix above 43.65.
USDCHF, “US Dollar vs Swiss Franc”
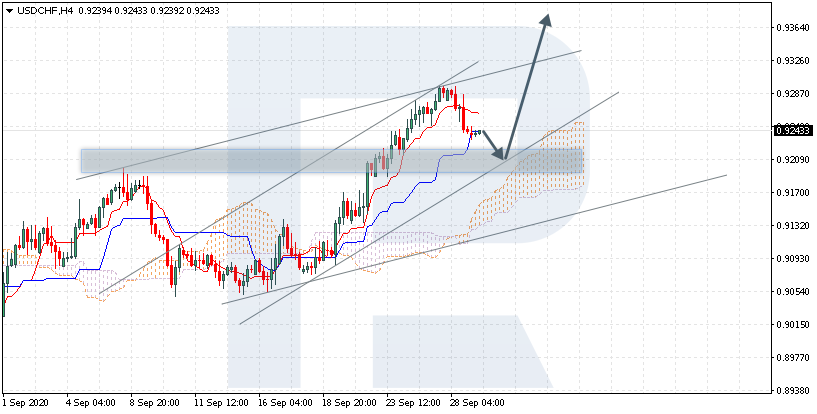
USDCHF is trading at 0.9243; the instrument is moving above Ichimoku Cloud, thus indicating an ascending tendency. The markets could indicate that the price may test Tenkan-Sen and Kijun-Sen at 0.9210 and then resume moving upwards to reach 0.9375. Another signal in favor of further uptrend will be a rebound from the rising channel’s downside border. However, the bullish scenario may no longer be valid if the price breaks the cloud’s downside border and fixes below 0.9125. In this case, the pair may continue falling towards 0.9035.
Attention! Forecasts presented in this section only reflect the author’s private opinion and should not be considered as guidance for trading. RoboForex LP bears no responsibility for trading results based on trading recommendations described in these analytical reviews.
– This second part of our research post on super-cycles and precious metals will present our expectations going forward for 6 to 24+ months. In Part I of this research post, I linked a number of our previous research articles we recommended to readers to review for context and continuity. If you have not read Part I of this research article, please take a minute to review that first segment before you continue reading this second segment of our research.
TECHNICAL CYCLES & MORE
There is a technical cycle that is taking place as stocks and Gold appreciate. In the first phase, there is a basing process in both the stock market and Gold (sometimes not happening at the same time). From this basing level, the stock market begins to rally and Gold begins to appreciate as well.
In the second phase, the stock market rallies to a peak which prompts some degree of selling. This selling spills over into Gold and Silver; panic selling usually spills over to Gold and Silver immediately, putting price pressure on these precious metals. In other words, when broad market selling takes place, Gold and Silver are not immune from this panic type of downside price event and suffer accordingly. However, they react differently weeks and months after this type of price correction.
In the final phase, which usually takes place after a deep correction in the US stock market and after some new low price base has set up, the real appreciation for precious metals typically happens in a parabolic price trend. This is when risks are still perceived to be moderately high throughout the globe, yet the stock market continues to attempt to base/drive higher while Gold and Silver begin a real sharp upside price trend.
Pay attention to how the BASE LEVELS on the following Smart Cash Index to Gold Monthly chart are followed by periods of price appreciation in both the stock market and Gold. Notice how Gold has rallied in nearly equal (100% Measured Moves) since 2002 – first rallying nearly $750 (2008), then rallying nearly $950 (2011), and recently rallying nearly $950 (2020). This suggests any continuation of the 100% Measured Move structure would place a new target for Gold near $2,900~3,000. We believe a new parabolic price trend is setting up after the deep double-bottom BASE LEVEL between 2016~2020.
If our research is correct, the Super-Cycles and the deep rotation BASE LEVELS will likely set up a new base level near $1,800 to $1,950 in Gold and near $145 to $175 on our Smart Cash Index chart (see the chart further below). We believe this new base level will act as a launchpad for the new parabolic price trend in Gold and Silver throughout 2022~2023 – possibly longer.
Looking deeper, if you take a technical glance at the Custom Smart Cash Index chart below and consider how gold has advanced over the past 20 years, you’ll see the nearly 100% Measured Moves taking place (which have resulted in a 300%, 200%, 100% series of advances). Yet, what you have also seen is a moderate market peak in 2000 followed by an extensive upside price rally peaking in 2007. From that peak in 2007, we see a deep price decline and a series of sideways price trends leading up to the 2015~2016 US Presidential Election event.
After that, we see a strong upside price rally that peaked in early 2018 (which we are calling the Ultimate Top in the US stock market). This setup has a very telling pattern in price – not quite a Double-Top but rather a failed “Scouting Party” pattern where price attempted to rally above the previous 2007 peak and failed.
Currently, we believe the FUTURE BASE will set up near the current Head-and-Shoulders pattern on the Smart Cash Index or just above the previous BASE LEVEL. There is a risk of a deeper downside price move in the Smart Cash Index which may set up a deeper price base, but we have no indication at this time that any immediate, deeper downside price move is about to unload on the global markets. We believe the next 4+ years will be very similar to the 2009~2011 setup – where the US stock market attempt so establish moderate sideways/upside price base and where Gold settles above $1,800 and starts another measure move or transitions into a parabolic upside move higher.
The question our researchers continue to ask is “will the FUTURE BASE confirm and will Gold stay above $1800 to setup the new launch pad for the parabolic upside price trend?”. We’ve clearly entered a different phase of the market – likely nearing the end of the “Excess Phase”. Obviously, a deep downside price move in the US stock market is not something we want to see happen because it could create far more critical events in the future. Yet, we believe the current BASE LEVEL and the FUTURE BASE level are ideal support zones for the US stock market and the new launch pad for precious metals.
If our research is correct, by November, December or January, we should clearly know where the new BASE LEVEL has formed and if any deeper downside risks present any greater concerns. The longer-term, our Super Cycles analysis suggests we are in for a wild ride – you certainly don’t want to miss this big move in metals.
This market, the future setups described above, and the profits lying therein are fantastic opportunities for skilled technical traders to capitalize on. Isn’t it time you learned how I can help you find and execute better trades? My incredible technical analysis team and our proprietary tools have just shown you what to expect 6+ months into the future. Do you want to learn how to profit from these huge moves? Sign up for my Active ETF Swing Trade Signals today! If you have a buy-and-hold account and are looking for long-term technical signals for when to buy and sell equities, bonds, or cash, be sure to subscribe to my Passive Long-Term ETF Investing Signals.
Stay healthy and rest easy at night by staying informed of market trends with The Technical Traders!
Chris Vermeulen Chief Market Strategist Founder of Technical Traders Ltd.
NOTICE AND DISCLAIMER: Our free research does not constitute a trade recommendation or solicitation for our readers to take any action regarding this research. It is provided for educational purposes only – read our FULL DISCLAIMER here. Visit TheTechnicalTraders.com to learn how to take advantage of our members-only research and trading signals.
As a result, fossil fuel-dependent states and communities face the prospect of budget shortfalls and lower employment for the next several years. As researchers who study energy from economic, cultural and public policy perspectives, we believe that it is time for these states to develop long-term plans to diversify their economies and help ensure just and equitable transitions.
The idea of a just transition emerged from North American labor law, and has become part of international discussions about making societies more environmentally sustainable. It centers on protecting workers’ rights and livelihoods as they move out of declining industries.
In our view, just transition programs likely are the best way for these states to build more sustainable and diverse economic bases, reducing their reliance on fossil fuel production as a revenue source. To support secure, family-sustaining jobs as global fossil reliance declines, they will need to create new, lower-carbon economies.
Fossil fuels enrich producing states through multiple revenue streams. They include taxes and royalties tied to the value of production; sales taxes on hydrocarbons; use taxes on equipment; and income taxes on industry employees’ wages.
Texas earns the most of any state from energy production, generating US$16.3 billion in fiscal year 2019, which was 7% of the state’s revenue. The states that are most reliant on energy are Alaska, where it accounted for 70% of state revenues ($1.1 billion) in fiscal 2019; Wyoming, where energy and other minerals yielded 52% of state revenues ($2.2 billion) in FY2017; and North Dakota, which reaped 45% of its revenues ($1.6 billion) from energy production in fiscal 2017.
Production declines and workforce reductions can have major economic impacts in fossil fuel states. For example, Wyoming is forecasting that it will have 29% less money in its General Fund than it previously expected in fiscal years 2021-22. Alaska is projecting an estimated 18% budget deficit in fiscal 2021.
Even assuming that oil and gas production recovers from FY2020-2021 lows, these states expect to be forced to close the funding gap for the next several years.
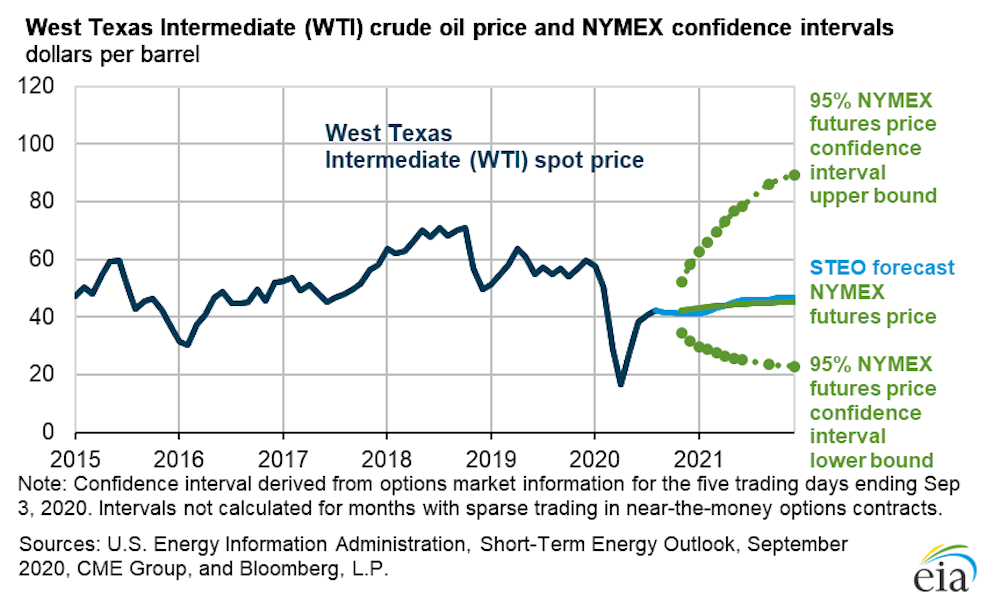
Reduced economic activity related to the COVID-19 pandemic has changed energy demand and supply patterns in 2020 and increased uncertainty about near-term prices. EIA
Cultural and political roadblocks
Wyoming illustrates the challenges that a changing energy landscape posse for energy states. In the near term, the state is forecasting a 54% decline in taxes related to fossil fuels owed it in fiscal 2021-22 compared to the previous year. According to data that we obtained from the U.S. Department of Energy, estimated coal production in April-June of 2020 was down nearly 45% from the prior five-year average, reflecting national trends.
More structurally, experts and coal producers have acknowledged that thermal coal – the type used to make electricity – is in permanent decline. State officials have sounded the alarm about an industry “under siege,” while seeking ways to keep coal production afloat.
Meanwhile, studies show that Wyoming residents receive from the state up to 10 times the value in services that they pay in taxes, thanks largely to fossil fuel-related taxes. These trends clearly can’t continue in parallel: As coal revenues fall, state spending will have to contract.
But as the state considers its future, cultural and political factors influence public views as much as economics. Wyoming’s longstanding ethos of rugged individualism makes residents reluctant to accept outside economic assistance. Its coal industry workers have long taken pride in their role in providing a source of electricity throughout the United States.
Wyoming residents grapple with the shutdown of two coal mines in 2019.
What just transitions require to succeed
Just transition programs typically focus on promoting economic development, attracting investment to stimulate entrepreneurship and retraining workers. They often provide income support to bridge the period between jobs.
State and local leaders may seek to promote specific industries that reflect larger policy goals – for example, wooing solar companies to promote decarbonization. A number of current economic development policy proposals take this approach, including Democratic presidential candidate Joe Biden’s Build Back Better plan. However, we believe new businesses are best developed at the community level so that they incorporate local intellectual capital, worker skills and natural resources, and get more political buy-in from the communities.
There are several examples of successful just transition programs. One is Project QUEST in San Antonio, which highlights the benefits of “local contextualization” and has helped workers transition from manufacturing to health care, information technology and other trades.
The province of Alberta, Canada, achieved considerable buy-in from labor unions and electricity companies as it accelerated its retirement of coal power, in part by leveraging its natural gas resources and working with local labor unions. And the New Economy program, promoted by the nonprofit organization Appalachian Voices, is amplifying residents’ ideas for new economic initiatives to offset job losses and shrinking coal tax revenues. This kind of participatory approach to economic diversification is critical for securing community support and generating novel ideas for economic development.
These programs are likely to require significant financial investment. Wyoming, North Dakota and Oklahoma don’t have a lot of debt, so they could borrow large sums to pay for these programs.
Alaska, Texas, New Mexico, Wyoming and North Dakota also have substantial sovereign wealth funds – state-owned accounts, funded with revenues from natural resource extraction. These funds could help fill the gap, but only if politicians can withstand pressure to use the money in more popular ways, such as Alaska’s annual payouts to state residents from oil revenues.
A chance for more sustainable communities
Fossil fuel states’ windfalls from energy development and their free-market cultures can make it hard for residents to accept their dependence on industry taxation and vulnerability to industry downturns. Solutions that involve increased taxing and spending are likely to face stiff political headwinds, even if sovereign wealth funds offer help.
The choices that states make as they navigate a rapidly changing energy landscape will have major implications for their workers and communities. Just transitions will require significant, focused investment, committed institutions and deep community engagement. While these processes aren’t likely to be easy, they offer the chance to build sustainable and environmentally friendly economies that can help these states thrive in the future.
The EUR/USD currency pair has become stable after a prolonged fall. At the moment, the trading instrument is consolidating. Local support and resistance levels are 1.1645 and 1.1685, respectively. Investors expect a debate between Donald Trump and Joe Biden, as well as updates on a new stimulus package in the US. Positions should be opened from key levels.
At 17:00 (GMT+3:00), CB consumer confidence index will be published.
We also recommend paying attention to the speeches by the FOMC representatives.
Indicators do not give accurate signals: the price is consolidating near the 100 MA.
The MACD histogram is in the positive zone, which indicates the bullish sentiment.
Stochastic Oscillator is in the neutral zone, the %K line is above the %D line, which gives a signal to buy EUR/USD.
Trading recommendations
Support levels: 1.1645, 1.1615, 1.1600
Resistance levels: 1.1685, 1.1715, 1.1750
If the price fixes above 1.1685, EUR/USD quotes are expected to correct. The movement is tending to 1.1715-1.1750.
An alternative could be a decline in the EUR/USD currency pair to 1.1615-1.1590.
The GBP/USD currency pair
Technical indicators of the currency pair:
Prev Open: 1.27618
Open: 1.28319
% chg. over the last day: +0.49
Day’s range: 1.28308 – 1.28846
52 wk range: 1.1409 – 1.3516
GBP/USD quotes have been growing. During yesterday’s and today’s trading sessions, the British pound added more than 120 points in price. At the moment, the trading instrument is consolidating. The GBP/USD currency pair is testing local support and resistance levels: 1.2830 and 1.2885, respectively. Further growth of GBP/USD quotes is possible. Financial market participants expect up-to-date information concerning the Brexit negotiations. Positions should be opened from key levels.
The publication of important UK economic reports is not planned.
Indicators signal the power of buyers: the price has fixed above 50 MA and 100 MA.
The MACD histogram is in the positive zone, which indicates the bullish sentiment.
Stochastic Oscillator is near the overbought zone, the %K line has started crossing the %D line. There are no signals at the moment.
Trading recommendations
Support levels: 1.2830, 1.2780, 1.2730
Resistance levels: 1.2885, 1.2930, 1.2965
If the price fixes above 1.2885, further growth of the GBP/USD currency pair is expected. The movement is tending to 1.2930-1.2970.
An alternative could be a drop in GBP/USD quotes to 1.2800-1.2760.
The USD/CAD currency pair
Technical indicators of the currency pair:
Prev Open: 1.33820
Open: 1.33682
% chg. over the last day: -0.07
Day’s range: 1.33560 – 1.33920
52 wk range: 1.2949 – 1.4669
USD/CAD quotes continue to consolidate. There is no defined trend. At the moment, the local support and resistance levels are 1.3355 and 1.3390, respectively. Investors expect additional drivers. In the near future, a technical correction of the trading instrument is possible. We recommend paying attention to the dynamics of “black gold” prices. Positions should be opened from key levels.
The news feed on Canada’s economy is calm.
Indicators do not give accurate signals: the price has crossed the 50 MA and 100 MA.
The MACD histogram is near the 0 mark. There are no signals at the moment.
Stochastic Oscillator is in the neutral zone, the %K line is below the %D line, which indicates the bearish sentiment.
Trading recommendations
Support levels: 1.3355, 1.3325, 1.3290
Resistance levels: 1.3390, 1.3415, 1.3450
If the price fixes above 1.3415, further growth in USD/CAD quotes is expected. The movement is tending to 1.3450-1.3470.
An alternative could be a decrease in the USD/CAD currency pair to 1.3325-1.3290.
The USD/JPY currency pair
Technical indicators of the currency pair:
Prev Open: 105.480
Open: 105.461
% chg. over the last day: -0.09
Day’s range: 105.342 – 105.707
52 wk range: 101.19 – 112.41
The USD/JPY currency pair is still being traded in flat. The technical pattern is ambiguous. The trading instrument is consolidating near two-week highs. USD/JPY quotes are testing the level of 105.70. The 105.35 level is the nearest support. Investors expect additional drivers. We recommend paying attention to the dynamics of the US government bonds yield. Positions should be opened from key levels.
The news feed on Japan’s economy is quite calm.
Indicators do not give accurate signals: the price is consolidating near 50 MA and 100 MA.
The MACD histogram has started growing, which indicates the bullish sentiment.
Stochastic Oscillator is in the neutral zone, the %K line is below the %D line, which gives a signal to sell USD/JPY.
Trading recommendations
Support levels: 105.35, 105.20, 104.45
Resistance levels: 105.70, 106.00
If the price fixes above 105.70, further growth in USD/JPY quotes is expected. The movement is tending to 106.00-106.30.
An alternative could be a decline in the USD/JPY currency pair to 105.00-104.80.
This article reflects a personal opinion and should not be interpreted as an investment advice, and/or offer, and/or a persistent request for carrying out financial transactions, and/or a guarantee, and/or a forecast of future events.
Limassol, Cyprus, Sept. 29, 2020 — RoboMarkets, a company that provides financial services to European clients, has received the “Most Trusted European Broker” award at “Global Forex Awards 2020 – Retail”, the leading sectoral event. Organizers highly appreciated the success and achievements of RoboMarkets in the European market and gave credit to a high quality of services offered by the company.
“Global Forex Awards 2020 – Retail” commends achievements of the world’s leading brokers on global and regional scales. Among winners are the companies that achieved outstanding results in implementing their projects in such areas as the introduction of advanced technologies, comprehensive market research, carrying out of effective educational programs, provision of quality financial services on financial markets.
Konstantin Rashap, Chief Business Officer at RoboMarkets: “Recognition of us as the most trusted European broker is priceless. People require business openness and availability of quality services on a regular basis, and that’s exactly what RoboMarkets offers. In the future, we’re going to stick to the chosen development path and continue providing our clients with the first-class brokerage service”.
About RoboMarkets
RoboMarkets is an investment company with the CySEC license No. 191/13. RoboMarkets offers investment services in many European countries by providing traders, who work on financial market, with access to its proprietary trading platforms. More detailed information about the Company’s products and activities can be found on the official website at www.robomarkets.com.


 Article by