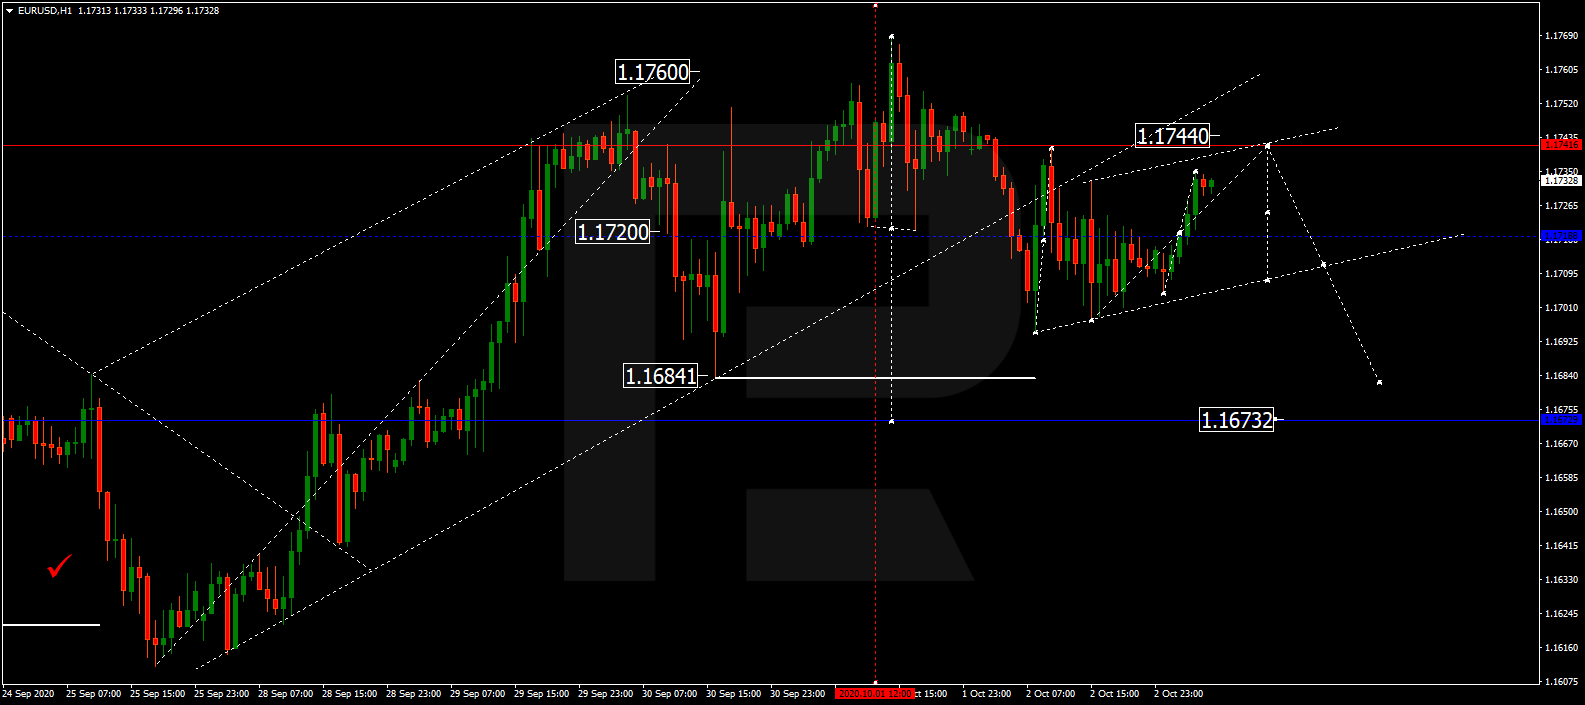
EURUSD is still consolidating around 1.1720. Today, the pair may grow to reach 1.1744 and then resume falling towards 1.1684. Later, the market may form one more ascending structure to return to 1.1720 and then continue trading within the downtrend with the first target at 1.1673.
GBPUSD, “Great Britain Pound vs US Dollar”
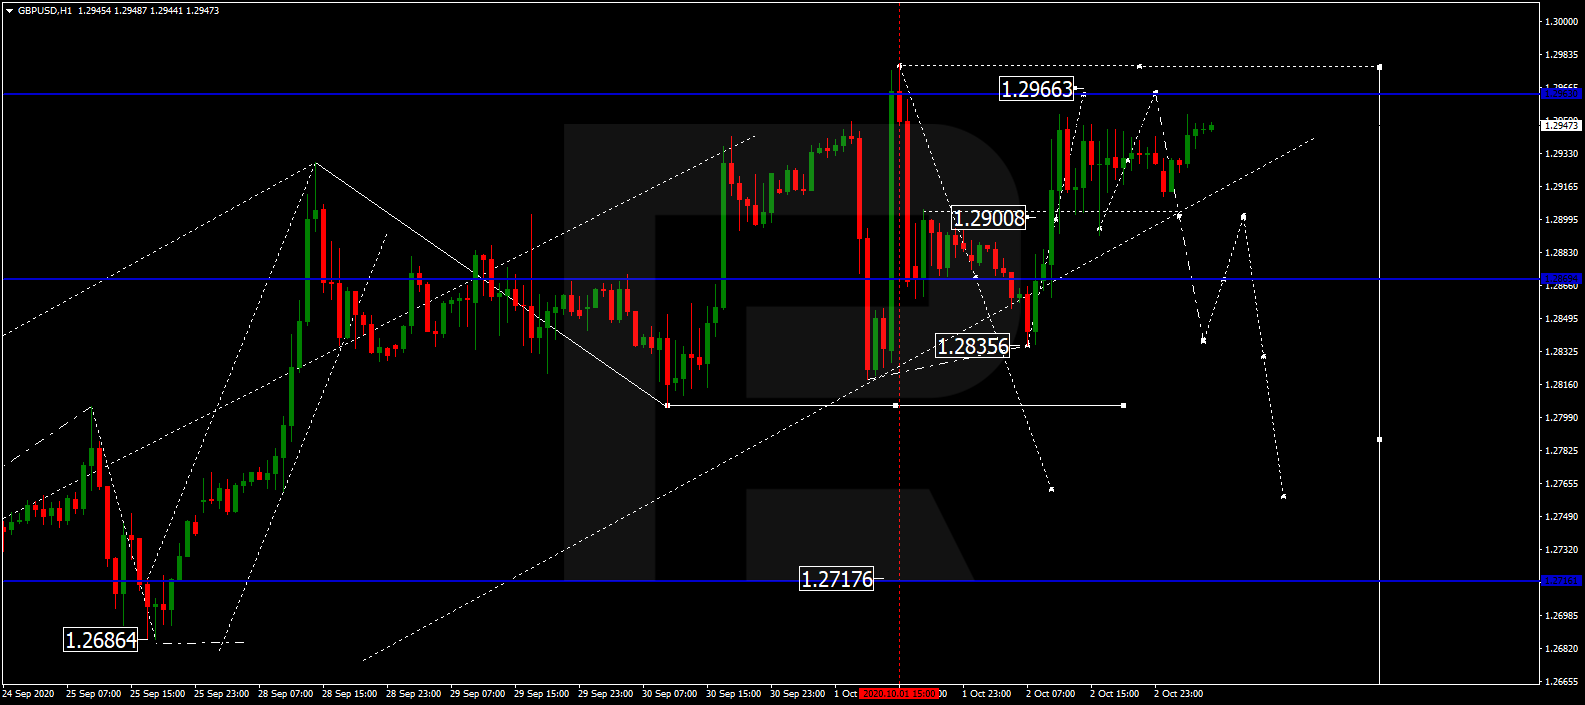
GBPUSD is still consolidating at 1.2900. Possibly, today the pair may grow to reach 1.2966 and then form a new descending structure towards 1.2828 or even continue falling with the first target at 1.2740.
USDRUB, “US Dollar vs Russian Ruble”
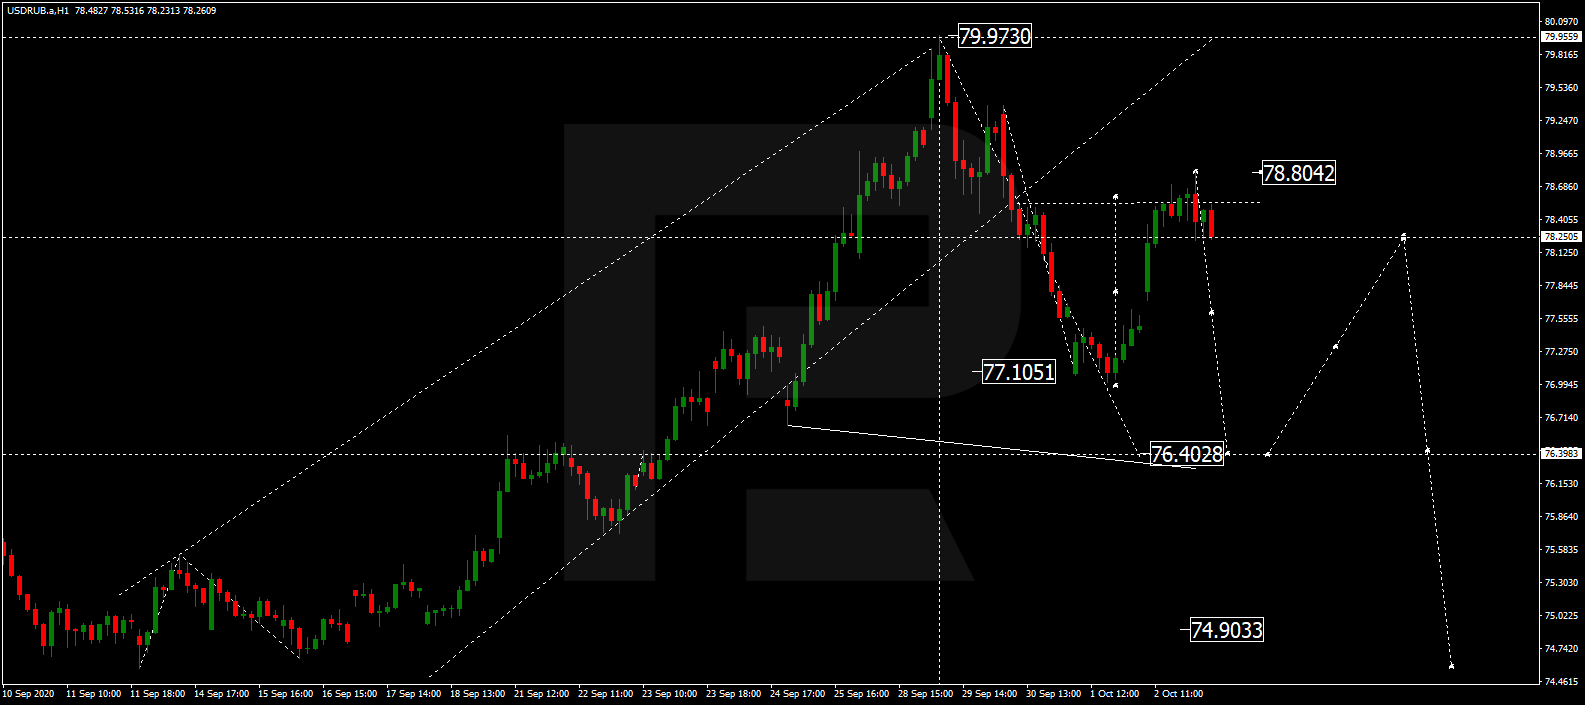
After finishing the ascending correctional structure at 78.80, USDRUB is expected to form a new descending wave with the first target at 76.40.
USDJPY, “US Dollar vs Japanese Yen”
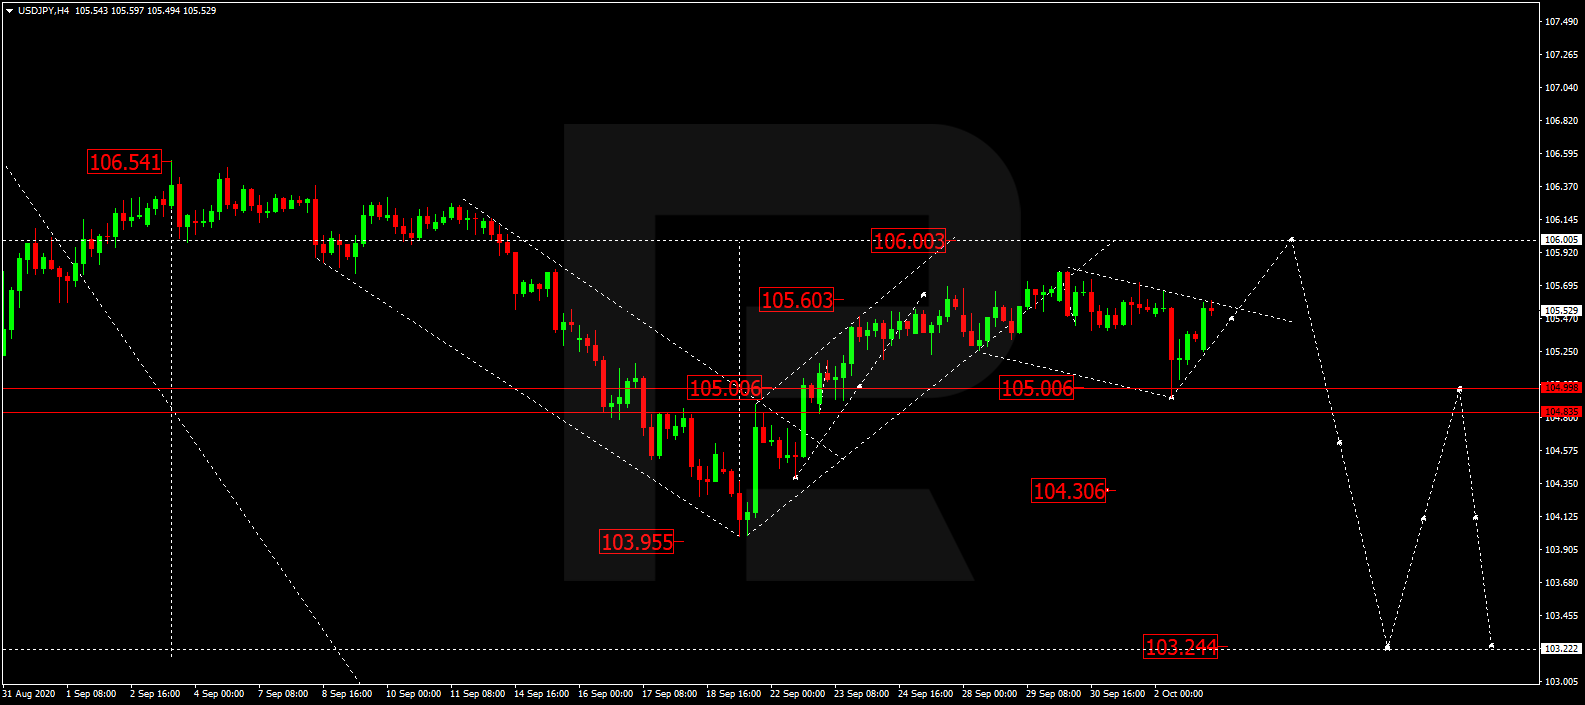
USDJPY is still forming the fifth structure of the current ascending wave with the target at 106.00. After that, the instrument may fall towards 105.00, thus forming a new consolidation range between these two levels. If later the price breaks this range to the downside, the market may form start another decline with the target at 103.25.
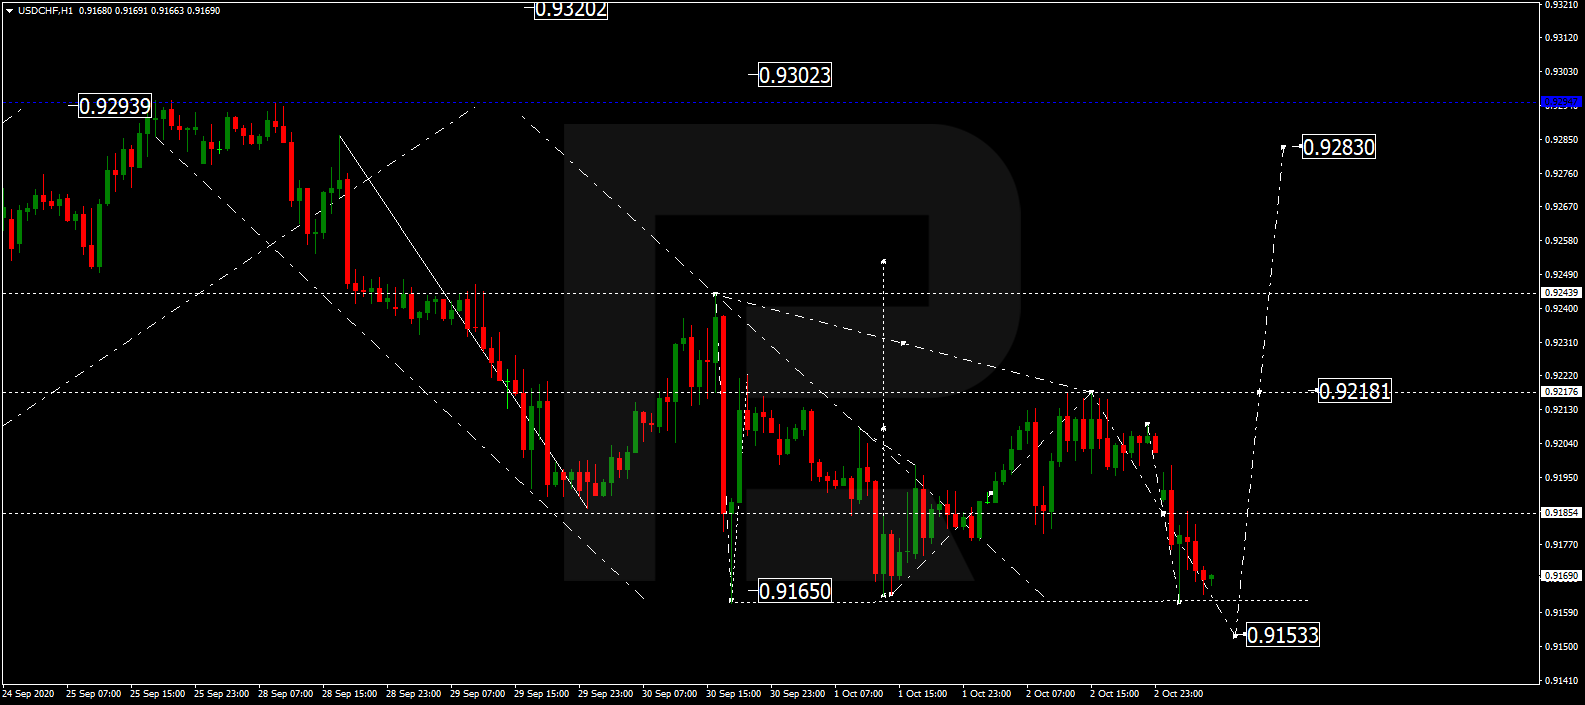
USDCHF, “US Dollar vs Swiss Franc”
USDCHF is trading close to the downside border of a wide consolidation range. The main scenario implies that the price may expand the range down to 0.9155 and then start another growth towards the upside border at 0.9218. If later the price breaks this range to the upside, the market may resume moving upwards with the target at 0.9283 or even 0.9350.
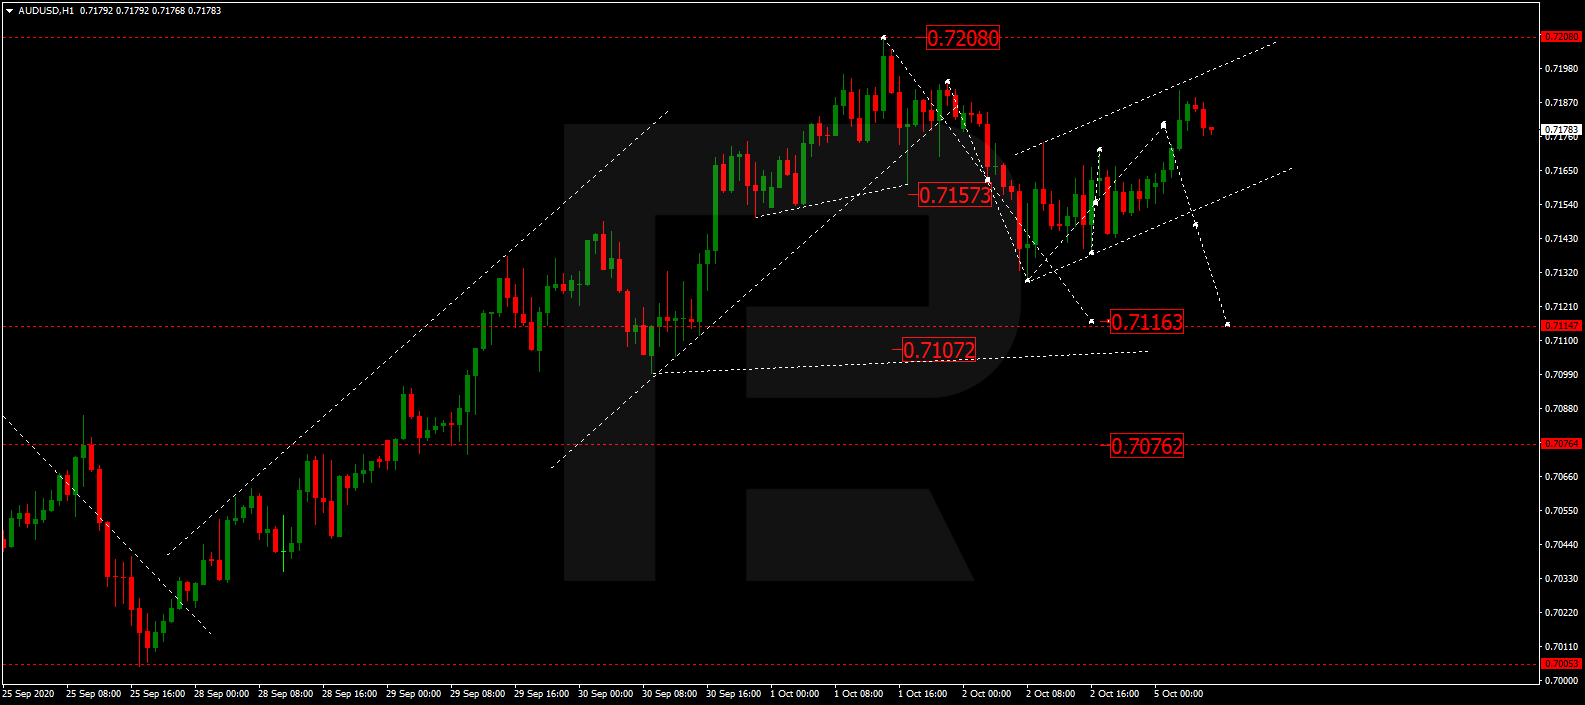
AUDUSD, “Australian Dollar vs US Dollar”
After completing two descending structures along with the correction at 0.7188, AUDUSD is expected to form the third one with the first target at 0.7017. After that, the instrument may correct in the form of a Flag pattern towards 0.7160 and then resume trading downwards to reach 0.7070.
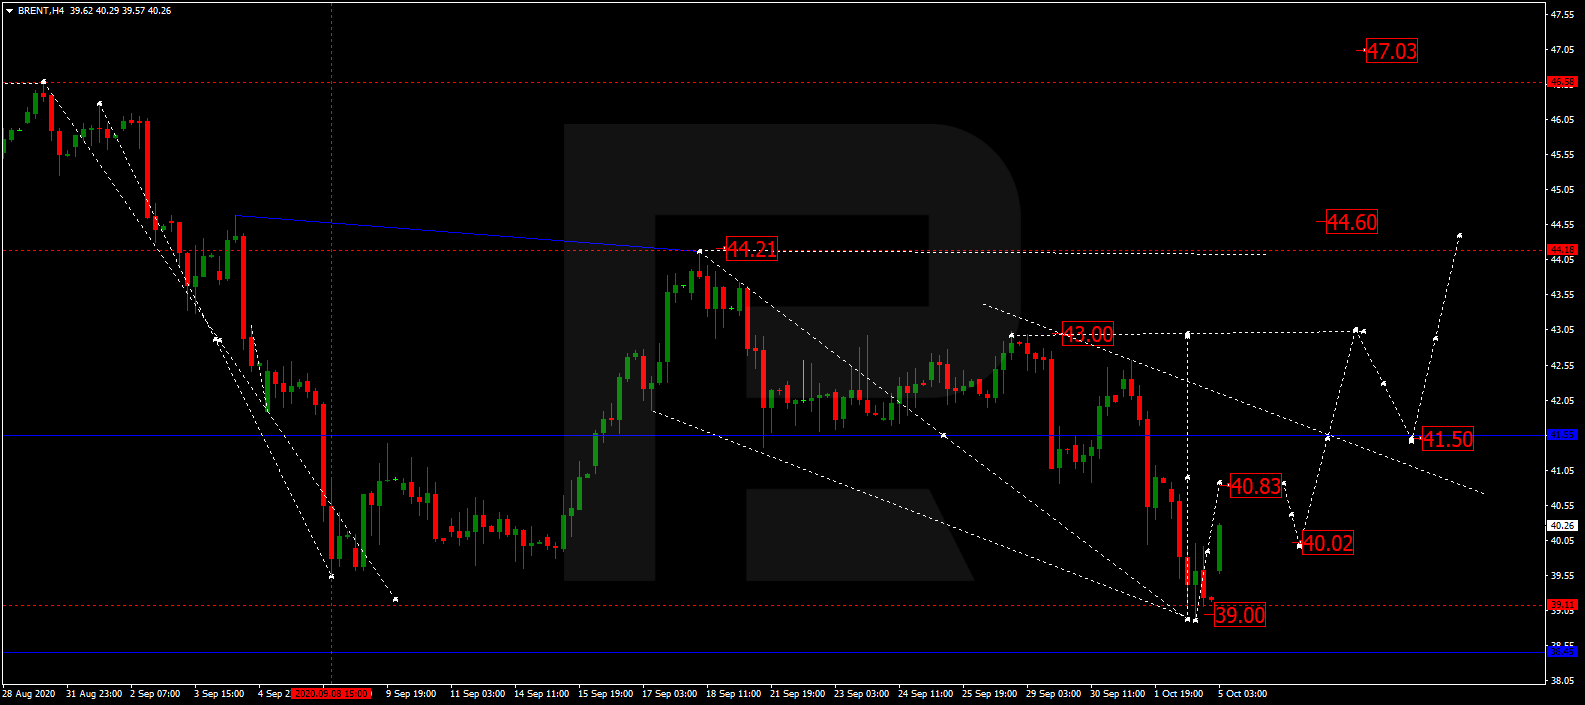
BRENT
After finishing the descending wave at 39.00, Brent is expected to grow towards 40.80 and then start another correction to reach 40.00, thus forming a new consolidation range between these two levels. If later the price breaks this range to the upside, the market may continue moving upwards with the first target at 43.00.
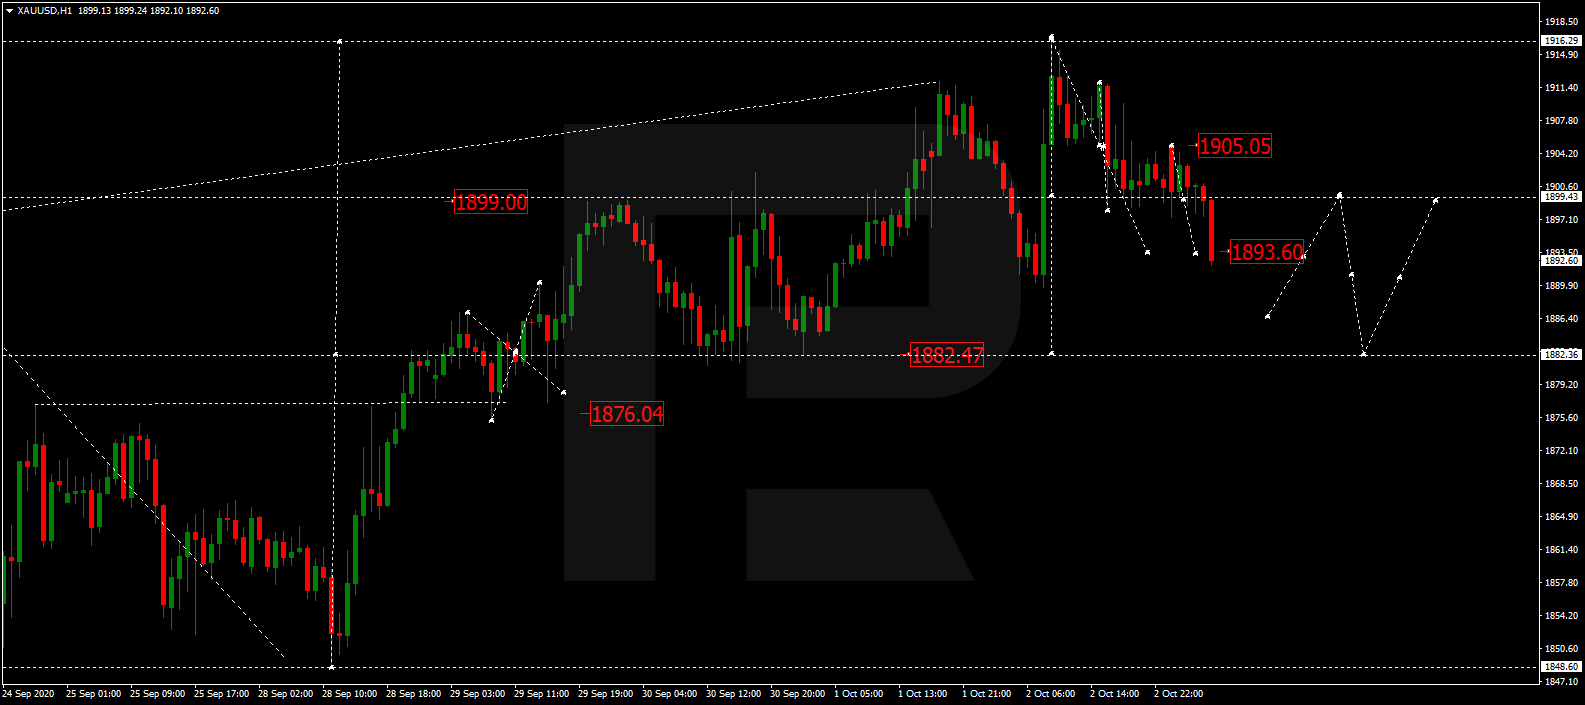
XAUUSD, “Gold vs US Dollar”
After completing the descending wave at 1893.60, Gold is expected to consolidate around this level. If later the price breaks this range to the upside, the market may correct towards 1905.00; if to the downside – resume trading downwards with the target at 1882.50.
BTCUSD, “Bitcoin vs US Dollar”
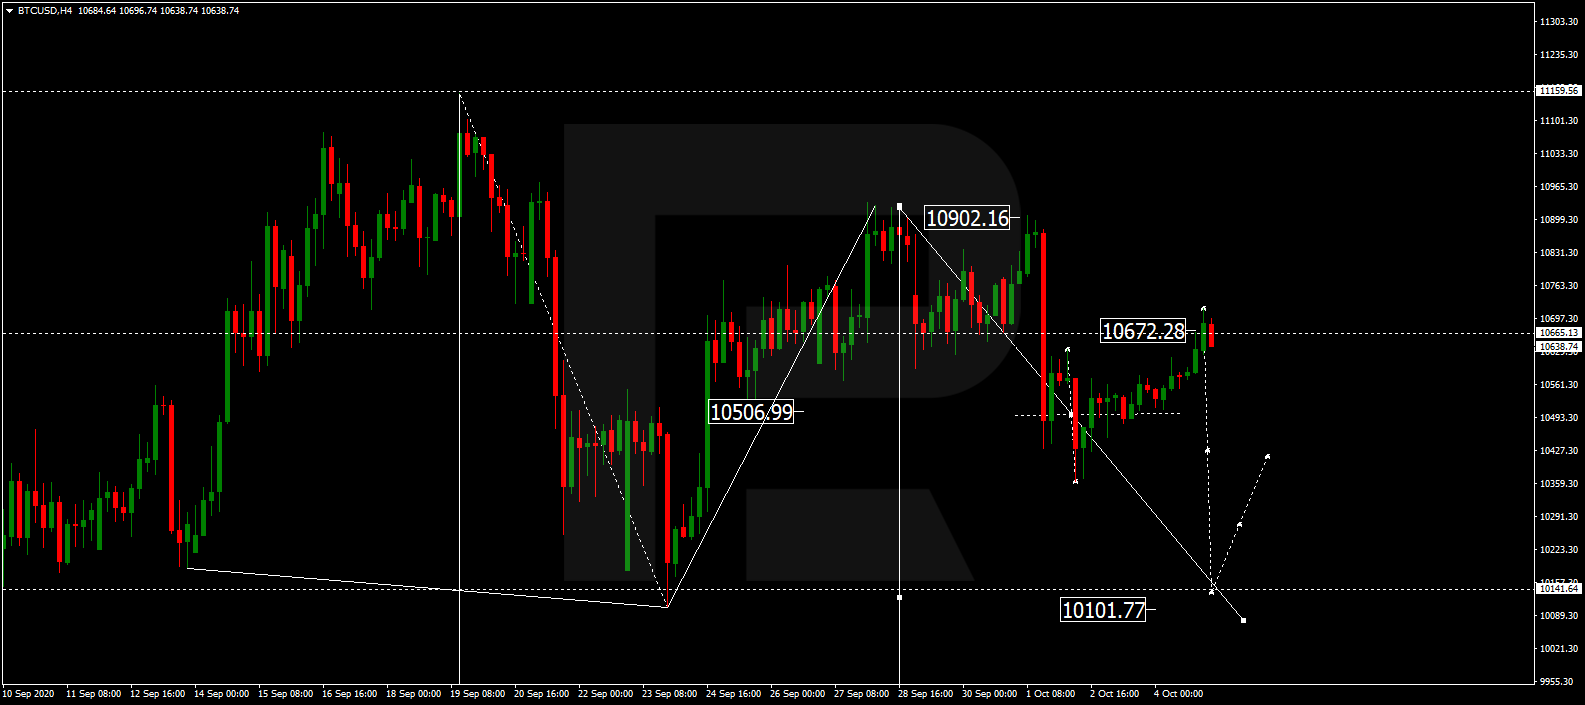
After falling and reaching 10400.00, BTCUSD has finished the correction towards 10700.00. Today, the asset may form a new descending structure to break 10400.00 and then continue trading within the downtrend with the short-term target at 9600.00.
S&P 500
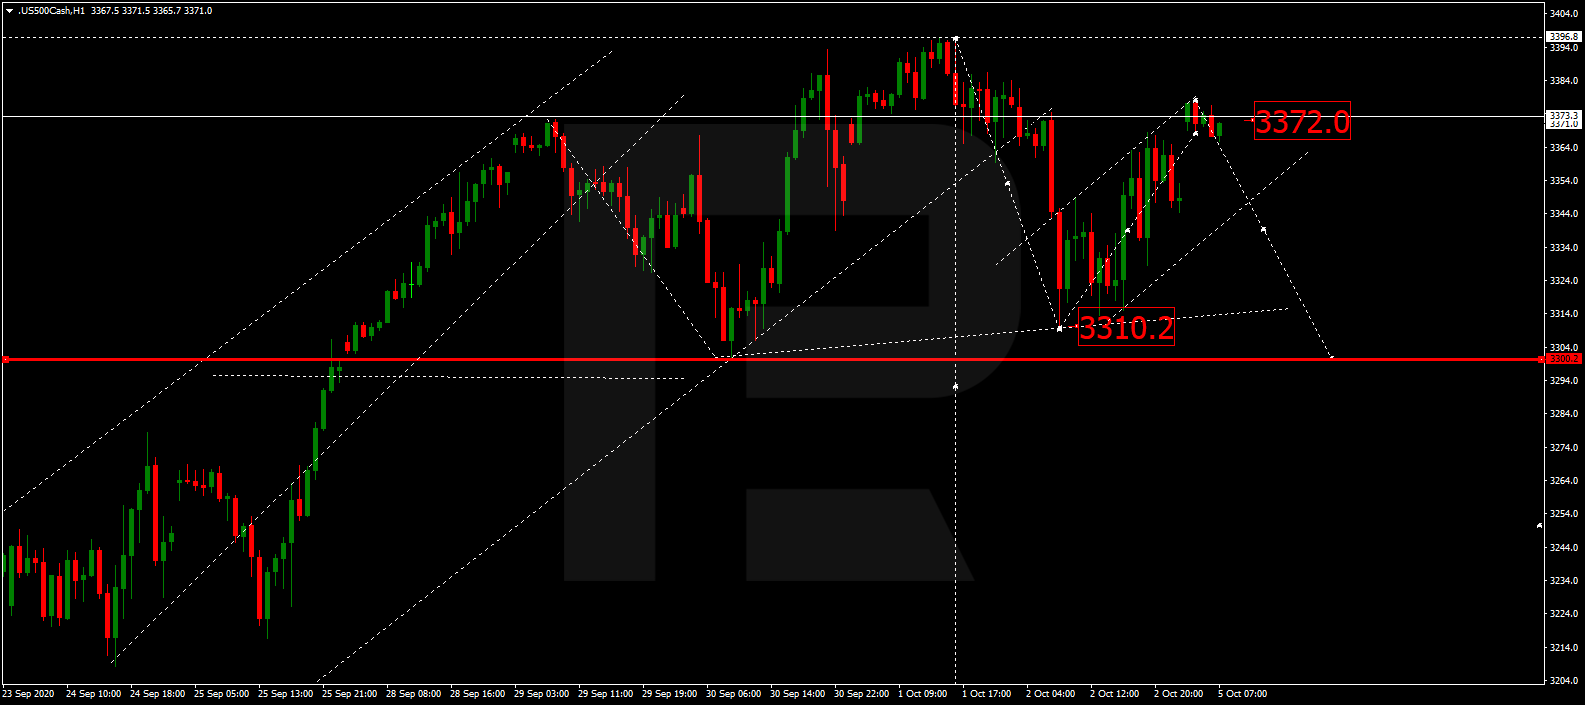
After finishing the descending impulse at 3310.2, the S&P index has completed the correction towards 3372.0; right now, it is consolidating below the latter level. Possibly, the asset may form a new descending structure to break 3300.0 and then resume falling with the short-term target at 3202.5.
Attention! Forecasts presented in this section only reflect the author’s private opinion and should not be considered as guidance for trading. RoboForex LP bears no responsibility for trading results based on trading recommendations described in these analytical reviews.
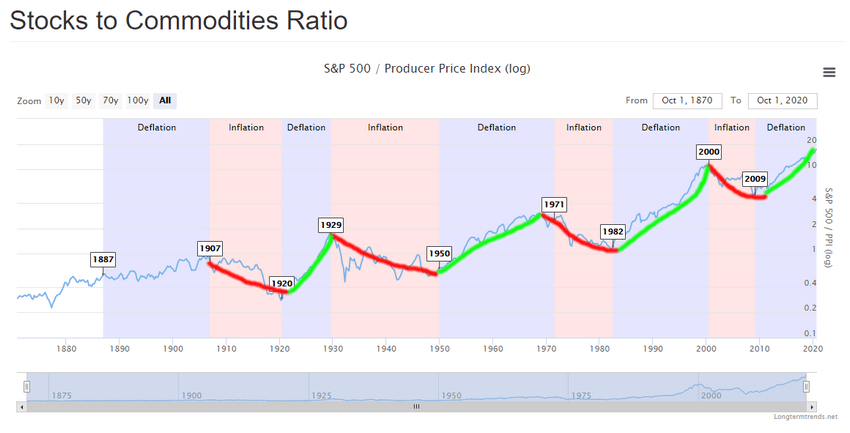
In the early 1900s, multiple events prompted a rising commodity price level and a decline in the Stocks to Commodities ratio. We expect commodities may begin to appreciate and where stock price levels may stall or decline.
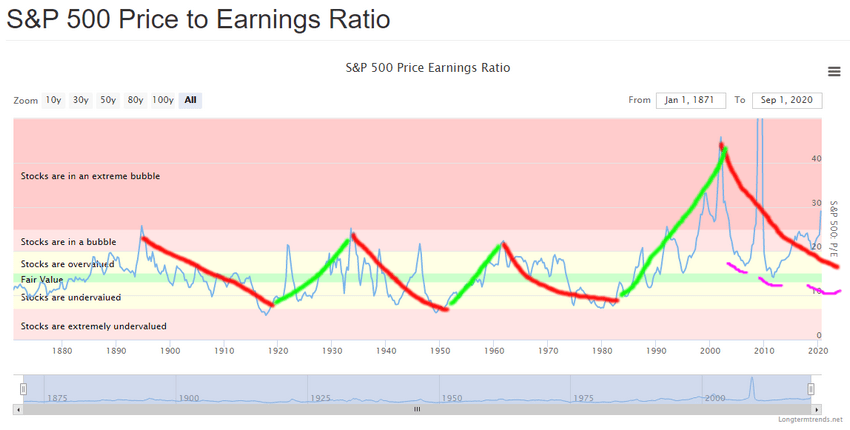
We also believe we are currently nearing the end of a rising cycle in both Stocks to Commodities and S&P500 to Earnings ratios, suggesting a downward/sideways trend in the US stock market will continue while commodities attempt to form a longer-term momentum base.
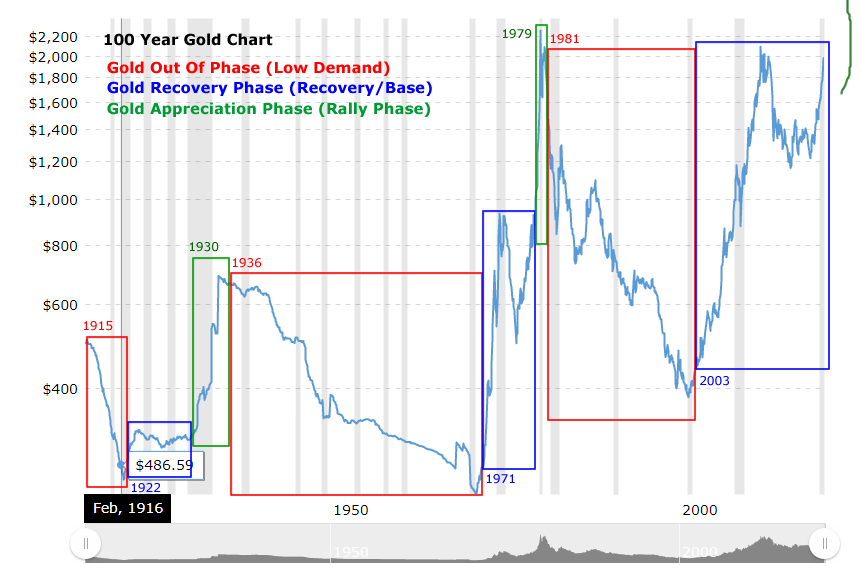
The current 100-year Gold cycle suggests a Recovery phase is nearly complete and we should expect an Appreciation phase to begin within 2 years (or less). Historically, the Appreciation phase prompts a 200% to 300%+ rally in Gold prices.
My research team and I have been pouring over the long-term data related to the current global markets and central bank efforts to support the global economy in the midst of the COVID-19 pandemic… and we have some keen insights I would like to share with you. This research article highlights historical chart phases and trends and shows you how important it is to pay attention to cycles and Super-Cycle events as they continue to trend.
US STOCKS TO COMMODITIES RATIO CHART PHASES
In the early 1900s, multiple events prompted a rising commodity price level and a decline in the Stocks to Commodities ratio. The continued industrialization of the US as well as the demand for commodities as “maker industries” flourished in the early 1900s prompted a decline in the Stocks to Commodities ratio. The start of WWI (1914 – 1918) prompted a strong downtrend in the Stocks to Commodities ratio, eventually settling near a bottom in June 1920. Even the Spanish Flu added to the demand for commodities as consumers still needed basic commodities to survive.
At that time in economic cycles, stock price levels began to collapse in comparison to commodity prices. We can clearly see the downtrend in the long-term Stocks to Commodities Ratio chart below. Pay very close attention to how the downtrend lasted from early 1907 to 1921. When the Stocks to Commodities ratio declines in value, we typically see a rising commodities price level compared to a declining or stalling stock price level. When the Stocks to Commodities ratio rises, this represents a declining commodities price level to a rising or stable stock price level.
We are currently in an upward Stocks to Commodities ratio cycle – which suggests commodities are decreasing in value while stocks are increasing in value. We believe this cycle may be nearing an end (within the next few years) where commodities may begin to appreciate and where stock price levels may stall or decline.
The COVID-19 virus event may present a similar downtrend in US stock price levels as we may have experienced with the Spanish Flu in 1918 – pushing the current rising trend into a declining trend. The cycle of demand for commodities becomes dependent on consumer and industrial demand cycles. Currently, we believe the demand level for raw commodities is diminishing considerably as the global economy reverberates because of the COVID-19 shutdowns.
S&P 500 PRICE TO EARNINGS RATIO CHART PHASES
When we take a look at the longer-term S&P500 Price to Earnings Ratio chart below, we see similar trends that somewhat align with the Stocks to Commodities Ratio chart. The first downward Earnings trend peaked near 1986 and bottomed near 1919 (below). The second downward Earnings trend peaked near 1934 and bottomed near 1952. Using a simple “by eye” comparison across these two charts, it appears the peak in the Earnings charts originated about 2~3 years before the peak in the Stock to Commodities peaks and the bottoms in these cycles aligned within a 1~2 year range.
Our research team believes we are currently nearing the end of a rising cycle in both Stocks to Commodities and S&P500 to Earnings ratios. We believe the final phase of this advance will look somewhat like 1933 to 1952 declining cycle where stock and commodities attempt to find a base level (we call fair market value). We believe the Excess Phase in the US stock market has contracted over the past 25+ days as an exhaustion peak. If this trend continues, we believe a downward/sideways trend in the US stock market will continue while commodities attempt to form a longer-term momentum base (possibly lasting 24+ months) before bottoming.
100 YEAR GOLD CHART PHASES
The 100 year Gold chart below highlights the unique phases showing how Gold reacts to the broader market cycle phases we’ve highlighted above. Gold, being a safe-haven commodity, reacts in similar cycle phases (excluding the 1971 Exit from the Gold Standard phase). You can clearly see the three phases we’ve highlighted in the chart below roughly align with the cycle phases and trends in the Commodities Ratio charts seen above. The primary difference is that Gold enters a Recovery Phase early in the organic economic growth phases of the Commodity cycles and is somewhat immune to the S&P Price to Earnings phases.
Notice how Gold began Recovery Phases in 1922, 1971 and 2004? Now, take a look at the Stocks to Commodities Ratio bottoms in the cycles: 1920, 1950, 1982, and 2009. As you can see, there is alignment with the exception of the 1950 and 1982 cycle bottoms. This can easily be explained as a process of the institution of the US Federal Reserve (1933) and the removal of the Gold Standard (1971). When we discount these dramatic alterations to the organic cycles, we can see that Gold reacted to the ending of the Gold Standard with a huge Recovery and Appreciation phase.
The current cycle suggests a Recovery phase is nearly complete and we should expect an Appreciation phase to begin within 2 years (or less). Historically, the Appreciation phase prompts a 200% to 300%+ rally in Gold prices – this time the rally may be even greater. We are just waiting for confirmation that the upward cycle in Stocks to Commodities and S&P Price to Earnings ratios have peaked and begin to move lower. That cycle confirmation will suggest the Recovery phase in Gold has ended and the Appreciation phase has begun. Additionally, once Gold rallies above $2,200 (breaking recent highs), this could also be considered a confirmation of the new Appreciation Phase in Gold.
This article illustrates that longer-term economic cycles play a very big role in how we, as technical traders, attempt to identify opportunities and trends. The theory that Technical Analysis is the study of indicators and price theory fails to address the fact that many aspects of cycles, trends, appreciation/depreciation, theory, indicators, and other factors go into our analysis. We use Technical analysis as a final confirmation tool and as a primary source for our research, but we rely on cycles, historical data, nuanced patterns and so much more to try to help traders find and execute better trades.
Traders should be ready for wild volatility over the next 2~3+ years and a very strong potential that commodity prices (particularly Gold and Silver) will transition into the Appreciation Phase fairly soon. I have been following Gold and Silver for years now and have many of the Gold industry giants following my precious metals research. I walk through the precious metals, miners, and junior miners charts several times a week in my pre-market video report delivered every morning to Technical Trader subscribers.
Isn’t it time you learned how I can help you better understand technical analysis as well as find and execute better trades? If you look back at past research, you will see that my incredible team and our proprietary technical analysis tools have shown you what to expect from the markets in the future. Do you want to learn how to profit from these expected moves? If so, sign up for my Active ETF Swing Trade Signals today!
If you have a buy-and-hold or retirement account and are looking for long-term technical signals for when to buy and sell equities, bonds, precious metals, or sit in cash then be sure to subscribe to my Passive Long-Term ETF Investing Signals to stay ahead of the market and protect your wealth!
Chris Vermeulen Chief Market Strategist Technical Traders Ltd.
NOTICE AND DISCLAIMER: Our free research does not constitute a trade recommendation or solicitation for our readers to take any action regarding this research. It is provided for educational purposes only – read our FULL DISCLAIMER here. Visit TheTechnicalTraders.com to learn how to take advantage of our members-only research and trading signals.
The technical pattern on the EUR/USD currency pair is still ambiguous. The trading instrument continues to consolidate. On Friday, the US published quite weak report on the labor market for September. At the moment, financial market participants expect up-to-date information on Donald Trump’s health status, who caught the coronavirus. The negotiations in the US Congress on a new stimulus package for the country’s economy are in the spotlight. EUR/USD quotes are consolidating in the range of 1.1700-1.1740. We recommend opening positions from these marks.
The news feed on 2020.10.05:
– Data on economic activity in the Eurozone at 11:00 (GMT+3:00);
– ISM non-manufacturing PMI at 17:00 (GMT+3:00).
Indicators do not give accurate signals: the price has crossed the 50 MA and 100 MA.
The MACD histogram is near the 0 mark. There are no signals at the moment.
Stochastic Oscillator is in the neutral zone, the %K line is below the %D line, which gives a signal to sell EUR/USD.
Trading recommendations
Support levels: 1.1700, 1.1680, 1.1640
Resistance levels: 1.1740, 1.1770, 1.1800
If the price fixes above 1.1740, further growth of EUR/USD quotes is expected. The movement is tending to 1.1770-1.1800.
An alternative could be a decline in the EUR/USD currency pair to 1.1670-1.1650.
The GBP/USD currency pair
Technical indicators of the currency pair:
Prev Open: 1.28780
Open: 1.29321
% chg. over the last day: +0.33
Day’s range: 1.28996 – 1.29538
52 wk range: 1.1409 – 1.3516
Trading activity and volatility on the GBP/USD currency pair remain high. At the same time, the British pound is still in a sideways trend. At the moment, the local support and resistance levels are 1.2890 and 1.2950, respectively. Investors expect new information regarding the Brexit talks. Today, financial market participants will assess important economic releases from the UK and the US. Positions should be opened from key levels.
At 11:30 (GMT+3:00), a number of indicators on economic activity in the UK will be published.
Indicators do not give accurate signals: the price is testing 50 MA and 100 MA.
The MACD histogram is near the 0 mark. There are no signals at the moment.
Stochastic Oscillator is in the neutral zone, the %K line is below the %D line, which gives a signal to sell GBP/USD.
Trading recommendations
Support levels: 1.2890, 1.2830, 1.2800
Resistance levels: 1.2950, 1.2975, 1.3000
If the price fixes above 1.2950, further growth of the GBP/USD currency pair is expected. The movement is tending to the round level of 1.3000.
An alternative could be a drop in GBP/USD quotes to 1.2840-1.2820.
Sales prevail on the USD/CAD currency pair. The loonie is testing local lows. At the moment, USD/CAD quotes are consolidating near the 1.3270 mark. The round level of 1.3300 is the nearest resistance. The trading instrument has the potential for further decline. We recommend paying attention to the economic releases from the US, as well as to the dynamics of “black gold” prices. Positions should be opened from key levels.
The news feed on Canada’s economy is calm.
Indicators signal the power of sellers: the price has fixed below 50 MA and 100 MA.
The MACD histogram is in the negative zone, which indicates the bearish sentiment.
Stochastic Oscillator is in the oversold zone, the %K line has crossed the %D line. There are no signals at the moment.
Trading recommendations
Support levels: 1.3270, 1.3240, 1.3200
Resistance levels: 1.3300, 1.3330, 1.3355
If the price fixes below 1.3270, a further drop in USD/CAD quotes is expected. The movement is tending to 1.3240-1.3220.
An alternative could be the growth of the USD/CAD currency pair to 1.3330-1.3360.
The USD/JPY currency pair
Technical indicators of the currency pair:
Prev Open: 105.530
Open: 105.276
% chg. over the last day: -0.16
Day’s range: 105.232 – 105.637
52 wk range: 101.19 – 112.41
The USD/JPY currency pair has recovered most of its losses after a sharp decline on Friday. At the moment, the trading instrument is consolidating. The key support and resistance levels are 105.40 and 105.65, respectively. Financial market participants expect additional drivers. We recommend paying attention to the dynamics of US government bonds yield. Positions should be opened from key levels.
The news feed on Japan’s economy is quite calm.
Indicators do not give accurate signals: the price has crossed the 100 MA.
The MACD histogram is in the negative zone, which indicates the bearish sentiment.
Stochastic Oscillator is in the neutral zone, the %K line has crossed the %D line. There are no signals at the moment.
Trading recommendations
Support levels: 105.40, 105.25, 104.95
Resistance levels: 105.65, 105.80, 106.00
If the price fixes below 105.40, USD/JPY quotes are expected to fall. The movement is tending to 105.00-104.80.
An alternative could be the growth of the USD/JPY currency pair to the round level of 106.00.
This article reflects a personal opinion and should not be interpreted as an investment advice, and/or offer, and/or a persistent request for carrying out financial transactions, and/or a guarantee, and/or a forecast of future events.
Manufacturing activity in China showed a strong increase in September after the economy ended lockdown measures a few months ago. This was according to the data from IHS Markit.
However, the regional Caixin manufacturing PMI saw a slower pace as the index fell to 53 in September from 53.1 in August. But the official data showed an increase to 51.5, up from 50 in August.
New orders rose the most since 201, largely due to external demand. The export business also grew at the fastest pace since August 2017.
Japan’s quarterly Tankan surveys improve
Manufacturing sector sentiment in Japan showed the first improvement in three years, data from the Bank of Japan showed last week.
The headline Tankan survey tracking large manufacturers came in at -27, improving by seven points from the previous month.
Manufacturing sentiment rose from an 11-year low in the second quarter. Meanwhile, sentiment among non-manufacturers rose by five points to -12
Eurozone manufacturing sector rises in September
The final manufacturing PMI data from the eurozone showed a faster than forecast increase in activity. The rise came mostly on an increase in manufacturing activity in Germany.
On a seasonally adjusted basis, eurozone manufacturing PMI rose to 53.7, up from 51.7 in August.
The data from IHS Markit confirmed the previous flash estimates. The increase in September marks a three-month rise in the manufacturing sector for the eurozone. It is also the strongest expansion in two years.
ISM manufacturing PMI slows in September
The monthly manufacturing activity in the United States, as measured by the Institute of Supply Management saw a slower pace of increase in September.
Official data showed that the purchasing manager index dropped to 55.4 in September, compared to a 56.0 increase in August.
Economists forecast an increase to 56.3. The slower pace of activity comes amid a slump in new orders which fell to 60.2, following an increase to 67.6 in August.
The production index was also down to 62 in September, from 63.3 a month ago.
US unemployment rate falls to 7.9%
The monthly jobs report for September was a mixed bag. The unemployment rate continued to fall, while the number of payrolls started to slow.
The unemployment rate fell to 7.9% in September, from 8.4% previously. However, payrolls rose just by 661,000 during the month.
Average hourly earnings also slowed, rising just 0.1%. Revisions to the previous month saw August payrolls rising by 1.49 million.
However, for September, the report missed the estimates on both the payrolls as well as the hourly earnings.
Upcoming Economic Events
RBA likely to keep rates unchanged this week
The Reserve Bank of Australia will be meeting this week to decide on monetary policy. According to a general poll, the central bank is forecast to keep rates steady at a record low of 0.25%.
However, expectations are that the RBA could be making plans for a rate cut in November this year. The central bank lowered rates to the current level back in March this year.
Still, the expectations for November remain mixed, with some economists noting that the rate cut could happen only next year.
This comes as the central bank and its officials repeatedly flagged the possibility of further easing.
Fed meeting minutes due on Wednesday
The US Federal Reserve will be releasing its monetary policy meeting minutes from September.
The meeting minutes are unlikely to show any major changes with more of the status quo. However, investors will get to read between the lines after the Fed moved towards letting inflation overshoot the target 2%.
The economic projects from the September meeting also showed that interest rates will remain unchanged well into 2021.
This comes as various officials have noted that further stimulus from the central bank is unlikely.
ECB meeting minutes due on Thursday
The European Central Bank will be releasing the September monetary policy meeting minutes on Thursday.
The ECB disappointed without making any major references to the strength of the euro currency. However, in recent weeks, there has been speculation that the ECB could be shifting to a policy similar to the Fed.
With inflation in the eurozone stubbornly below 2% for a prolonged period of time, an ‘inflation overshoot’ is the likely outcome.
Investors will get to see the central bank’s thinking in order to decipher any clues on forward-guidance.
UK GDP and construction, manufacturing data on tap
A busy Thursday is in store with a lot of data coming out of the UK.
Firstly, the monthly GDP report for August is forecast to show an increase of 4.6%. This marks a slower pace of increase compared to the 6.6% gains in the month before.
Later, the industrial, construction and manufacturing output data are forecast to show expansion. However, the pace of increase in activity is set to slow.
Investors will likely brush aside the data in light of the latest second wave pandemic hitting the UK.
Author: Dmitriy Gurkovskiy, Chief Analyst at RoboForex
On Monday, October 5th, the major currency pair is gaining in weight and moving at 1.1731.
The market is slowly restoring to its balanced state: the Trumps are sick but not as serious as market players thought, the speed at which COVID-19 is spreading around the world is high but everyone got used to it, and the statistics on the US labor market turned out to be more neutral than expected.
The Unemployment Rate in the USA went down to 7.9% in September after being 8.4% in the previous month, which is better than the expected reading of 8.2%. The Average Hourly Earnings added only 0.1% m/m after expanding by 0.3% m/m the month before, while the Non-Farm Payroll showed 661K and that’s much worse than expected. However, it’s quite clear that the sector is not elastic and can’t expand and create new jobs on a regular basis.
On the other hand, it is apparent that the risks are reducing, thus allowing the major currency pair to get back to more or less strong levels.
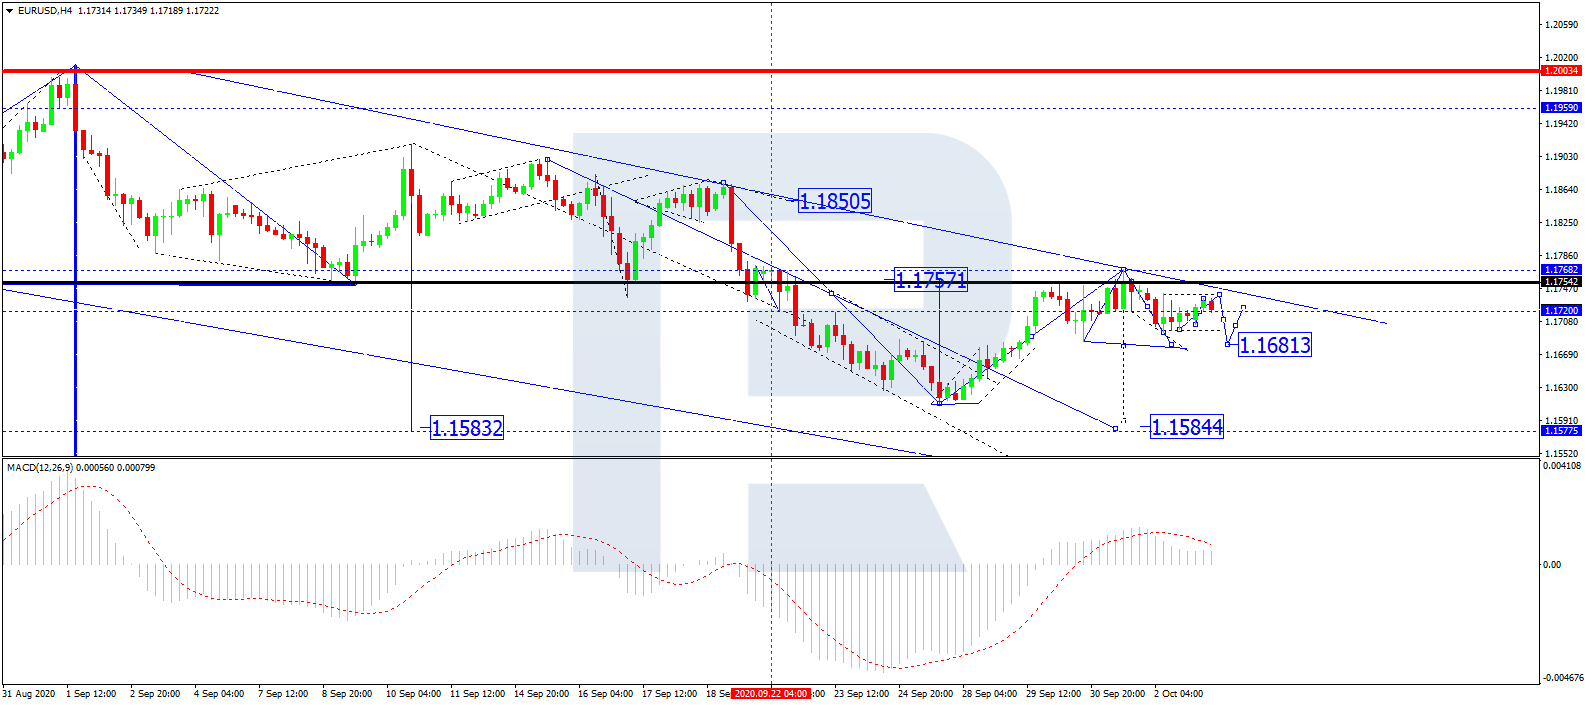
In the H4 chart, EUR/USD has completed the ascending wave at 1.1768; right now, it is consolidating around 1.1720. Possibly, the pair may break the range to the downside to reach 1.1680 and then form one more ascending structure to test 1.1720 from below. After that, the instrument may fall to return to 1.1680 and then start a new correction towards 1.1720, which may be followed by another decline to break 1.1680. Later, the market may continue trading inside the downtrend with the target at 1.1584. From the technical point of view, this scenario is confirmed by MACD Oscillator: its signal line is no longer moving inside the histogram area. Later, the line is expected to fall towards 0 and break it. If it happens, the asset may boost its decline on the price chart.
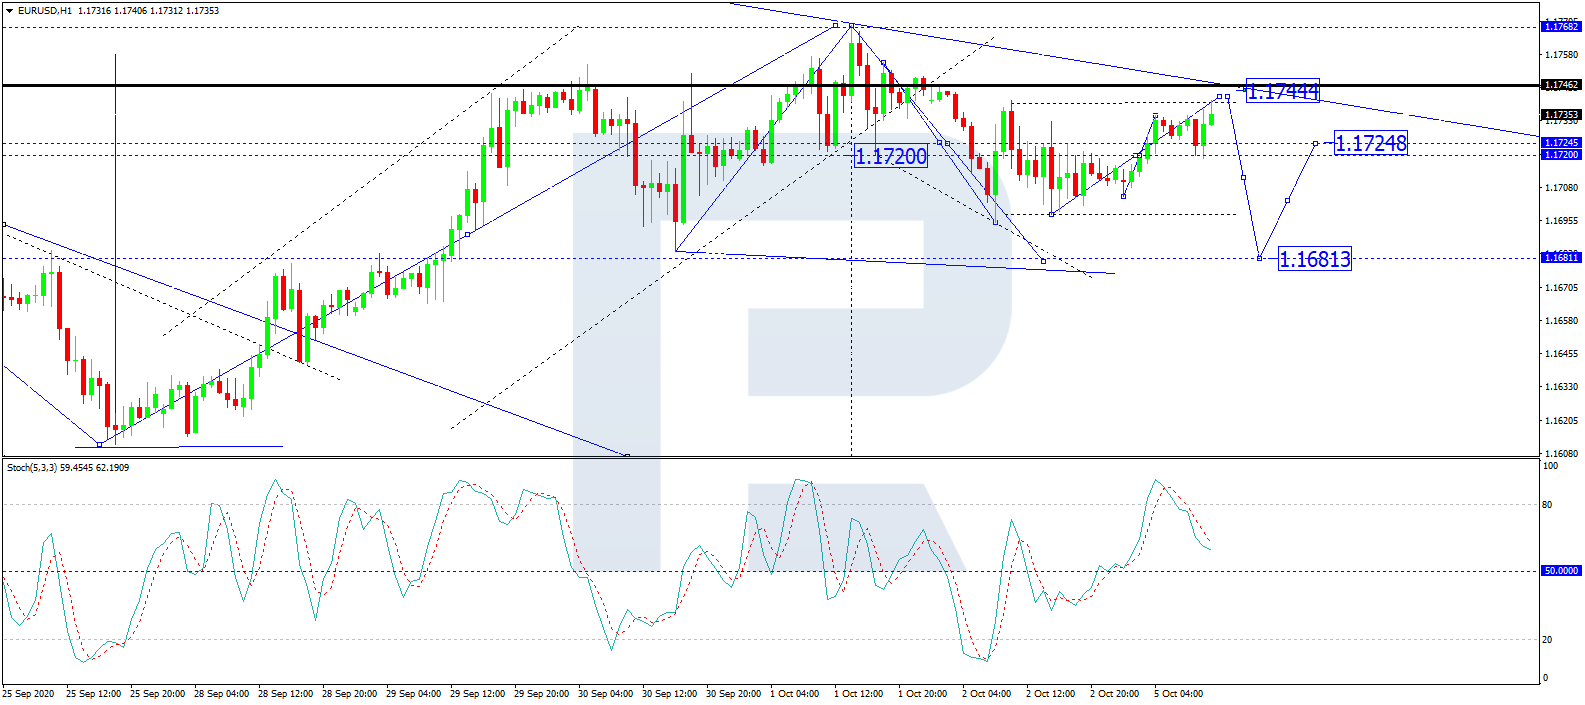
As we can see in the H1 chart, after completing two descending impulses towards 1.1695, EUR/USD is correcting to reach 1.1744. After that, the instrument may continue trading downwards with the first target at 1.1680. From the technical point of view, this scenario is confirmed by Stochastic Oscillator: after breaking 80 to the downside, its signal line is moving downwards steadily. Later, it may continue falling to reach and break 50. After the line break 50, the asset may boost its decline on the price chart.
Disclaimer
Any forecasts contained herein are based on the author’s particular opinion. This analysis may not be treated as trading advice. RoboForex bears no responsibility for trading results based on trading recommendations and reviews contained herein.
By Hussein Sayed, Chief Market Strategist (Gulf & MENA), ForexTime
President Trump’s Covid-19 diagnosis caught markets by surprise on Friday and they sold off aggressively on the news, with the Dollar ticking higher against its major peers. Investors’ bracing for a month-long of uncertainty until election day are now having to deal with another variable, ’the President’s health’ and over the weekend, we received many contradictory reports on Trump’s current situation. Overall, his condition appears to be better than previously thought, especially if he is discharged from the Walter Reed National Military Medical Centre later today.
Meanwhile, former Vice President and Democratic challenger Joe Biden continues to expand his lead in national polls. According to the NBC News/Wall Street Journal poll released on Sunday, Biden is now 14 percentage points ahead of Trump compared to 8 per cent a month ago. This poll was taken after Tuesday’s Presidential debate but before Trump’s diagnosis, so it could take a few more days to find out how the incumbent’s illness will sway American voting choices, especially in the key swing states.
US stock futures indicate a positive start for the day with the Dow Jones Industrial Average up more than 200 points and Nasdaq 100 up 1%, following the more than 2% decline on Friday. Stocks in Asia and Europe are also trading higher. While Trump’s improving health may be an element in the better sentiment, it is not the dominant factor. Chances are high that several cities across the globe will reinstate some lockdowns, and possibly national lockdowns if the virus continues to expand rapidly. New York City already announced plans to reinstate some lockdowns in Brooklyn and Queens, Paris raised its alert to maximum and will shut bars completely from tomorrow, and the UK is likely to take new measures as the country continues to battle with a second wave. These are alarming signals.
Last week, the chances of a new stimulus package were close to zero as Trump’s illness, weaker jobs data and the announcements of tens of thousands of layoffs added serious concerns to the US administration. However, upbeat market performance today is driven by hopes of a package in the US before the elections. This is not yet priced into markets but if new convincing fiscal measures are announced this week, expect to see a further rally in risk assets and some pressure on the US dollar.
Disclaimer: The content in this article comprises personal opinions and should not be construed as containing personal and/or other investment advice and/or an offer of and/or solicitation for any transactions in financial instruments and/or a guarantee and/or prediction of future performance. ForexTime (FXTM), its affiliates, agents, directors, officers or employees do not guarantee the accuracy, validity, timeliness or completeness, of any information or data made available and assume no liability as to any loss arising from any investment based on the same.
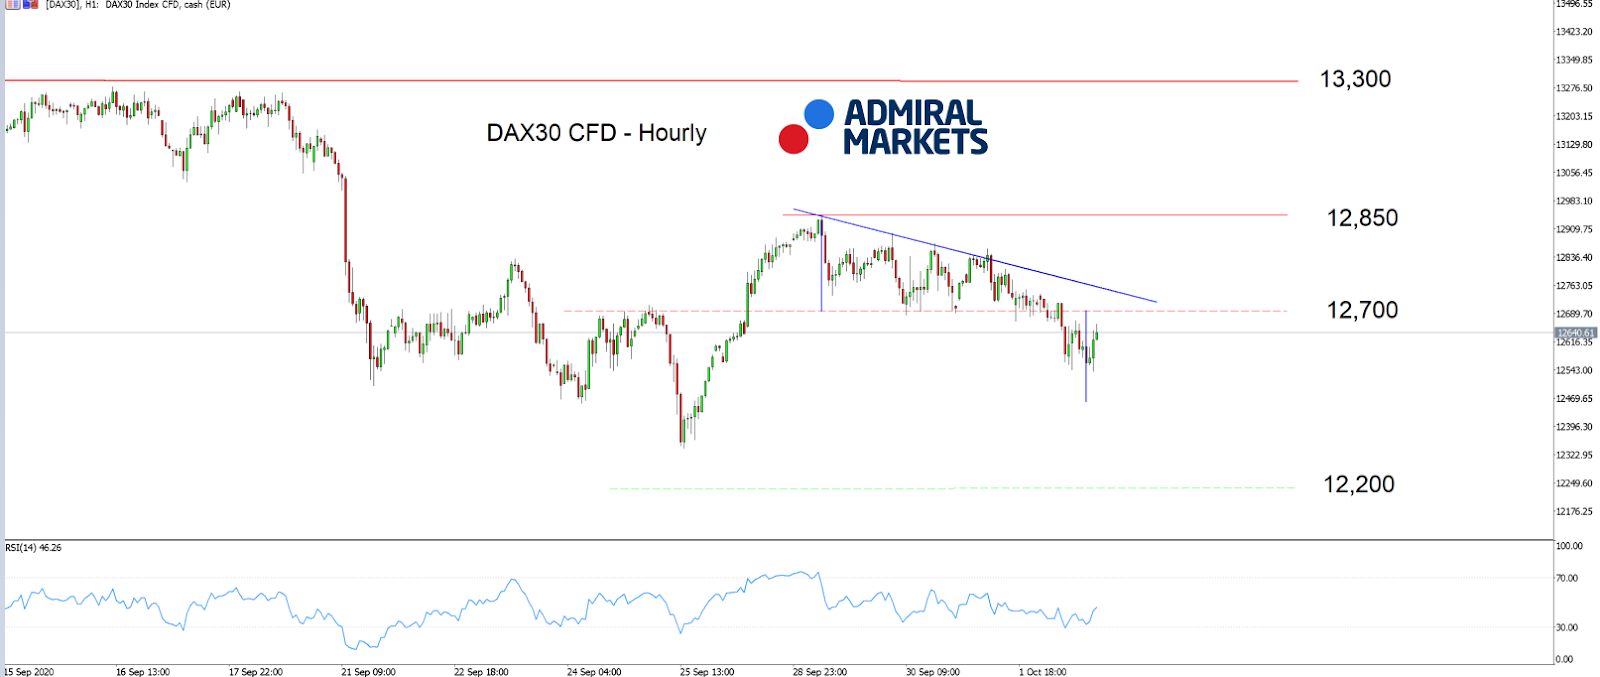
The German DAX30 found itself in a trading range between 12,700 and 12,900 points for most of last week after a bullish run last week on Monday.
A break below the “make-or-break” level on the downside was initiated last Friday, potentially driven by the news that US President Trump got Coronavirus, resulting in uncertainty among market participants.
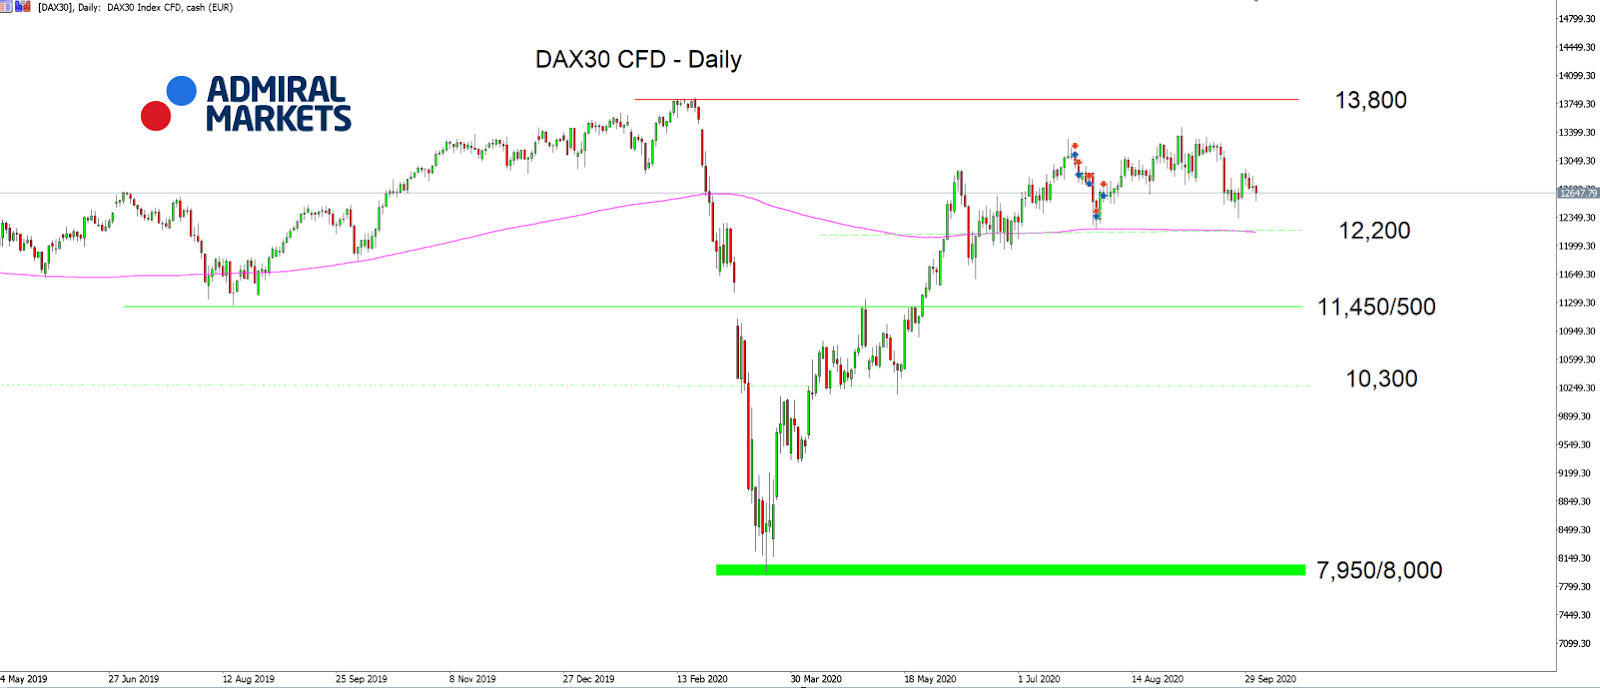
Technically, the drop is clearly a bearish sign, potentially levelling the path down to 12,200 points with a stop-over at around 12,450/470 points.
At around 12,200 points we find the SMA(200) on a daily time-frame. Therefore, it is a key level that could, if broken, add further fuel.
In addition to the technical side:
There is a known bearish seasonality in October in US presidential election years (usually October is a bullish month for Equities)
There is also very low volatility in bond markets (currently, interest rate volatility is at an all-time low; in the past, such low volatility was usually followed by a sharp push higher with a sell-off of stocks)
The risk-reward ratio for short-term and mid-term Short engagements seems to be more attractive than for Long engagements.
Short-term our bearish outlook will brighten if bulls can sustainably recapture 12,850/900 points:
Source: Admiral Markets MT5 with MT5SE Add-on DAX30 CFD Hourly chart (between September 14, 2020, to October 02, 2020). Accessed: October 02, 2020, at 10:00 PM GMT
Source: Admiral Markets MT5 with MT5SE Add-on DAX30 CFD Daily chart (between May 14, 2019, to October 02, 2020). Accessed: October 02, 2020, at 10:00 PM GMT. Please note: Past performance is not a reliable indicator of future results, or future performance.
In 2015, the value of the DAX30 CFD increased by 9.56%, in 2016, it increased by 6.87%, in 2017, it increased by 12.51%, in 2018, it fell by 18.26%, in 2019, it increased by 26.44% meaning that in five years, it was up by 34.2%.
Check out Admiral Markets’ most competitive conditions on the DAX30 CFD and start trading on the DAX30 CFD with a low 0.8 point spread offering during the main Xetra trading hours.
Discover the world’s #1 multi-asset platform
Admiral Markets offers professional traders the ability to trade with MetaTrader 5, allowing you to experience trading at a significantly higher, more rewarding level than with MetaTrader 4. Experience benefits such as the addition of the Market Heat Map, so you can compare various currency pairs to see which ones might be lucrative investments, access real-time trading data, and so much more. Click the banner below to start your FREE download of MT5!
Disclaimer: The given data provides additional information regarding all analysis, estimates, prognosis, forecasts or other similar assessments or information (hereinafter “Analysis”) published on the website of Admiral Markets. Before making any investment decisions please pay close attention to the following:
This is a marketing communication. The analysis is published for informative purposes only and is in no way to be construed as investment advice or recommendation. It has not been prepared in accordance with legal requirements designed to promote the independence of investment research, and that it is not subject to any prohibition on dealing ahead of the dissemination of investment research.
Any investment decision is made by each client alone whereas Admiral Markets shall not be responsible for any loss or damage arising from any such decision, whether or not based on the Analysis.
Each of the Analysis is prepared by an independent analyst (Jens Klatt, Professional Trader and Analyst, hereinafter “Author”) based on the Author’s personal estimations.
To ensure that the interests of the clients would be protected and objectivity of the Analysis would not be damaged Admiral Markets has established relevant internal procedures for prevention and management of conflicts of interest.
Whilst every reasonable effort is taken to ensure that all sources of the Analysis are reliable and that all information is presented, as much as possible, in an understandable, timely, precise and complete manner, Admiral Markets does not guarantee the accuracy or completeness of any information contained within the Analysis. The presented figures that refer to any past performance is not a reliable indicator of future results.
The contents of the Analysis should not be construed as an express or implied promise, guarantee or implication by Admiral Markets that the client shall profit from the strategies therein or that losses in connection therewith may or shall be limited.
Any kind of previous or modelled performance of financial instruments indicated within the Publication should not be construed as an express or implied promise, guarantee or implication by Admiral Markets for any future performance. The value of the financial instrument may both increase and decrease and the preservation of the asset value is not guaranteed.
The projections included in the Analysis may be subject to additional fees, taxes or other charges, depending on the subject of the Publication. The price list applicable to the services provided by Admiral Markets is publicly available from the website of Admiral Markets.
Leveraged products (including contracts for difference) are speculative in nature and may result in losses or profit. Before you start trading, you should make sure that you understand all the risks.
Equities are advancing currently on reports President Trump may leave hospital today after markets ended a bullish week last Friday. Tesla shares fell 7.37% underperforming market despite report it delivered 139,300 vehicles in the third quarter, shares of Apple lost 3.22%, underperforming market too.
Forex news
Currency Pair
Change
EUR USD
-0.19%
GBP USD
+0.12%
USD JPY
-0.09%
The Dollar strengthening has halted currently . The live dollar index data show the ICE US Dollar index, a measure of the dollar’s strength against a basket of six rival currencies, rose 0.1% Friday despite Bureau of Labor Statistics report US economy created 661,000 new jobs in September, when creation of 900,000 new jobs were expected. EUR/USD reversed its climbing Friday while GBP/USD moved higher as euro-zone consumer prices deflation accelerated in September. Euro is higher currently while Pound is lower against the dollar. AUD/USD and USD/JPY reversed their climbing Friday with the dynamics reversed for both currently.
Stock Market news
Indices
Change
Dow Jones Index
+0.14%
Nikkei Index
+1.23%
Australian Stock Index
+2.58%
Hang Seng Index
+0.72%
Futures on US equity benchmarks are up currently ahead of ISM Non-Manufacturing PMI report at 18:00 CET today. The three main US stock indexes recorded weekly gains ranging from 1.5% to 1.9% on Friday. European stock indexes are rebounding currently after a bearish session Friday led by chemical shares as data showed international tourist arrivals to Spain fell 76% over year in August. Asian indexes are rising today led by Australia’s All Ordinaries ASX 200 Index on strong retail sales report with mainland China’s markets closed for a weeklong holiday.
Commodity Market news
Commodities
Change
Brent Crude Oil
+1.28%
WTI Crude
+2.12%
Brent is edging higher today. Oil prices ended down last session. The US oil benchmark West Texas Intermediate (WTI) futures are higher currently after November WTI dropped 4.3% Friday. December Brent crude lost 4.1% to $39.27 a barrel on Friday.
Gold Market News
Metals
Change
Gold
-0.68%
Gold prices are extending losses today. December gold fell 0.5% to $1907.60 an ounce on Friday.
Large currency speculators decreased their bearish net positions in the US Dollar Index futures markets this week, according to the latest Commitment of Traders (COT) data released by the Commodity Futures Trading Commission (CFTC) on Friday.
The non-commercial futures contracts of US Dollar Index futures, traded by large speculators and hedge funds, totaled a net position of -5,555 contracts in the data reported through Tuesday September 29th. This was a weekly improvement by 3,591 contracts from the previous week which had a total of -9,146 net contracts.
This week’s net position was the result of the gross bullish position (longs) growing by 2,908 contracts (to a weekly total of 14,840 contracts) compared to the gross bearish position (shorts) which saw a reduction by -683 contracts on the week (to a total of 20,395 contracts).
US Dollar Index speculators reduced their bearish bets this week following two straight weeks of rising bearish positions that had brought the overall standing to the lowest level in 147 weeks. The +3,591 net contracts this week marks the best one-week gain in 27 weeks, dating back to March 24th. The overall speculator standing remains in a bearish position for the 16th consecutive week but has now improved to the least bearish level of the past eleven weeks.
Individual Currencies Data this week:
In the other major currency contracts data, we saw two substantial changes (+ or – 10,000 contracts) in the speculators category this week.
The British pound sterling dropped sharply by over -15,000 contracts this week. This sharp decline pushed the overall net position back into bearish territory for the first time in the past seven weeks. The messy Brexit divorce from the EU is weighing on the pound and has pushed the GBPUSD currency pair back under the 1.30 exchange rate.
Mexican peso positions fell by over -14,000 contracts this week following four straight weeks of gains. The peso speculator position remains in bullish territory for the sixteenth straight week after a short spell in a bearish position in May and June. Overall, peso bets are in a small bullish level (+12,636 contracts) and down from stronger bullish levels in early 2020 that included an all-time record high of +170,366 contracts on January 28th.
Overall, the major currencies that saw improving speculator positions this week was just the US dollar index (3,591 weekly change in contracts).
The currencies whose speculative bets declined this week were the euro (-2,706 weekly change in contracts), British pound sterling (-15,709 contracts), Japanese yen (-4,792 contracts), Swiss franc (-3,175 contracts), Canadian dollar (-66 contracts), Australian dollar (-7,402 contracts), New Zealand dollar (-1,531 contracts) and the Mexican peso (-14,014 contracts).
Chart: Current Strength of Each Currency compared to their 3-Year Range
The above chart depicts each currency’s current speculator strength level compared to data of the past 3 years. A score of 0 percent would mean speculator bets are currently at the lowest level of the past three years. A 100 percent score would be at the highest level while a 50 percent score would mean speculator bets are right in the middle of the data (a neutral score). We use above 80 percent (extreme bullish) and below 20 percent (extreme bearish) as extreme score measurements.
Please see the data table and individual currency charts below.
Table of Large Speculator Levels & Weekly Changes:
Currency
Net Speculator Position
Specs Weekly Change
USD Index
-5,555
3,591
EuroFx
188,116
-2,706
GBP
-12,745
-15,709
JPY
24,789
-4,792
CHF
12,741
-3,175
CAD
-18,948
-66
AUD
8,937
-7,402
NZD
3,329
-1,531
MXN
12,636
-14,014
This latest COT data is through Tuesday and shows a quick view of how large speculators or non-commercials (for-profit traders) were positioned in the futures markets. All currency positions are in direct relation to the US dollar where, for example, a bet for the euro is a bet that the euro will rise versus the dollar while a bet against the euro will be a bet that the dollar will gain versus the euro.
Weekly Charts: Large Trader Weekly Positions vs Price
EuroFX:
The Euro large speculator standing this week recorded a net position of 188,116 contracts in the data reported through Tuesday. This was a weekly fall of -2,706 contracts from the previous week which had a total of 190,822 net contracts.
British Pound Sterling:
The large British pound sterling speculator level was a net position of -12,745 contracts in the data reported this week. This was a weekly decrease of -15,709 contracts from the previous week which had a total of 2,964 net contracts.
Japanese Yen:
Large Japanese yen speculators equaled a net position of 24,789 contracts in this week’s data. This was a weekly reduction of -4,792 contracts from the previous week which had a total of 29,581 net contracts.
Swiss Franc:
The Swiss franc speculator standing this week reached a net position of 12,741 contracts in the data through Tuesday. This was a weekly fall of -3,175 contracts from the previous week which had a total of 15,916 net contracts.
Canadian Dollar:
Canadian dollar speculators totaled a net position of -18,948 contracts this week. This was a decrease of -66 contracts from the previous week which had a total of -18,882 net contracts.
Australian Dollar:
The large speculator positions in Australian dollar futures totaled a net position of 8,937 contracts this week in the data ending Tuesday. This was a weekly lowering of -7,402 contracts from the previous week which had a total of 16,339 net contracts.
New Zealand Dollar:
The New Zealand dollar speculative standing totaled a net position of 3,329 contracts this week in the latest COT data. This was a weekly decline of -1,531 contracts from the previous week which had a total of 4,860 net contracts.
Mexican Peso:
Mexican peso speculators recorded a net position of 12,636 contracts this week. This was a weekly reduction of -14,014 contracts from the previous week which had a total of 26,650 net contracts.
*COT Report: The COT data, released weekly to the public each Friday, is updated through the most recent Tuesday (data is 3 days old) and shows a quick view of how large speculators or non-commercials (for-profit traders) were positioned in the futures markets.
The CFTC categorizes trader positions according to commercial hedgers (traders who use futures contracts for hedging as part of the business), non-commercials (large traders who speculate to realize trading profits) and nonreportable traders (usually small traders/speculators).
This week – October 5 through October 10 – central banks from 8 countries or jurisdictions are scheduled to decide on monetary policy: Australia, Iceland, Poland, Albania, Peru, Serbia, Botswana and Uganda.
Sri Lanka’s central bank had scheduled a review of monetary policy for Oct. 8 but on Sept. 28 it said this had been rescheduled to Oct. 16 at 07:30 local. Romania’s central bank had also originally scheduled a monetary policy meeting for Oct. 5 but decided in March to suspend any previously scheduled meetings due to what it said was elevated uncertainty surrounding economic and financial developments and hold policy meetings whenever necessary. Following table includes the name of the country, the date of the next policy decision, the current policy rate, the result of the last policy decision, the change in the policy rate year to date, and the rate one year ago. The table is updated when the latest decisions are announced and can always accessed by clicking on This Week.








 Article by
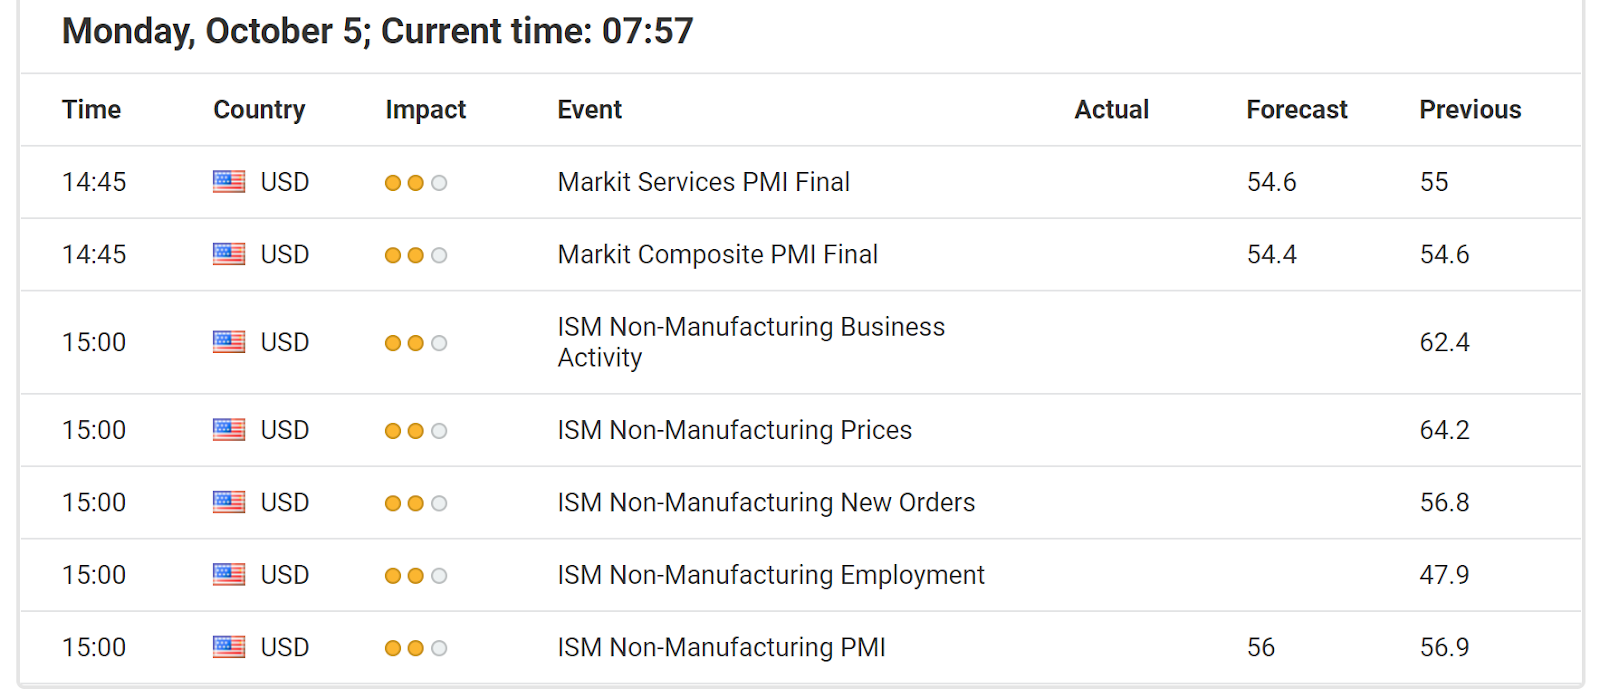 Source: Economic Events October 05, 2020 –
  Source: Admiral Markets MT5 with MT5SE Add-on DAX30 CFD Hourly chart (between September 14, 2020, to October 02, 2020). Accessed: October 02, 2020, at 10:00 PM GMT
 Source: Admiral Markets MT5 with MT5SE Add-on DAX30 CFD Daily chart (between May 14, 2019, to October 02, 2020). Accessed: October 02, 2020, at 10:00 PM GMT. Please note: Past performance is not a reliable indicator of future results, or future performance.




