The Week Ahead: Extra Time

By Orbex

GBPCHF Struggles on No-Deal Prospect

Trading the pound Sterling certainly is not for the faint-hearted these days. With only two weeks to go before the end of the transition period, London and Brussels are yet to clinch a deal.

While a hard Brexit has become a reality by default – a synonym for the pound’s demise, extending the deadline could be the last and pretty familiar resort. Don’t be surprised if the pound’s quote swings around in the next few days. Traders are still trying to take the right side before closing the book for the year.

The pair is falling towards the major support level of 1.1600. Below that, 1.13s could become the next pricing range.

USDCAD Softens to 2018 Lows

The US dollar’s downward spiral may last longer than bulls can hold their breath. There is no sign of a meaningful rebound yet, whether fundamental or technical wise.

The Federal Reserve is expected to refrain from additional measures, even if the Treasury’s fiscal stimulus might not be under the Christmas tree this year. The central bank may issue marginal tweaks to its guidance. However, the lack of a hawkish tone will probably keep the greenback as a target for bearish trend followers.

The pair is heading towards April 2018’s low of 1.2540. Any bounce will stay temporary unless it can lift offers around 1.3000.

EURNZD Weakens as Risk-Taking Prevails

The latest rally in the euro could be short-lived as investors’ mood still favors growth-related assets. Any correction in the kiwi is seen as a buying opportunity, as recent troughs were followed by new tops. A recovering Chinese economy and rising commodity prices have offered effective tailwinds to New Zealand.

As the pair is tanking towards this year’s lows, traders are looking for more catalysts to push even further. That could be the case if New Zealand’s growth figure shows resilience this Wednesday.

1.7000 acts as a psychological support level but a bearish breakout could send the exchange rate to 1.6800.

AUDCAD Climbs on Recovery Optimism

Despite souring relations with China, which is rolling out tariffs on a number of Australian exports, the Aussie still keeps its lead across the board.

As global optimism reached a new high following the release of the Covid vaccine, risk-on sentiment has sent asset prices into over-bought territories. Surging commodity prices and the RBA’s firm stance in keeping the rates intact have helped the country’s currency consolidate its gains.

Should Australia’s jobs data show signs of improvement this week, the pair may finally rise above the triple top of 0.9650.

In the case of a retracement, 0.9460 is a key support to maintain the bullish mood.

By Orbex

Japanese Candlesticks Analysis 14.12.2020 (USDCAD, AUDUSD, USDCHF)

Article By RoboForex.com

USDCAD, “US Dollar vs Canadian Dollar”

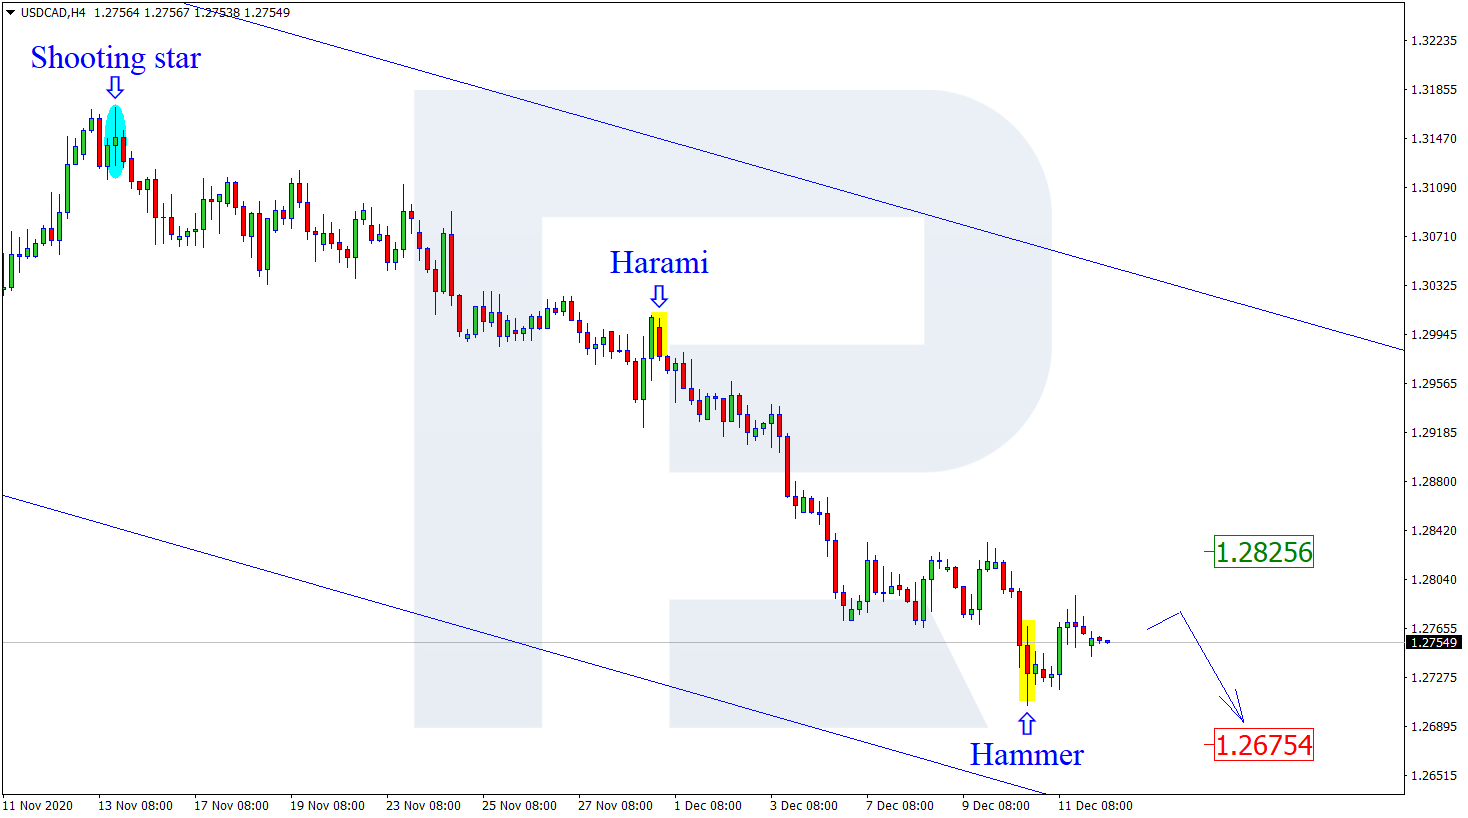
As we can see in the H4 chart, the pair is still moving within the descending tendency. Right now, after forming several reversal patterns, such as Hammer, not far from the support level, USDCAD has reversed in the form of another correction and may later continue falling within the descending channel. in this case, the downside target will be at 1.2675. However, an alternative scenario implies that the price may start a new pullback to return to 1.2825 before resuming the downtrend.

USDCAD
Risk Warning: the result of previous trading operations do not guarantee the same results in the future

AUDUSD, “Australian Dollar vs US Dollar”

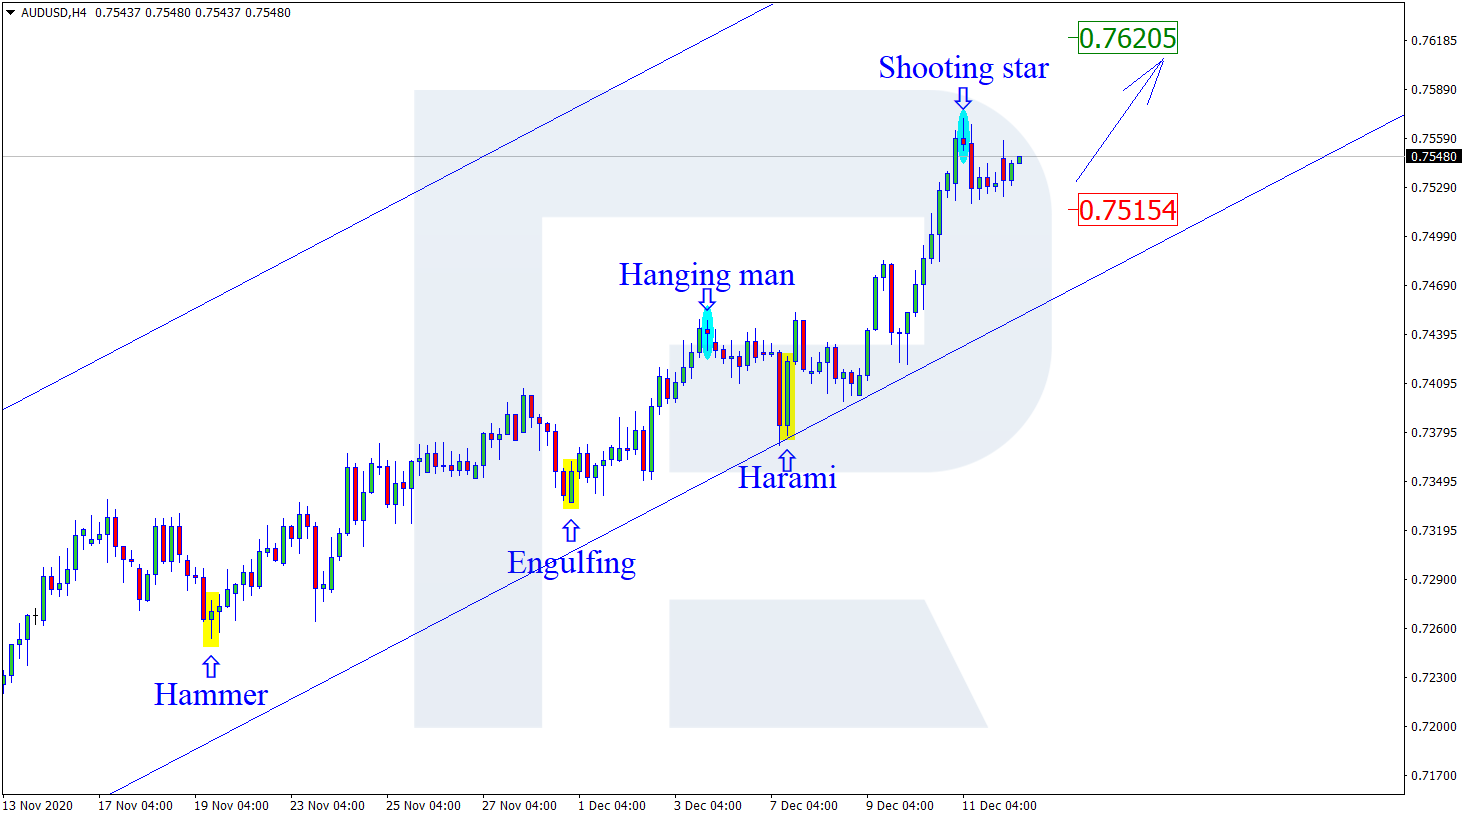
As we can see in the H4 chart, after forming a Shooting Star pattern and reversing, AUDUSD continues growing within the rising channel. In this case, the upside target will be the next resistance level at 0.7620. At the same time, an opposite scenario says that the price may continue falling to return to 0.7515 before resuming its growth and updating highs.

AUDUSD
Risk Warning: the result of previous trading operations do not guarantee the same results in the future

USDCHF, “US Dollar vs Swiss Franc”

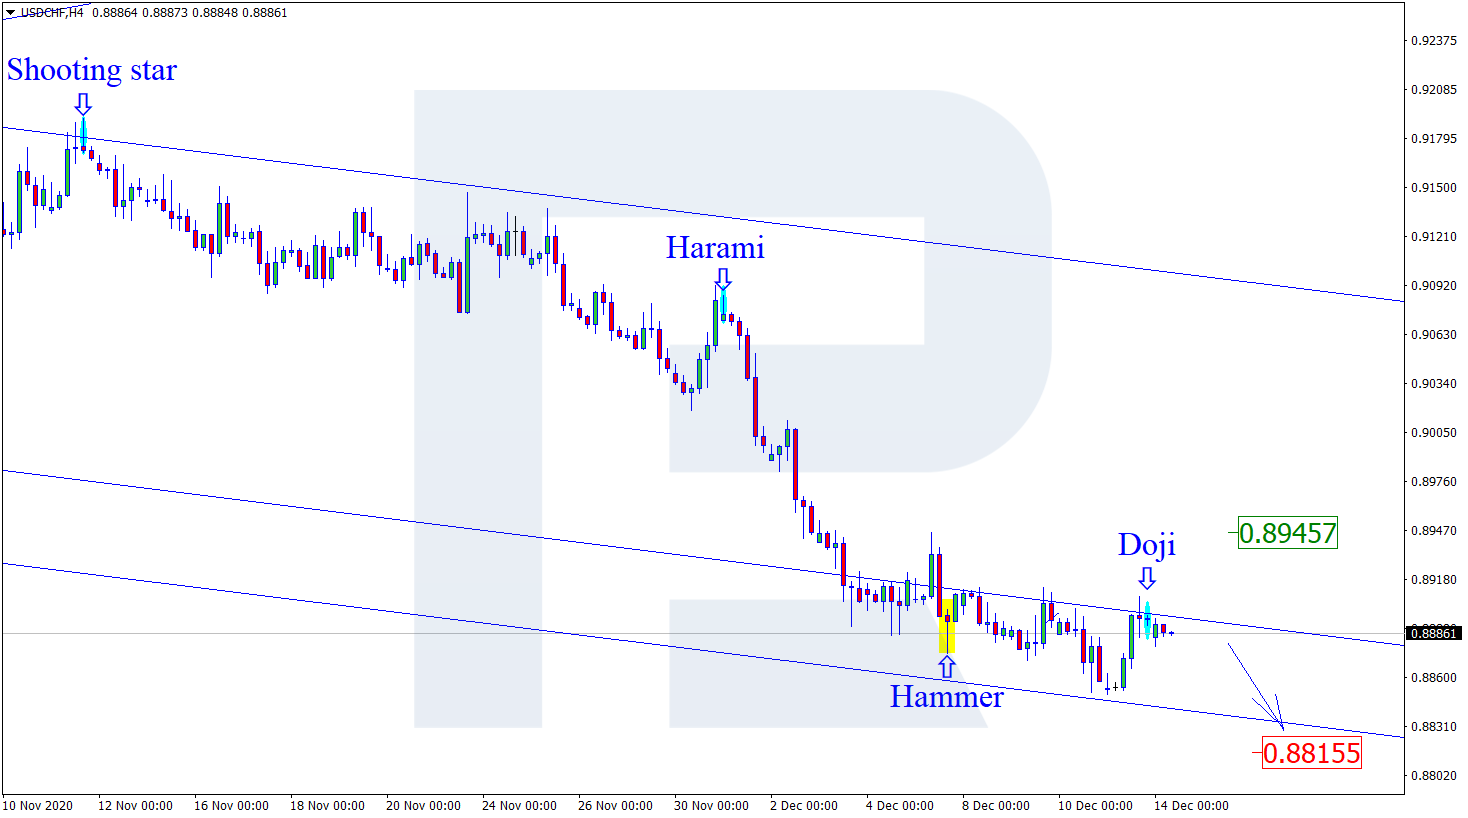
As we can see in the H4 chart, after breaking the descending channel’s downside border and forming several reversal patterns, such as Doji, not far from the support area, USDCHF may later resume the descending tendency. In this case, the next downside target may be the support area at 0.8815. Still, there might be an alternative scenario, according to which the asset may return to 0.8945 before resuming its decline.

USDCHF

Article By RoboForex.com

Attention!
Forecasts presented in this section only reflect the author’s private opinion and should not be considered as guidance for trading. RoboForex LP bears no responsibility for trading results based on trading recommendations described in these analytical reviews.

Fibonacci Retracements Analysis 14.12.2020 (GOLD, USDCHF)

Article By RoboForex.com

XAUUSD, “Gold vs US Dollar”

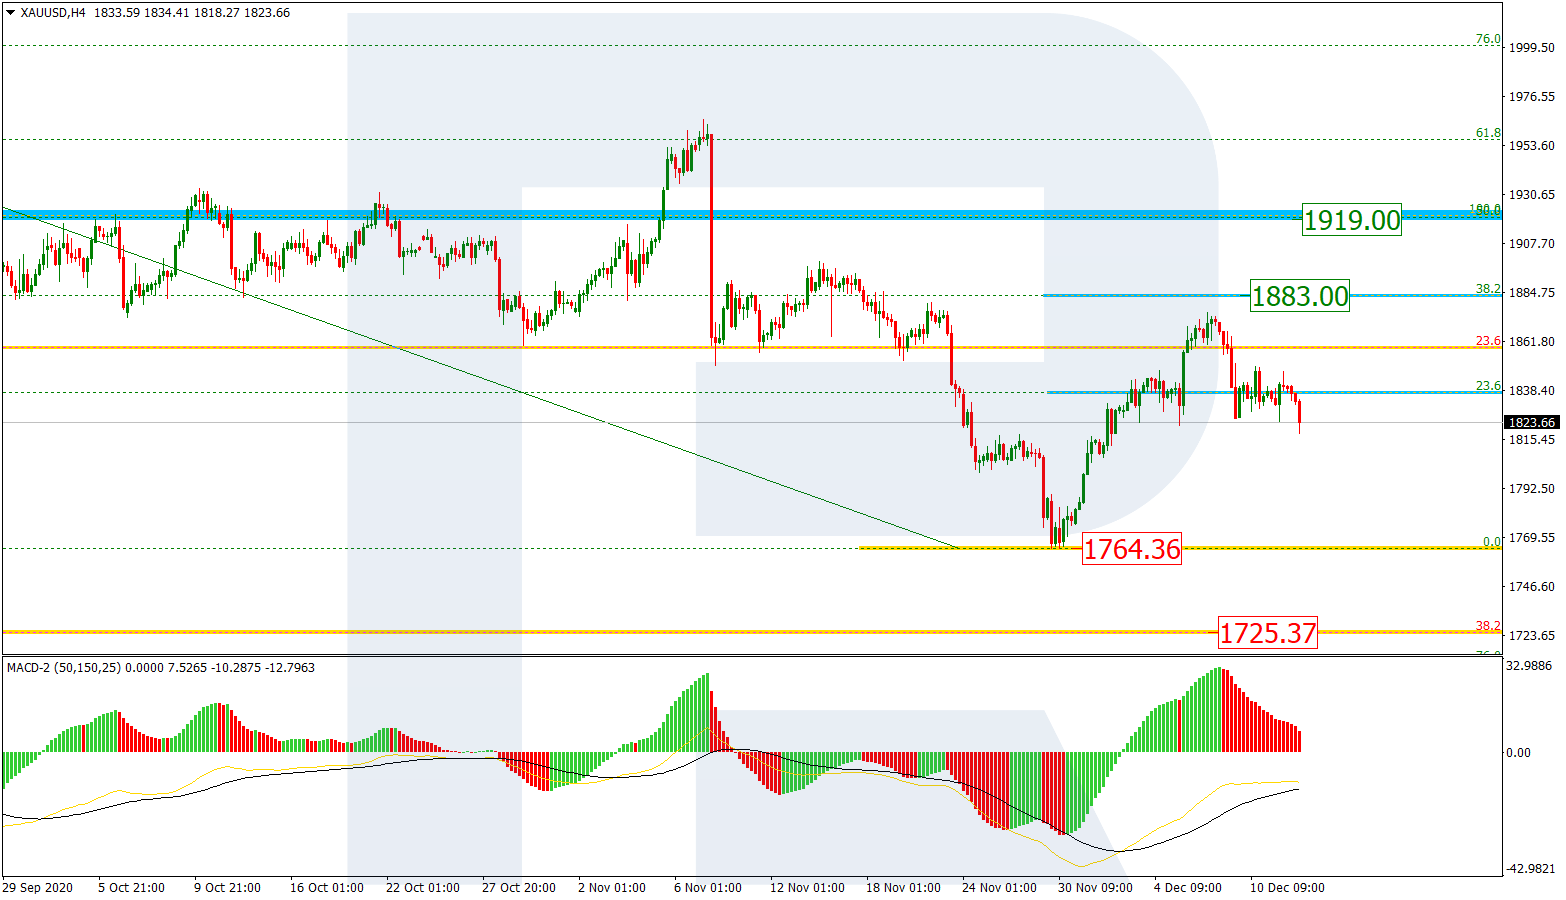
From the technical point of view, the H4 chart shows that the correctional uptrend has failed to reach 38.2% fibo at 1883.00. Right now, XAUUSD is forming another descending impulse towards the previous low at 1764.36. However, as long as the price is moving above the low, the asset may yet grow to reach 38.2% and 50.0% fibo at 1883.00 and 1919.00 respectively. On the other hand, a breakout of the low will allow the pair to continue its mid-term downtrend towards 38.2% fibo at 1725.37.

GOLD_H4
Risk Warning: the result of previous trading operations do not guarantee the same results in the future

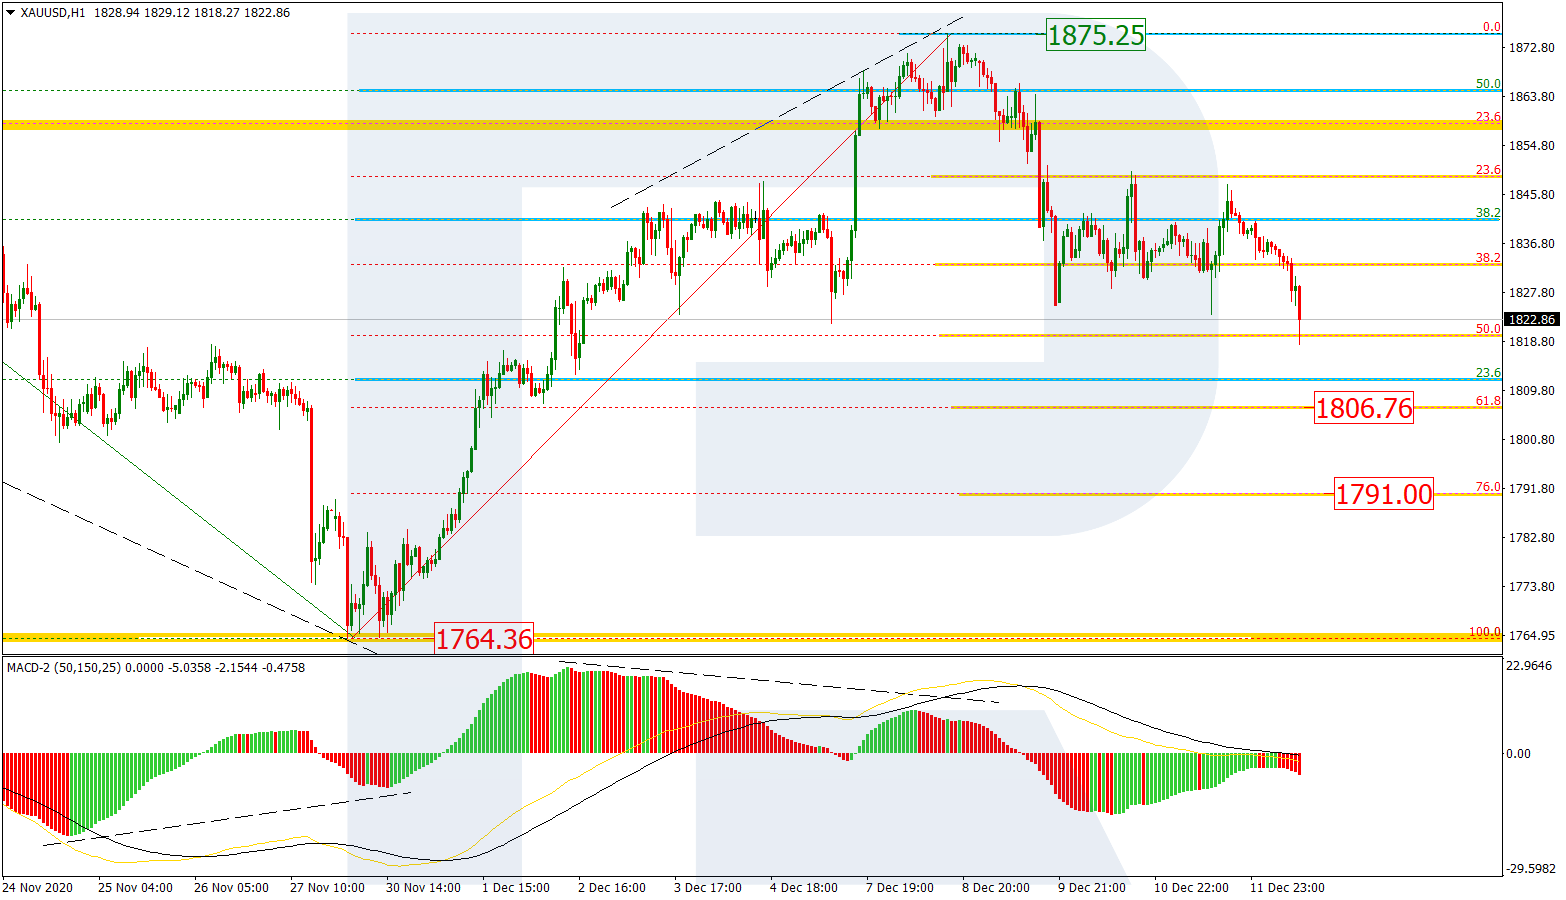
The H1 chart shows a more detailed structure of the current descending impulse after a divergence on MACD. By now, it has already broken 50.0% fibo and may later continue towards 61.8% and 76.0% fibo at 1806.76 and 1791.00 respectively, and then the low at 1764.36. However, a breakout of the local high at 1875.25 will result in further mid-term correction to the upside.

GOLD_H1
Risk Warning: the result of previous trading operations do not guarantee the same results in the future

USDCHF, “US Dollar vs Swiss Franc”

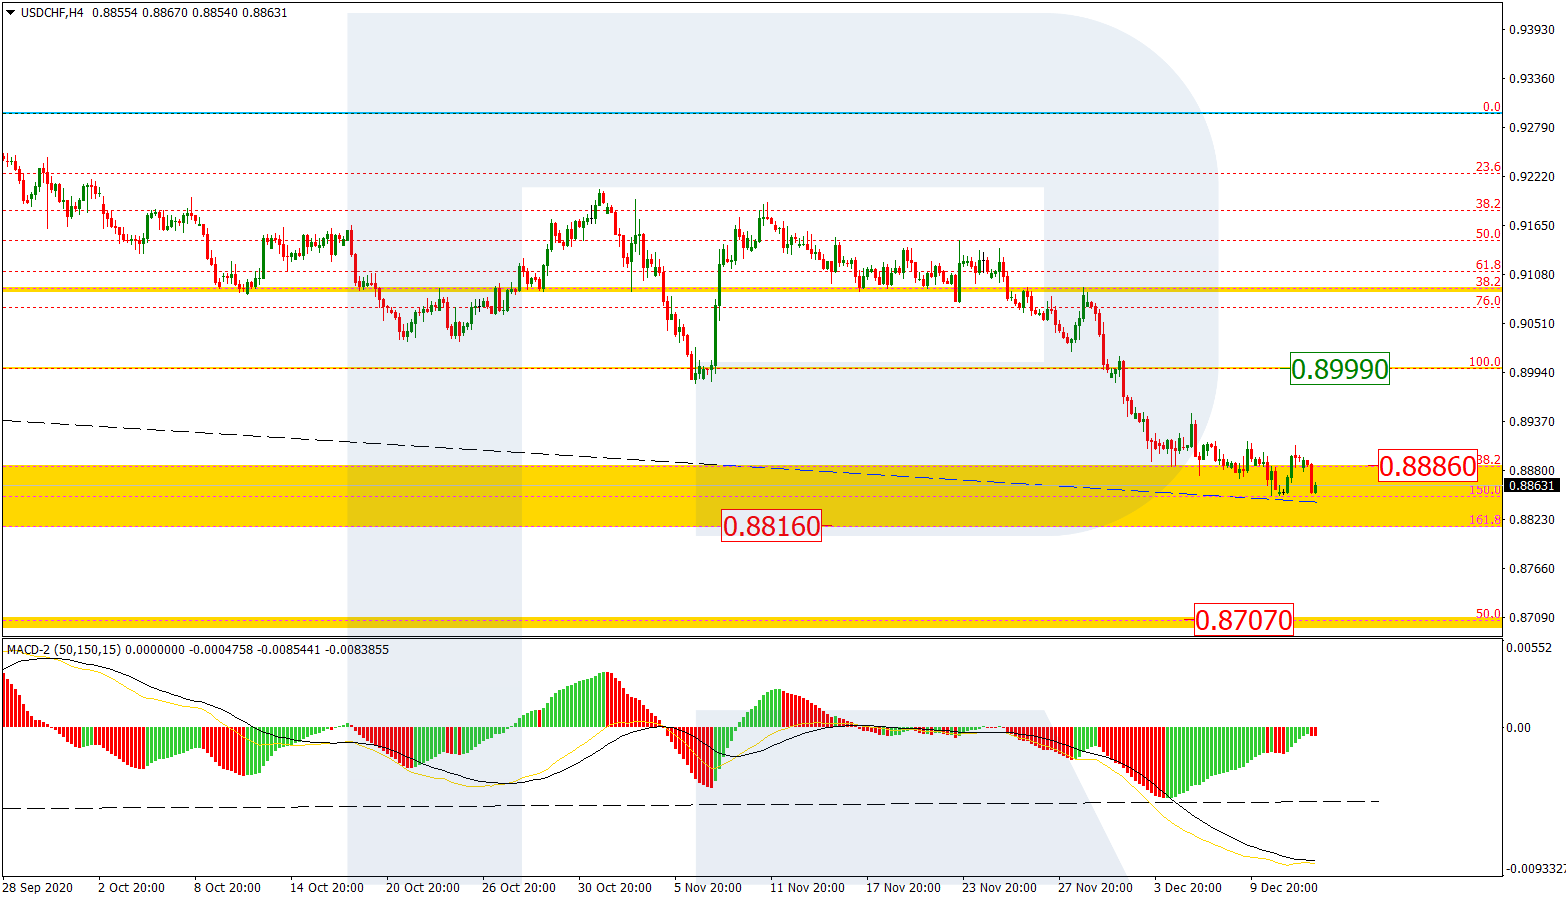
As we can see in the H4 chart, the descending tendency continues. After breaking 0.8999, USDCHF has entered the post-correctional extension area between 138.2% and 161.8% fibo at 0.8886 and 0.8816 respectively. The key downside target is the long-term 50.0% fibo at 0.8707. The resistance is at 0.8999. At the same time, a local convergence on MACD says that a new pullback may start at any moment.

USDCHF_H4
Risk Warning: the result of previous trading operations do not guarantee the same results in the future

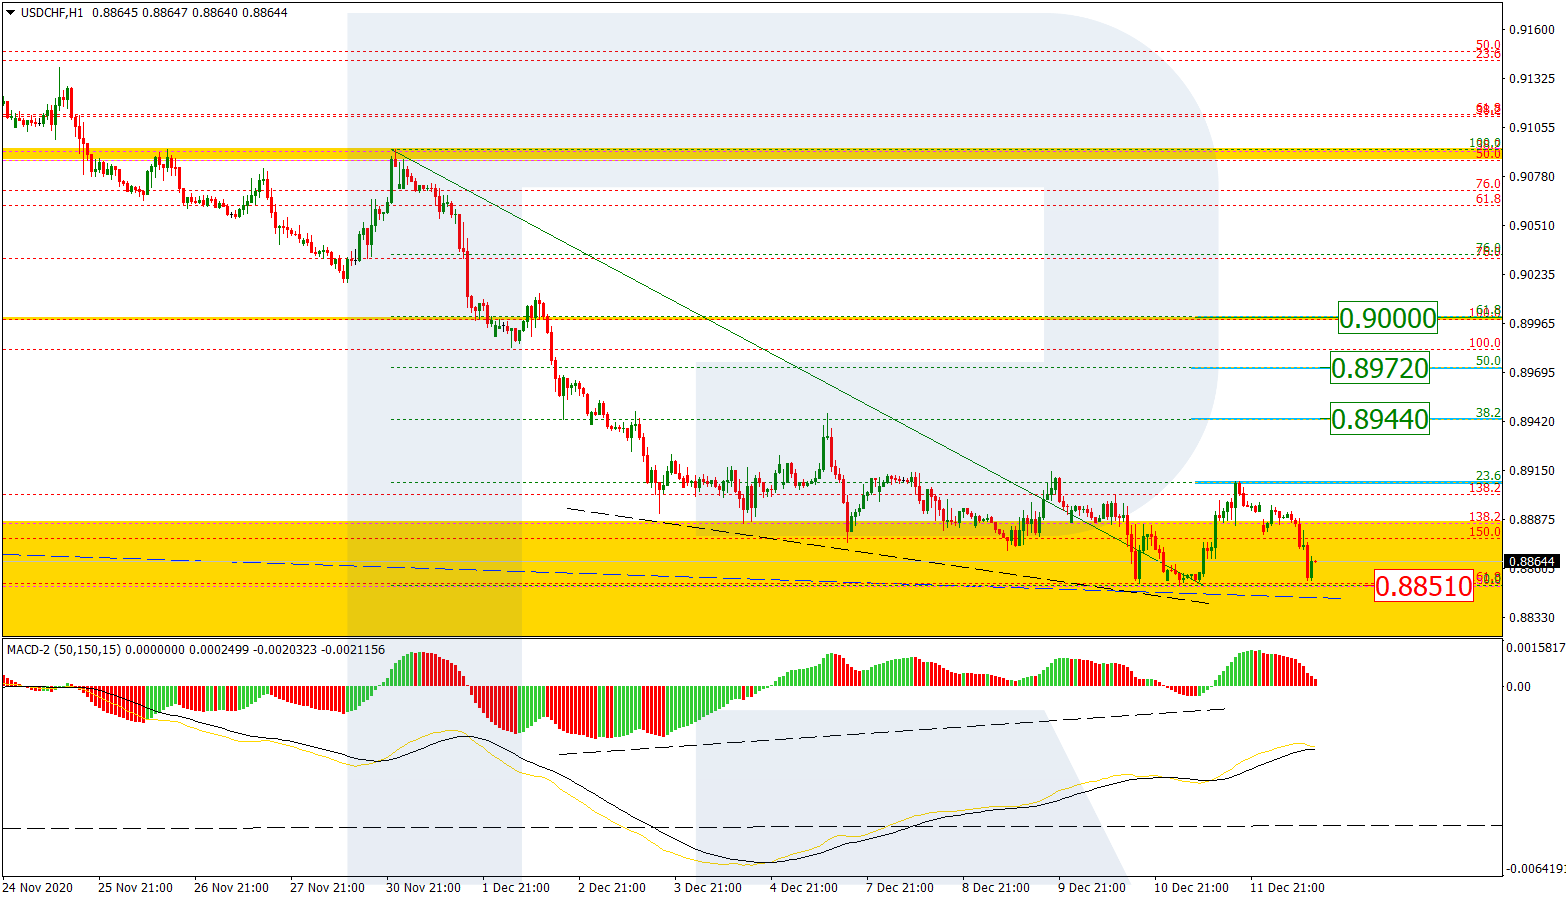
In the H1 chart, the pair is correcting upwards after a convergence on MACD, and has already reached 23.6% fibo. Later, the market may continue growing towards 38.2%, 50.0%, and 61.8% fibo at 0.8944, 0.8972, and 0.9000 respectively. A breakout of the support at 0.8851 will complete this local correction and result in a further mid-term downtrend.

USDCHF_H1

Article By RoboForex.com

Attention!
Forecasts presented in this section only reflect the author’s private opinion and should not be considered as guidance for trading. RoboForex LP bears no responsibility for trading results based on trading recommendations described in these analytical reviews.

Weekly Fundamental Bulletin: A Busy Week Ahead Of The Holidays

By Orbex

Last week’s highlights

China’s consumer prices fall for the first time in eleven years

The latest inflation data from China showed a drop in consumer prices. This was the first drop in headline CPI since 2009, according to official data released last week.

Inflation in China fell by 0.5% on a year over year basis in November. This followed a 0.5% increase in the month before.

The decline came noticeably on the back of weaker pork prices which fell by 2% annually.

Core inflation data, which strips out the volatile food and energy prices, came in at a 0.5% increase from the year before.

UK GDP growth slows in October

The latest GDP report from the UK showed a six-month continuous expansion. However, the pace of economic expansion slowed considerably in October.

Data from the UK’s Office for National Statistics showed that the economy rose 0.4% on a month over month basis. This was slower compared to the 1.1% increase in September.

Construction output grew one percent on the month after a 2.9% increase in the previous month. Meanwhile, manufacturing growth improved from 0.5% in September to 1.3% in October.

US consumer prices rise by 0.2% in November

The latest inflation data from the United States showed a modest increase in consumer prices.

Official data from the Labor Department showed an increase of 0.2% in November. This follows a flat reading for October.

The uptick in consumer prices was in line with the estimates. The core inflation rate, which excludes volatile food and energy prices, rose by 0.2% in November. This follows a flat reading in the month before.

Economists had forecast that the core inflation rate would rise by 0.1%.

Bank of Canada keeps rates steady

The Bank of Canada held its monetary policy meeting last week.

As widely expected, the central bank left interest rates unchanged. It also kept its forward guidance unchanged at the meeting.

In the statement, the BoC said that it expects the new wave of infection to hurt recovery in the global economy.

The central bank said that it would continue to maintain an accommodative monetary policy.

The BoC said that rates would remain near the current levels until inflation rises back to the 2% inflation target set by the central bank.

ECB expands its bond purchases

The European central bank, as widely expected, increased its asset purchases at its meeting last week. The central bank held the key rates in place.

The main refinancing operations, the marginal lending facility, and the deposit facility remained at 0.00%, 0.25%, and -0.50% respectively.

The central bank expanded its bond purchases by an additional 500 billion euros amid a second wave of infections in Europe.

While the euro initially slipped ahead of the meeting, it managed to rebound after the central bank’s decision.

Upcoming Economic Events

US November retail sales to test consumer resilience

The monthly retail sales report from the US will be coming out this week. Data from the Department of Commerce could essentially show the resilience of US consumers.

The month of November is also marked by the annual Black Friday sales. However, given the current pandemic, a lot of retail sales could have shifted to online purchases.

The estimates are a bit conservative. Economists forecast that retail sales excluding autos could rise by 0.2%, marking the same pace of increase as the previous month.

However, headline retail sales are forecast to shrink by 0.2%, after rising 0.3% in October. The report is likely to show more conservative spending during the month.

Investors look to the Fed meeting this week

Heading into the year-end, the Federal Reserve meeting will be the highlight.

The central bank will also be issuing its economic projections at this week’s meeting. The general market consensus is that the Federal Reserve will keep its stimulus unchanged.

Given the current deadlock in US Congress, the central bank may ramp up its rhetoric on more fiscal stimulus.

Overall, the central bank is unlikely to make any tweaks at the December meeting. It might, however, maintain a dovish stance in the market.

In terms of economic projections, the GDP projections might be due for an upgrade. The unemployment rate projections could also be tweaked to the hawkish side.

New Zealand Q3 GDP to rebound

New Zealand’s third-quarter GDP report is due this week.

Economists forecast a rebound in the economy on the lines of a 12% – 13% increase. This follows a 12% plunge in the second quarter.

The third-quarter economic performance is bound to recover almost all the losses from the previous quarter. The rebound would put New Zealand’s GDP almost close to pre-pandemic levels.

However, on a sub-sector basis, the differences are large. This includes sectors such as transport, hospitality, and administrative services.

The GDP report this week also includes revisions to the previous data going back several years.

Bank of Japan will likely extend corporate aid

The Bank of Japan will be meeting amid a rather busy week.

The week kicks off with the fourth quarter Tankan surveys. Both the manufacturing and non-manufacturing indexes are forecast to rebound from the third quarter.

On Friday, the BoJ is widely expected to extend its corporate aid. But the central bank could keep its interest rates and the yields on the JGB’s unchanged at this week’s meeting.

The measures to support the economy are due to expire in March. As a result, the BoJ could be looking to expand it into the second half of 2021.

The Bank of Japan eased monetary policy in March and April this year as it ramped up asset purchases, creating a new channel for lending for financial institutions.

By Orbex

The Analytical Overview of the Main Currency Pairs on 2020.12.14

by JustForex

The EUR/USD currency pair

Technical indicators of the currency pair:
  • Prev Open: 1.2140
  • Prev Close: 1.2112
  • % chg. over the last day: -0.23%

EUR/USD returns lost positions in the Asian session, but the overall picture isn’t changing. Since December 4, the currency pair has been stuck in a range and will consolidate after a monthly rally, indicating the possibility of further gains in the mid-term. Information about negotiations around the Brexit agreement supports the European currency, but the continuation of the upward trend is still in question.

Trading recommendations
  • Support levels: 1.2175, 1.2167
  • Resistance levels: 1.2059, 1.1924

The main scenario: buying on a decline. Technical indicators and fundamental background are still on the bulls’ side, but be cautious. First, the price is close to annual highs. Secondly, a break-through of 1.2175 is required to continue the trend. As long as the pair is above SMA 100 and SMA 50, the likelihood of a bullish breakout remains. The MACD is in the positive zone, Stochastic has reached the overbought zone and indicates an approaching pullback.

Alternative scenario: if the price fixes below the level of 1.2116 on the H1 timeframe, the currency pair is likely to decline to 1.2159.

EUR/USD

There is no news feed for today.

The GBP/USD currency pair

Technical indicators of the currency pair:
  • Prev Open: 1.3294
  • Prev Close: 1.3227
  • % chg. over the last day: -0.51%

Sterling regained its lost positions in the Asian session and remains bullish in the short term. Investors reacted positively to the information about the continuation of the negotiations. It is unlikely that this will be able to resume growth in the mid-term, but the likelihood of the sterling growth increased significantly.

Trading recommendations
  • Support levels: 1.3225, 1.3196
  • Resistance levels: 1.3407, 1.3477

The main scenario: buying on a decline. The price is stuck between the SMA 50 and SMA 100 levels, but the MACD has already moved into the positive zone, and the Stochastic has not reached the overbought level. The likelihood of the continuation of the northward movement remains high. The fixation above the moving average at 1.3327 of the H1 timeframe will strengthen the bullish signal.

Alternative scenario: if the price fixes below 1.3279, the bullish impetus will be lost, and buying the instrument can be considered.

GBP/USD
There is no news feed for today.

The USD/JPY currency pair

Technical indicators of the currency pair:
  • Prev Open: 104.25
  • Prev Close: 104.06
  • % chg. over the last day: -0.18%

On Friday, the trading session has closed in the red on the background of the aggravation of the situation in trade negotiations, but already with the beginning of the Asian session, the appetite for risk is recovering. The Japanese yen is gradually losing ground against the dollar. But the volatility in the currency pair continues to decline and it is difficult to expect any serious hike.

Trading recommendations
  • Support levels: 103.83, 103.93
  • Resistance levels: 104.59, 104.74

The main trading scenario for the pair – we consider trading in a sideways range between the levels of 104.59 and 103.83. Since the currency pair is near the lower border, you can try to buy with the target of 104.59 – 104.74. The expectations of a short-term upward movement will be strengthened by the break-through of the two moving averages in the 104.17 area. Oscillators don’t give any clear signal.

An alternative scenario assumes a breakdown to 103.83 and a fall to 103.19.

USD/JPY
There is no news feed for today.

The USD/CAD currency pair

Technical indicators of the currency pair:
  • Prev Open: 1.2739
  • Prev Close: 1.2770
  • % chg. over the last day: +0.24%

Oil continues to support the quotes of the Canadian dollar. It seems that this commodity currency is not going to retreat, as “black gold” has fixed above the opening level of last week. Brent quotes have reached February values this year. In this context, buying remains dangerous and any northern pullback could be an opportunity for short positions.

Trading recommendations
  • Support levels: 1.2707, 1.2528
  • Resistance levels: 1.2835, 1.2886, 1.3026

Consider trading in a sideways range between 1.2780 and 1.2707. On Friday and today, the pair failed to fix above the SMA 50 and SMA 100 in the Asian session, which indicates a continuation of the bearish trend. Stochastic is behaving very calmly, hinting at trading in a very narrow range. The MACD is in the positive zone. The signals are multidirectional. It’s most likely that there will be the sideways range.

Alternative scenario: if the price manages to return above 1.2780, the southern trend will be broken in the short term and a buy signal will appear towards the level of 1.2886.

USD/CAD
There is no news feed for today.

by JustForex


This article reflects a personal opinion and should not be interpreted as an investment advice, and/or offer, and/or a persistent request for carrying out financial transactions, and/or a guarantee, and/or a forecast of future events.

Markets get some Christmas cheer

By Han Tan, Market Analyst, ForexTime

Steady yourselves, we have some positive political news on talks which seem to never end and breach every deadline going! Of course, we know that Brexit deadlines are meaningless and trade talks can seem like they are dead and buried…before some life is found, some common goal pushes negotiations to an agreement. Indeed, the Irish PM Varadkar put this succinctly last week when he said, ‘deals are done at the last moment because everyone needs to be sure it was the best possible deal and there is nothing left on the table.’

Brexit hopes

Optimism in progress to a Brexit deal is soaring this morning with Sterling surging over 1.5% even as PM Johnson repeated his warning from last week that a no deal scenario was most likely. ‘Very difficult’ talks mean movement is still needed on the level playing field and agreement on the so-called ratchet clause, where both sides mutually agree to raise standards. But the rhetoric feels less gloomy as ‘minimal progress’ is still progress. Talks may now drag on until Christmas as there is no new ‘deadline’ and volatility will remain high.

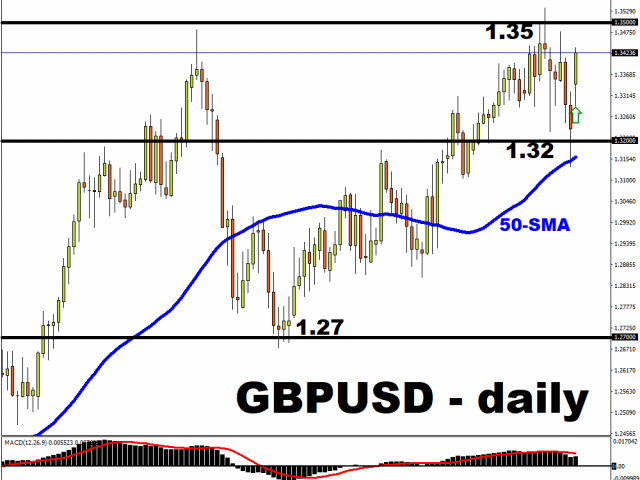
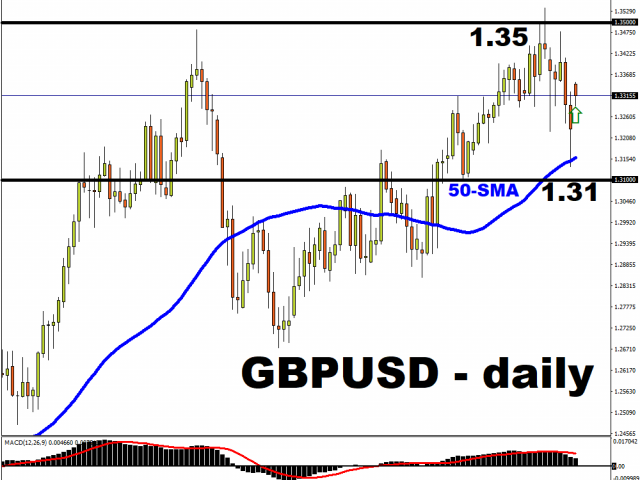
After plunging below 1.32 on Friday, Cable is back in its bullish channel formed after hitting lows below 1.27 at the end of September. If last week’s price action is a false break, then the bulls will be aiming for 1.35 and beyond, especially if the dollar breaks down this week.


Dollar looking ugly

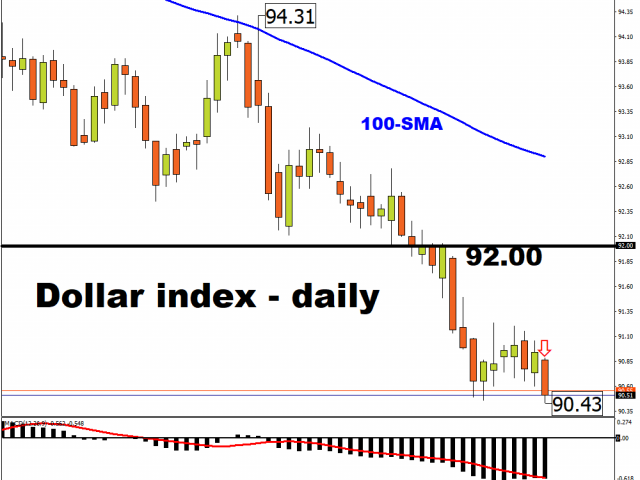
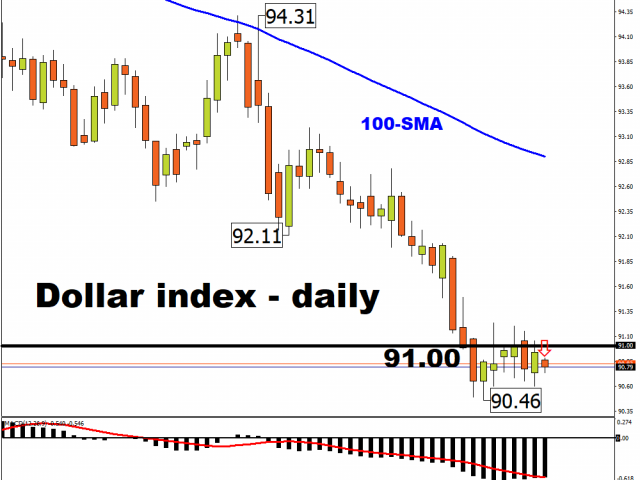
Lingering hopes around a US fiscal stimulus package and the Brexit optimism are pushing the DXY to its recent lows. Details of the bipartisan proposal will be unwrapped today, but congressional approval may prove tricky. Last week’s consolidation in the Dollar Index is healthy, after the big break of the 92 support level. A break lower may push DXY quickly to 90 with the 2018 Spring lows above 88 a target further out.


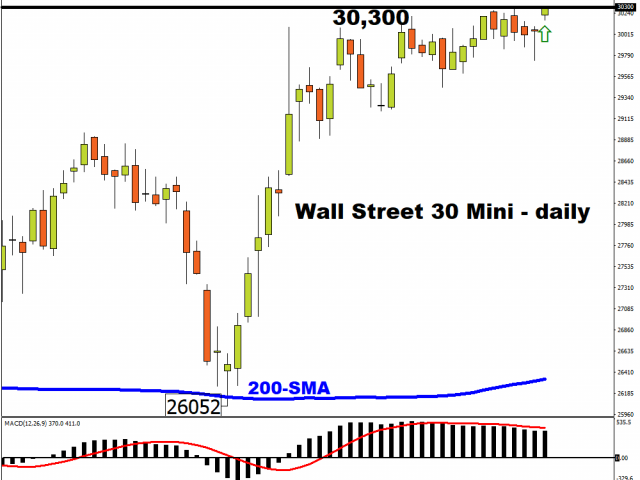
Positive risk sentiment is also helping US stock futures start the week on a bright note and again, the recent pause can herald a break higher in line with the dominant long-term trend. With Christmas certainly in the air, is that a Santa Claus rally we can hear?


Disclaimer: The content in this article comprises personal opinions and should not be construed as containing personal and/or other investment advice and/or an offer of and/or solicitation for any transactions in financial instruments and/or a guarantee and/or prediction of future performance. ForexTime (FXTM), its affiliates, agents, directors, officers or employees do not guarantee the accuracy, validity, timeliness or completeness, of any information or data made available and assume no liability as to any loss arising from any investment based on the same.


Forex-Time-LogoArticle by ForexTime

ForexTime Ltd (FXTM) is an award winning international online forex broker regulated by CySEC 185/12 www.forextime.com

US vaccine roll out lifts risk assets

By Hussein Sayed, Chief Market Strategist (Gulf & MENA), ForexTime

The long-awaited moment has finally arrived. The US began the first shipments of Covid-19 vaccine on Sunday following the final approval from the Centers for Disease Control and Prevention (CDC). The Pfizer-BioNTech vaccine has also arrived in Canada as several countries continue to authorise the emergency use of the vaccine, including Arab states such as Bahrain and Kuwait.

While the pandemic is far from over with many countries continuing to impose restrictions, investors are finally seeing the light at the end of the dark tunnel. What is being delivered today in the US is more than just a vaccine but hope that life will soon return to normal.

Wall Street is expected to kick off the day in the green following the first down week in three. The Dow Jones Industrial Average futures were up 150 points and the S&P 500 inched 0.5% higher at the time of writing. Meanwhile, the Dollar has given up most of Friday’s gains with the DXY index trading at 90.80.

US Stimulus

Following months of stalled negotiations, the bipartisan $908 billion stimulus proposal is likely to be put on the table of Congress today. Liability protection for businesses and state and local government aid remain the key sticking points. However, there have been reports that the stimulus relief plan may be split into two packages to ensure small businesses, the unemployed and the sectors most impacted by the pandemic receive funding before year-end. At this stage, any form of stimulus aid is going to be perceived as risk positive.

Brexit deal is not dead yet

Sterling rose against its major peers early Monday after the UK and EU agreed to carry on post-Brexit trade talks after crossing the Sunday deadline. The unresolved issues remain the same, namely EU fishing rights in British water and agreement on non-regression clauses.

Traders seem optimistic that a deal will be achieved before the end of the transition period. However, this assumption may be costly, as a no-deal scenario remains highly possible. Expect volatility to increase over the next few days as we approach 31 December, because after this date the UK would automatically fall back into the rules of the World Trade Organization if there is no deal.

The Bank of England will also be under pressure when monetary policymakers meet on Thursday. If there’s no deal by then, expect the central bank to signal sub-zero interest rates and further increase the asset purchase program. This is likely to put some pressure on the Pound.

Disclaimer: The content in this article comprises personal opinions and should not be construed as containing personal and/or other investment advice and/or an offer of and/or solicitation for any transactions in financial instruments and/or a guarantee and/or prediction of future performance. ForexTime (FXTM), its affiliates, agents, directors, officers or employees do not guarantee the accuracy, validity, timeliness or completeness, of any information or data made available and assume no liability as to any loss arising from any investment based on the same.


Forex-Time-LogoArticle by ForexTime

ForexTime Ltd (FXTM) is an award winning international online forex broker regulated by CySEC 185/12 www.forextime.com

Why is the Pound climbing today, even as Brexit deadline closes in?

By Han Tan, Market Analyst, ForexTime

The Pound kicked off the week stronger against all of its G10 peers.

GBPUSD is trading around 0.7 percent higher, as the currency pair’s dip below its 50-day simple moving average proved short lived, at least for the time being.


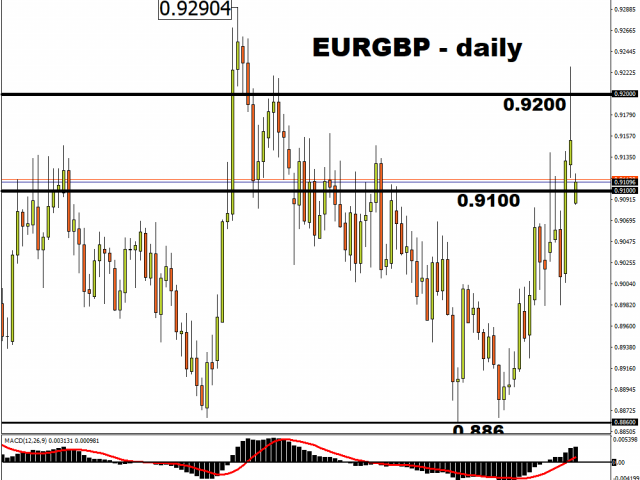
Likewise, Sterling is clawing its way back against the Euro, with EURGBP unable to hold its head above the 0.92 psychologically-important mark.


The Pound’s gains have translated into downward pressure for the Dollar index, given Sterling’s 11.9 percent weightage on the DXY.


Brexit talks thrown yet another lifeline

On Sunday, UK Prime Minister Boris Johnson and European Commission president Ursula von der Leyen urged their respective negotiators to press on with Brexit talks. This was welcomed news for Sterling because, going into the weekend, the commentary from both sides had sounded rather forlorn about ever reaching a Brexit trade deal. Recall that, after a disastrous dinner date last week, both leaders had set Sunday (yesterday) as the deadline for deciding whether negotiations should even go on.

Brexit deadlines apparently aren’t definitive

According to the Cambridge dictionary, the word “deadline” means, “a time or day by which something must be done”.

But when it comes to Brexit, its deadlines seem to be rather arbitrary.

Delayed deadlines have been a hallmark of this drawn-out saga since the June 2016 referendum.  Even the Brexit date itself, which was initially set for March 2019, had to be pushed back until January 2020.

What is the next key date to look out for?

The Brexit transition period will end on 31 December. This is immovable.

With less than three weeks to go, it remains to be seen whether the UK and EU can agree to a deal that governs the UK and EU’s trading relationship starting 1 January, 2021.

A no-deal Brexit is forecasted to wreak more economic damage on the UK economy that is still reeling from the pandemic’s impact. It’s estimated that, with a hard Brexit, the UK could experience an 8.1 percent reduction to its GDP over the following 10 years. The Bank of England has already warned that such a scenario could have a longer-lasting impact on the UK economy than the pandemic.

So why hasn’t Sterling fallen further?

Although Pound traders have indeed grown weary of these topsy-turvy Brexit ride, past instances have taught them to believe that the worst-case scenario can be averted.

Sunday’s news underscores this narrative. The fact that both Johnson and von der Leyen have asked negotiators to go the “extra mile” shows the tremendous amount of apprehension towards a no-deal Brexit. And in keeping with such hopes, there have been recent reports that Brussels is preparing for contingency plans, that may make for a “friendly no-deal” Brexit.

Such plans could soften the negative economic reaction to a hard Brexit, which is also offering support for the Pound, at least for now.

Still, to be clear, Sterling is weaker on a month-to-date basis against all G10 and Asian currencies.

How is the Pound expected to fare through the rest of 2020?

Despite the relative resilience shown in spot prices, the derivatives markets show a heightened level of caution baked into Sterling’s projected path over the coming weeks.

Over the next one month, investors are most bearish on the Pound compared to the rest of its G10 peers’ prospects against the US Dollar. Markets are also expecting Sterling to be the most volatile G10 currency going into 2021.

Although Brexit fatigue remains palpable, expect Sterling to remain sensitive to every weave and bop in this final stretch of the Brexit saga.


Disclaimer: The content in this article comprises personal opinions and should not be construed as containing personal and/or other investment advice and/or an offer of and/or solicitation for any transactions in financial instruments and/or a guarantee and/or prediction of future performance. ForexTime (FXTM), its affiliates, agents, directors, officers or employees do not guarantee the accuracy, validity, timeliness or completeness, of any information or data made available and assume no liability as to any loss arising from any investment based on the same.


Forex-Time-LogoArticle by ForexTime

ForexTime Ltd (FXTM) is an award winning international online forex broker regulated by CySEC 185/12 www.forextime.com

More and More Risks Appear Around Pound

Author: Dmitriy Gurkovskiy, Chief Analyst at RoboForex

December 13th was the deadline for the negotiations between British and European politicians about the conditions of the United Kingdom’s exiting the European Union. However, no decisions have been made and there is no extra time to make them. There were some tricks with phone calls later, though, which said that the parties agreed to continue discussing critical problems until they reached a compromise. But as time goes by, the whole situation is looking more and more ridiculous: policymakers had a year to help them avoid the “hardcore” Brexit and this year is now over.

The Pound is currently trying to make an impression that it takes no interest in all these concerns and that politicians will finally make a deal on fishing, trade border, and even Ireland, which will help the UK somehow leave the EU on December 31st. Not with flying colors but without a white flag neither.

However, this is just an illusion. The “hardcore” Brexit seems like the only possible scenario for the United Kingdom, which never saw fit to meet its opponent halfway. Unfortunately, it is the business community that will pay for ambitious decisions made by politicians.

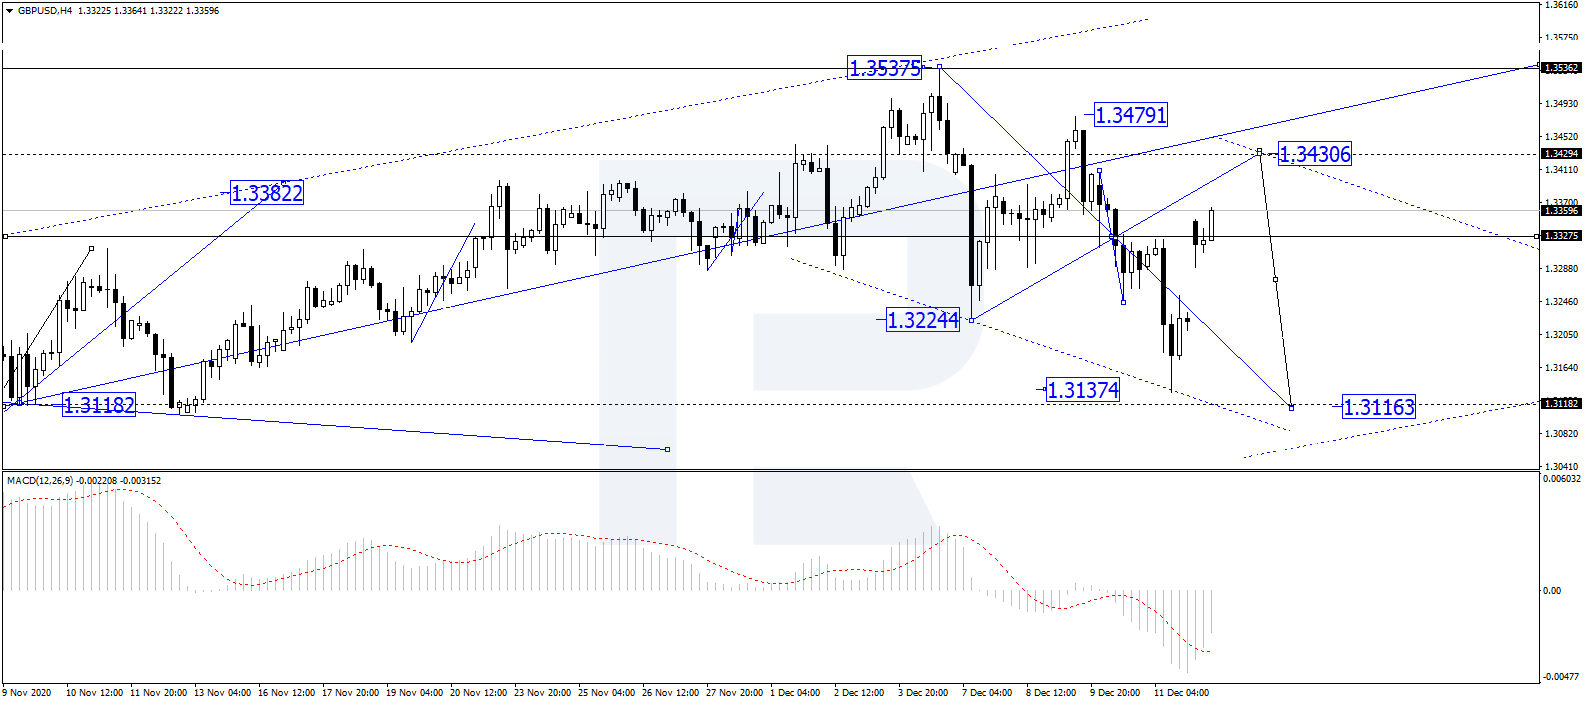
As we can see in the H4 chart, after reaching the short-term correctional target at 1.3137, GBP/USD is growing towards 1.3430 and may later complete the correction by reaching 1.3160. After that, the instrument may grow towards 1.3330 or even break it. In this case, the market may continue trading upwards with the target at 1.3590. From the technical point of view, this scenario is confirmed by MACD Oscillator: after breaking the histogram area, its signal line is steadily moving upwards to reach 0. After a breakout of this level to the upside, the asset may boost its growth on the price chart.

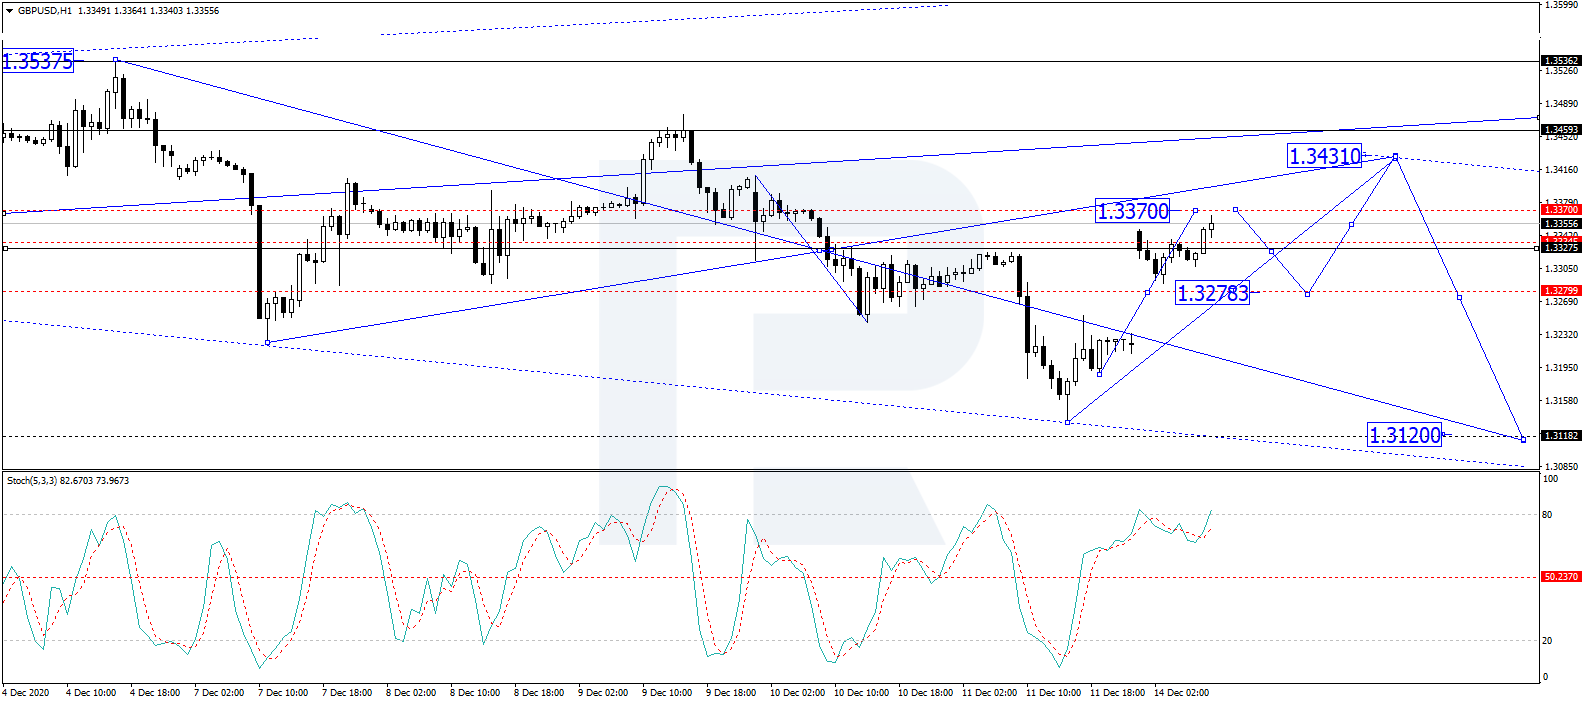
In the H1 chart, after breaking 1.3278 to the upside, the asset is expected to form one more ascending structure to reach 1.3370 and may later return to 1.3278 to test it from above. After that, the instrument may start another growth towards 1.3430 and then form a new descending wave with the target at 1.3120. From the technical point of view, this scenario is confirmed by Stochastic Oscillator: its signal line is moving above 80, which suggests that the market is trading within the “overbought area” and may start a new decline on the price chart.

Disclaimer

Any forecasts contained herein are based on the author’s particular opinion. This analysis may not be treated as trading advice. RoboForex bears no responsibility for trading results based on trading recommendations and reviews contained herein.

Custom Index Charts Suggest US Stock Market Ready For A Pause

By TheTechnicalTraders

Weeks after the Election Rally initiated a moderately strong upside breakout rally, our Custom Index charts suggest the US stock market may be ready for a brief pause in trending before any new trends continue. Global traders and investors jumped into the US stock market just days before the US elections expecting something big to take place.  The rally that initiated just days before the US election pushed our Custom Index charts well into the upper range of the 2016 to 2018 upward sloping price channel.  This suggests the US stock markets have ended the downward price reversion and are now attempting to extend into the upward price channel – attempting to resume the upward trending that started after the 2016 elections.

weekly smart cash and volatility indexes

The Weekly Smart Cash Index, below, highlights the impressive rally recently and the upward sloping price channel that is back in play for price.  The highlighted range of the upward sloping price channel is actually the lower half of the std deviation range of the 2016 to 2018 price channel.  So, as of right now, the Smart Cash Index price level has yet to really breach the middle of this channel and is still only within the lower half of the channel.  Still, the support near the lower boundary of this level has been retested two or three times over the past six months and held.  This suggests the lower channel level (the lower heavy BLUE line) is now acting as moderate price support.

The speed of the recent upside price rally on this Smart Cash Index chart suggests that current price congestion may be an indication that the US stock market has reached a point where it will pause and stall a bit before attempting any new rally.   From the recent lows near the end of October to the current highs, the current rally represents a 50% Fibonacci price expansion of the range from the March 2020 lows to the highs in August 2020.  The 50% expansion range is a very common Fibonacci level that can typically prompt market price pauses or reversals.

The following Weekly Volatility Index chart highlights a similar pattern – this time referencing the 61.8% Fibonacci price expansion range.  The Custom Volatility Index measures broader market trending in relationship to the VIX level.  When the VIX level expands (move higher), the Custom Volatility Index tends to decrease dramatically. We can see from this chart that the recovery attempt from the March 2020 lows to the August/September 2020 highs presented a defined upside price range.  Applying that range to the current lows that setup just before the US elections shows us that the US stock markets have rallies above the 61.8% Fibonacci price expansion range and contracted back below this level.

Be sure to sign up for our free market trend analysis and signals now so you don’t miss our next special report!

Again, we are still within the 2016 to 2018 upward sloping price channel, so we have seen a very clear resumption of the upward price trend recently.  Yet, the Custom Volatility Index chart suggests the US stock markets have reached the middle range of the upward sloping price channel and have reached the 61.8% Fibonacci price expansion range – this is a common area where price will stall, consolidate and/or reverse a bit before attempting to establish any new trends.

If the US stock markets attempt to resume any upside price trending, the RED LINE drawn across recent high price levels, will be the upside target/breach level to watch for.  The potential for some type of pause in price or moderate pullback is fairly strong at this level in price.  Overall, the trend is still solidly bullish and the lower range of the upward sloping price channel is acting as strong support.

When applying Technical Analysis to current market trends, it is important to understand Fibonacci price structure and how opportunities and risks setup over time.  Our Custom Index charts help us visualize how price is reacting to various support and resistance levels as well as help us understand the relationships of price activity to Fibonacci price structure.  We believe any pause/pullback in price near current levels will be brief before another upside price trend resumes.  The momentum behind the previous rally was quite strong and we don’t believe this momentum will diminish quickly.

Our Best Asset Now (BAN) technology highlighted multiple ETFs that ranked as potentially the best performing assets throughout this rally.  Currently, in this extended price rally phase, we are waiting for the BAN technology to confirm a new bullish trend trigger where new ETF symbols may rank highest using our BAN technology.  If you want to learn how to identify and trade the Best Assets Now, visit www.TheTechnicalTraders.com to learn more.

Have a great weekend!

Chris Vermeulen
Chief Market Strategist
www.TheTechnicalTraders.com

NOTICE AND DISCLAIMER: Our free research does not constitute a trade recommendation or solicitation for readers to take any action regarding this research.  We are not registered financial advisors and provide our research for educational and informational purposes only. Read our FULL DISCLAIMER here.