
Author: Dmitriy Gurkovskiy, Chief Analyst at RoboForex
December 13th was the deadline for the negotiations between British and European politicians about the conditions of the United Kingdom’s exiting the European Union. However, no decisions have been made and there is no extra time to make them. There were some tricks with phone calls later, though, which said that the parties agreed to continue discussing critical problems until they reached a compromise. But as time goes by, the whole situation is looking more and more ridiculous: policymakers had a year to help them avoid the “hardcore” Brexit and this year is now over.
The Pound is currently trying to make an impression that it takes no interest in all these concerns and that politicians will finally make a deal on fishing, trade border, and even Ireland, which will help the UK somehow leave the EU on December 31st. Not with flying colors but without a white flag neither.
However, this is just an illusion. The “hardcore” Brexit seems like the only possible scenario for the United Kingdom, which never saw fit to meet its opponent halfway. Unfortunately, it is the business community that will pay for ambitious decisions made by politicians.
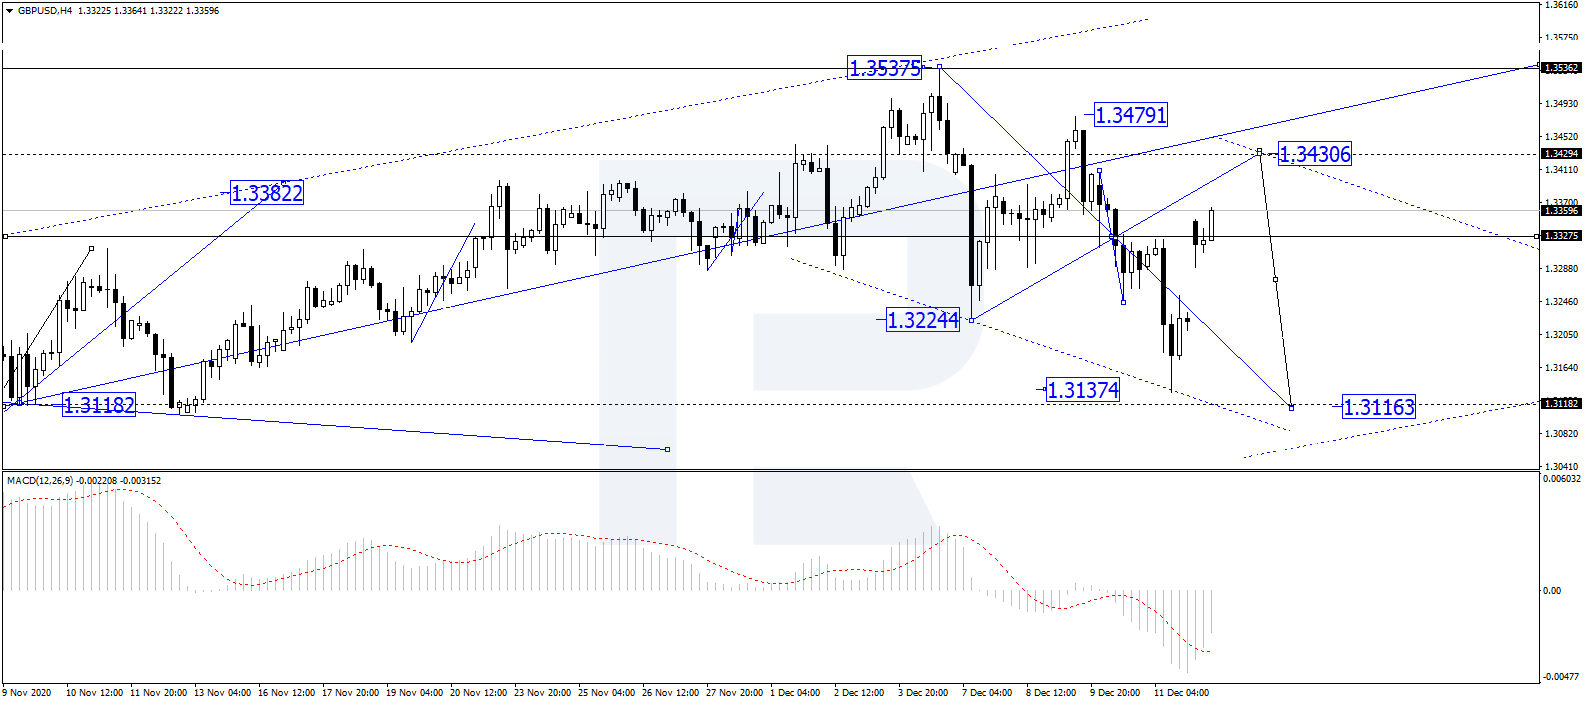
As we can see in the H4 chart, after reaching the short-term correctional target at 1.3137, GBP/USD is growing towards 1.3430 and may later complete the correction by reaching 1.3160. After that, the instrument may grow towards 1.3330 or even break it. In this case, the market may continue trading upwards with the target at 1.3590. From the technical point of view, this scenario is confirmed by MACD Oscillator: after breaking the histogram area, its signal line is steadily moving upwards to reach 0. After a breakout of this level to the upside, the asset may boost its growth on the price chart.
Free Reports:
 Get our Weekly Commitment of Traders Reports - See where the biggest traders (Hedge Funds and Commercial Hedgers) are positioned in the futures markets on a weekly basis.
 Download Our Metatrader 4 Indicators – Put Our Free MetaTrader 4 Custom Indicators on your charts when you join our Weekly Newsletter
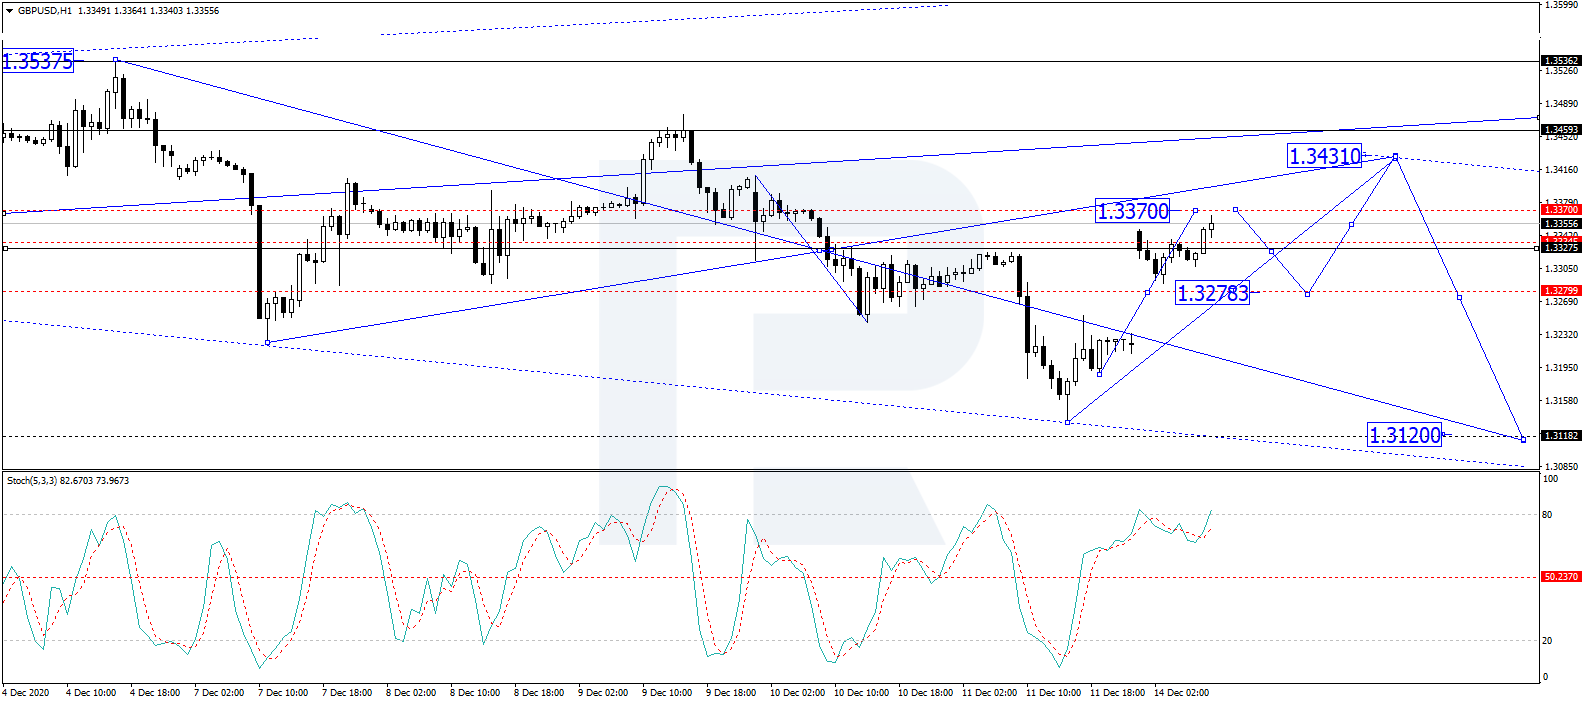
In the H1 chart, after breaking 1.3278 to the upside, the asset is expected to form one more ascending structure to reach 1.3370 and may later return to 1.3278 to test it from above. After that, the instrument may start another growth towards 1.3430 and then form a new descending wave with the target at 1.3120. From the technical point of view, this scenario is confirmed by Stochastic Oscillator: its signal line is moving above 80, which suggests that the market is trading within the “overbought area” and may start a new decline on the price chart.
Disclaimer
Any forecasts contained herein are based on the author’s particular opinion. This analysis may not be treated as trading advice. RoboForex bears no responsibility for trading results based on trading recommendations and reviews contained herein.

- EUR/USD: Busy Week Ahead Aug 3, 2026
- Positive sentiment in the AI sector supported stock indices. Oil prices remain volatile Aug 3, 2026
- The Tech‑heavy NASDAQ Index jumped by more than 3.3%. The offshore yuan is trading at its highest level since 2023 Jul 31, 2026
- USD/JPY After Volatility: Multiple Events in One Day Jul 31, 2026
- The US indices sell off amid renewed US-Iran clashes. Oil jumps by 7% Jul 30, 2026
- USD/JPY Temporary in Equilibrium: Multiple Factors in Focus Jul 30, 2026
- GBP/USD at Month’s Lows: The Outlook Remains Weak Jul 29, 2026
- Crude oil falls below $80 per barrel. Australia sees inflation slowdown Jul 29, 2026
- The US Tech sector hit by sell‑off. Oil prices decline on renewed negotiations Jul 28, 2026
- Gold Declines, Focus on Fed and Falling Oil Prices Jul 28, 2026
