Trump’s Iran-COVID-Gate Anniversary

By Dan Steinbock

– A year ago, the Trump administration escalated regime change efforts against Iran, while shunning the war against COVID-19. Due to misplaced priorities, more Americans have perished in the pandemic than US combatants in World War II.

In the past month, US B-52 bombers flew over the Gulf three times in a show of force the Trump administration called a deterrence measure. Presumably, to keep Iran from retaliating on January 3; the first anniversary of the assassination of top Iranian general Qassem Soleimani in a US drone strike.

The international concern is that President Trump could resort to military action against Iran, even in his remaining days in office.

January 3 also marked another first anniversary. A year ago, the White House was informed about a potential virus outbreak in China. For a year, a potential war against Iran has been overshadowed by COVID-19, which is now raging almost out of control in the United States and Europe.

At the end of 2020, COVID-19 had resulted in 85 million confirmed accumulated cases and over 1.8 million deaths. In the United States alone, the number of cases surpassed 20 million and deaths exceed 350,000; more than the number of all U.S. combat deaths in World War II. US Economic losses have soared to a fifth of US GDP (more than $4 trillion), as measured by COVID-19 fiscal relief.

Failed mobilization against COVID-19

On Sunday, January 3, 2020, the World Health Organization (WHO) was informed about a new potential virus outbreak in China. That’s also when China’s CDC completed the virus gene sequencing, initiated emergency monitoring and multiple countries were notified about the virus.

That same day, US CDC director Dr. Robert R. Redfield called Trump’s secretary of health Alex M. Azar II to tell him that China had discovered a new coronavirus. Azar informed the National Security Council and Trump’s national security adviser Robert O’Brien about the matter.

There was reason for hurry. When Trump arrived in the White House three years before, he eliminated NSC’s global health unit that had monitored such virus risks.

Despite proactive mobilizations in many nations, the Trump White House shunned such measures, including the WHO’s international emergency warning in late January. When the WHO announced the global pandemic alert in mid-March, a delayed, slow and ineffective national mobilization began against the virus.

Worse, President Trump and several cabinet members downplayed, even undermined urgent measures promoted by the nation’s top public-health experts.

Meanwhile, a long debate began within the Trump administration over “what to tell to the American public,” as efforts to ensure president’s re-election overwhelmed the war against the virus.

The Trump administration did declare a war on January 3, 2020 – but a wrong one.

Destructive escalation against Iran

On January 3, 2020, the plane of Qassem Soleimani, major general of the Islamic Revolutionary Guard Corps and commander of its elite Quds Force, arrived at Baghdad International Airport. After his convoy took off toward Baghdad, an assassination drone launched several missiles.

As two cars exploded in flames, some 10 people perished, including Soleimani.

Trump’s team struggled to justify the execution by Iran’s “imminent” attacks, but without hard evidence. Instead, Trump relied on his Orwellian soundbite. “We took action last night to stop a war… We did not take action to start a war.” Meanwhile, Pentagon sent 3,500 members of the 82nd Airborne Division toward the Middle East; one of the largest deployments in decades.

After the assassination, Iraq’s Prime Minister Adil Abdul-Mahdi said Soleimani had been on a peace mission. The two had planned to meet on the morning the general was killed to discuss a diplomatic rapprochement Iraq was brokering between Iran and Saudi Arabia. Abdul-Mahdi said Trump knew about the plan and personally thanked him for the efforts. Even as the administration was preparing the hit.

The Democratic House resolution to limit Trump’s war powers against Iran was a move in the right direction but it could neither reverse Trump’s exit from the Iran nuclear deal (JCPOA) nor halt the new escalation, which has prevailed, even amid the last days of the transition of power in the White House.

Fatal priorities, deadly outcomes

After Soleimani’s assassination, Trump’s national security adviser O’Brien struggled to legitimize the execution. He was informed about the Chinese outbreak on January 3, 2020, the day of the assassination, but he shunned the war against COVID-19.

Unlike O’Brien, Trump. Pompeo and other administration authorities, the Obama administration saw global pandemics as a pressing national security issue, as does the incoming Biden administration.

Truth to be told, the challenge Washington faces is systemic. Unlike most nations, America doesn’t have an appropriate self-defense policy, as U.S. Army colonel and military historian Ed Bacevich has noted. In Washington Rules: America’s Path to Permanent Wars, Bacevich stresses that “the exercise of global leadership as prescribed by the credo obliges the United States to maintain military capabilities staggeringly in excess of those required for self-defense.”

Priorities are misguided. As the anniversary of Iran-COVID gate suggests, the costs of these policy flaws are staggering in economic and human terms.

National security starts at home. Leadership matters – as does global cooperation across all political differences.

About the Author:

Dr. Dan Steinbock is an internationally recognized strategist of the multipolar world. and the founder of Difference Group. He has served as at the India, China and America Institute (US), the Shanghai Institutes for International Studies (China) and the EU Center (Singapore). For more, see https://www.differencegroup.net/  

 

Technical Outlook: OPEC Debate Keeps Oil Markets On Edge

By Lukman Otunuga, Research Analyst, ForexTime

A strong sense of anticipation can be felt across oil markets as investors await the outcome of a meeting of ministers from OPEC and Russia.

Will OPEC+ cap output at current levels for February after deciding to raise production by 500,000 barrels a day in January?

The re-opening of economies across the world and the rollout of vaccines have boosted sentiment towards Oil. However, surging coronavirus cases and lockdown restrictions threaten global energy demand recovery. It must be kept in mind that Germany is likely to prolong stricter lockdowns, Japan is considering another state of emergency while there are whispers over England entering its third national lockdown. Given the conflicting themes influencing Oil prices, the demand outlook for the next few months remains clouded by uncertainty.

Should OPEC and Russia refrain from raising output in February, this may translate into higher oil prices. The meeting could be complicated given how Moscow and the UAE have been keen to release more barrels into the markets. If both sides fail to find a middle ground, this may spell more uncertainty for Oil – leading to further losses.

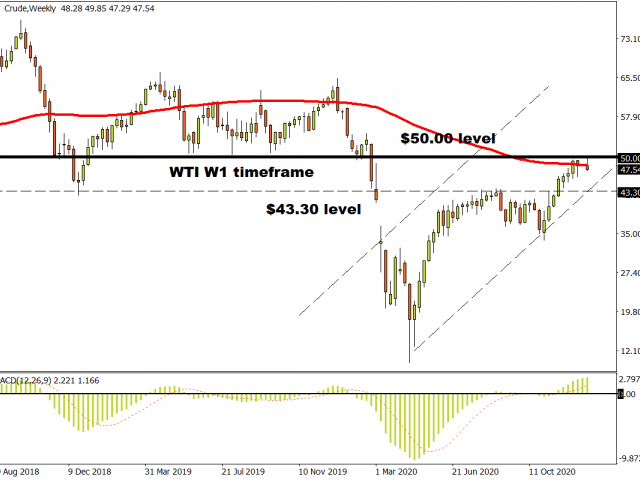
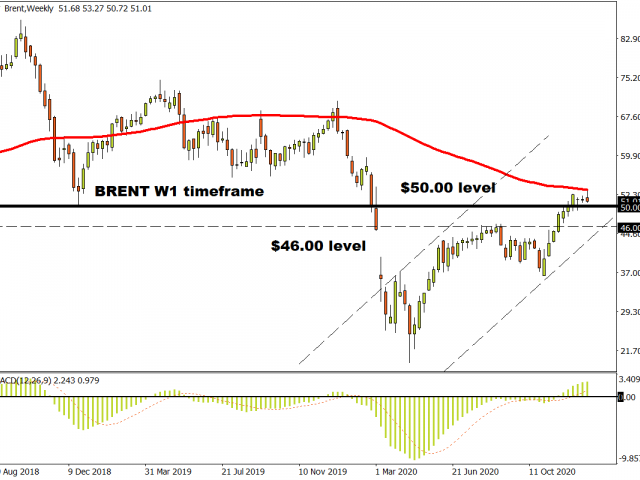
Looking at the technical picture, Oil prices are down almost 2% today thanks to lockdown fears. WTI Crude is trading around $47.60 as of writing while Brent is marginally below $51.00.

WTI Crude has the potential to decline back towards $43.30 if $50.00 proves to be reliable resistance. Looking at the technical indicators, prices are trading below the 20 Simple Moving Average but the MACD points to further upside.

The same can be said for Brent. A breakdown below $50 could pave the way lower towards $46.00 in the near term. If $50.00 proves to be reliable support, a move towards $56.00 could be on the cards.

Disclaimer: The content in this article comprises personal opinions and should not be construed as containing personal and/or other investment advice and/or an offer of and/or solicitation for any transactions in financial instruments and/or a guarantee and/or prediction of future performance. ForexTime (FXTM), its affiliates, agents, directors, officers or employees do not guarantee the accuracy, validity, timeliness or completeness, of any information or data made available and assume no liability as to any loss arising from any investment based on the same.


Forex-Time-LogoArticle by ForexTime

ForexTime Ltd (FXTM) is an award winning international online forex broker regulated by CySEC 185/12 www.forextime.com

Bitcoin collapses almost 20% at the start 2021

By TheTechnicalTraders 

– After an incredible upside price rally that took place throughout the end of 2020, the recent 20% decline in Bitcoin prices, seemingly overnight on January 4th, may have come as a shock to many Bitcoin traders.  The deep low price was reached in early trading overnight on very heavy volume – reaching levels near $27,734.  Compared to the high price level reached just 27 hours earlier, near $34,800, this strong price decline represents a 20% sell off (over -$7040).

Bitcoin Daily Chart

If this is the start of a broader downtrend for Bitcoin, we’ll have to watch the MAGENTA trend level on this Daily Bitcoin chart below for an indication the upward support channel is breached.  This may be a deep pullback in a stronger uptrend still.  But the heavy volume and very deep decline suggest the upside parabolic price trend may have “popped” and Bitcoin may be setting up for a bigger change in trend in early 2021.

Overall, very clear support from the RED trend level on this chart would suggest that support near $21,000 may become the next target level.  Traders can see the breakdown of the RSI indicator as well as the clear support channel represented by the MAGENTA trend level on this chart.  We believe the MAGENTA trend level is a critical level if this upside price trend is going to continue.

Watching your Bitcoin investments collapse by -20% overnight must be a tough pill to swallow for many traders.  What we find interesting about this move is that it appears to take place withing what we’ve been calling an “Excess Phase” peak.  We’ve authored numerous articles over the past 60+ days suggesting the global markets have entered an “Excess Phase” (Blow-off top) type of formation related to our super-cycle and intermediate cycle research. Check out our recent research on How to Spot the End of an Excess Phase and Bitcoin – Is this the Peak?

If our researcher is correct, this deep downside rotation in Bitcoin will start an “Excess Phase” (Blow-off top) pattern – resulting in a steeper price decline lasting many months into the future.  Eventually, price may settle back below $8500 before finding support again.

We will have to watch how this peak/rollover continues over the next few days and weeks.  Excess Phase tops are fairly clear in terms of how they process.  This first phase peak will settle into an upside Price Flag formation trend. When that Price Flag formation breaks, a bigger downtrend will push prices much lower – setting up a final support level, which will also be broken eventually.

If this downward trending continues in Bitcoin, this next price low will setup the Bullish Price Flag pattern of the Excess Phase.  Pay attention to the setup and phases of these types of Excess Peaks.  It is important that you learn to manage risks throughout these trends.

Do you want to stay ahead of these sector trends and learn which sectors are the best opportunities for your trades?   Learn how our BAN Trader Pro education and alerts can help you keep focused on the best trading opportunities in 2021 and beyond while helping you protect and grow your wealth.  Go to www.TheTechnicalTraders.com to learn more about BAN Trader Pro, or let me teach you how to trade this strategy yourself by watching my FREE webinar! Scroll below to register for your seat now and make 2021 your year to PROFIT!!

I wish you all a healthy and profitable New Year!!

Chris Vermeulen
Chief Market Strategist
www.TheTechnicalTraders.com

Will The US Dollar Weaken This Year?

By Orbex

Last week, the US dollar index fell to the lowest level it’s been since the start of 2018.

And in the first hours of trading in the new year, it has continued lower.

The index is now well below pre-covid levels, and it started to accelerate its drop in the fourth quarter.

A weaker dollar makes sense, as markets are becoming more optimistic, particularly with the rollout of covid vaccines.

Of course, there is more going on below the surface than somewhat standard trading flows.

2021 is going to be a very different year for the markets than 2020 was.

So what can we look forward to?

The Dominos Are Stacking Up

Last year saw the largest expansion in the US monetary base in history.

There are nearly 50% more dollars in circulation now than there were a year ago. The economy, however, has actually shrunk, by an estimated 3.6%.

With significantly more money representing a smaller economy, it’s a recipe for the money to not be worth as much. Moreover, compare that to the Euro Area, where the monetary base only increased by 10% during the same period.

Though we should note that, generally, the Fed has “front-loaded” their printing, with most of the monetary expansion in March and April last year. And it has since remained relatively steady.

The ECB has slowly expanded available cash through the year and is expected to continue.

Stimulating Inflation

Whether or not the current debate on expanding the latest stimulus checks to $2,000 gets approved before the 20th, Democrats have already pledged to push for another stimulus bill once Biden is in office.

That means more debt issuance.

Inflows to the bond markets are at record low levels because the low yields make Treasuries an unattractive investment.

So, we can expect the Fed to take an increased role in financing government debt issuance, meaning further expansion of the monetary base.

Where is this money going?

Well, a substantial part is being spent on consumer goods, much of which is imported. The US trade deficit has expanded 37% since the start of the pandemic.

The US economy is selling over $60B a month in dollars to keep up with the demand for goods – its largest trade deficit since 2008.

The Safety Valve is Going Away

At the outset of the pandemic, when there was the largest increase in spending, the personal savings rate among Americans shot up to over 30%.

Since then, it has declined precipitously to just under 13% in November. We can now expect it to drop further in the coming months, heading towards the pre-pandemic level of around 8%.

This means that as confidence grows among consumers, they still have more money to spend, expanding the money in circulation and increasing demand for foreign goods.

Of course, all this is predicated on the idea that the vaccination program will go as planned, and will allow a restoration of the economy by the middle of the year.

However, we are already seeing that the delivery of vaccines is not as fast as expected.

The optimism of the holiday cheer might wear off soon – especially as the market is hit with a dose of reality during Q4 corporate earnings season which starts in less than two weeks.

By Orbex

Weekly Fundamental Bulletin: US Data Kicks Off 1st Trading Week Of 2021

By Orbex

Last week’s highlights

Australia retail sales rise 7% in November

Retail sales in Australia posted a continued rebound in November, building up from the gains in October.

The total value of retail sales rose 7% on a month over month basis in November.

The official data from the Australian Bureau of Statistics came following a 1.4% increase in October.

Economists forecast that retail sales will fall by 0.6% during the period. Household goods rose by 13%, leading the gains. This comes after a full month of trade in some parts of the country.

On a year over year basis, retail sales rose by 13.2%.

US Weekly jobless claims better than forecast

The weekly jobless claims continued to slide with the latest data showing the claims at 787,000.

The continuing claims also fell on a week over week basis, clocking in at 5.2 million. Both the data points were better than the forecasts.

The latest data marks the lowest weekly jobless claims since late March in 2020.

Still, the overall improvement in the jobless claims data remains marginal. Economists now expect to see bumps in the data by early January.

UK and EU secure trade deal

After voting to leave the European Union in 2016, the EU and the United Kingdom secured a trade deal.

The breakthrough came during the final week of 2020.

On January 1, 2021, the UK was due to formally exit the European Union. British lawmakers were quick to pass the deal in the Parliament, which also received the Queen’s consent.

The FX markets did not react much to the news amid broader narratives in the market.

Still, last week marks a major milestone in the UK’s plan to exit the economic bloc.

US pending home sales fall for a third consecutive month

Pending home sales in the United States continued their downward trajectory.

The data from the National Association of Realtors showed that pending home sales fell by 2.6% in November. This follows a 0.9% decline in October.

Economists forecast to see an unchanged print for November.

Despite the monthly decline, pending home sales remain near 16.4% on the year. The data also showed that the current sales and prices were far stronger compared to a year ago.

Japan’s industrial output remains flat

The latest industrial production data from Japan showed a flat reading on a seasonally adjusted basis.

The data was released by the Ministry of Economy, Trade, and Industry. The flat reading for November missed the estimates of a 1.2% increase.

It also comes after October saw a 4.0% increase. On a year over year basis, industrial production fell by 3.4%, which was in line with the estimates.

Following the release, officials said that industrial production was picking up pace.

Upcoming Economic Events

OPEC+ ministers meet to discuss oil quotas

The new trading week of 2021 kicks off with the OPEC+ energy ministers holding a virtual monthly meeting.

A decision on whether to add as much as 500,000 barrels a day to production is on the agenda.

Recent data showed that OPEC+ managed to reach 104% of compliance.

Among the members, Russia is apparently in favor of raising oil production, while Saudi Arabia is preferring a more cautious approach.

Russia already voiced its opinion in favor of increasing production by 500,000 barrels per day from February this year.

Eurozone flash inflation data on tap

The preliminary inflation report for December is due from the Eurozone.

Forecasts point to a modest improvement, with headline inflation recovering from -0.3% in November to -0.2% in December on a year over year basis.

Core inflation is forecast to remain unchanged, albeit staying at historic lows of 0.2% on the year for the fourth consecutive month.

Consumer spending is forecast to decline in December due to increased restrictions across various parts of the Eurozone. This is expected to offset the modest gains in fuel costs during the month.

ISM manufacturing PMI to ease in December

US manufacturing activity for December is set for release by the Institute for Supply Management.

Forecasts show that ISM manufacturing activity will ease to 56.6 in December. This is down from 57.5 from the month before.

The data will likely underline an uneven growth after manufacturing activity peaked in October this year.

Labor shortages are expected to dampen output gains. Despite the drop, the ISM manufacturing index remains well above 50, suggesting an expansion.

Investors await meeting minutes from December FOMC

The US Federal Reserve Bank will be releasing the meeting minutes from its December FOMC meeting.

The meeting offered little evidence that policymakers were leaning toward either raising QE or altering the maturity distribution of purchases in the near term.

For investors, the interest will be to understand the context of the Fed’s message which talked about the substantial further progress.

Investors will be looking for evidence of what policymakers will need to see before scaling back the Fed’s asset purchases.

Investors look to the December payrolls report

On Friday, the monthly payrolls report for December will be coming out.

The general estimates are for payrolls to rise about 82,000 during the month. This marks a dramatic decline comparing to 245k from November.

The unemployment rate is also forecast to rise back to 6.8%, after falling to 6.7% previously.

The dovish outlook comes as the initial surge in job creation post the first Covid-19 lockdown came to a crashing halt in December.

The participation rate is also forecast to drop from around 63% in November to 60% in December.

By Orbex

Tesla Shares Higher On Deliveries Beat

By Orbex

Record Vehicle Deliveries

Tesla shares have started 2021 in the green following news over the weekend that the company beat analyst expectations for vehicle deliveries in 2020. Despite the pandemic, Elon Musk’s company delivered a record 180,570 vehicles over Q4. This beat Wall Street’s projection of 174,000.

Even more impressively, at 499,550 deliveries over 2020 as a whole, the company was only just shy of hitting Musk’s target for 500,000 deliveries over 2020. In all, Tesla recorded a 36% annual jump in vehicle deliveries.

Record Rally in 2020

Shareholders in Tesla enjoyed a bumper rally of almost 900% in 2020 bolstered by a steady strengthening of earnings beats and news that Tesla will now be included in the S&P500 index. Tesla joined the index in December as its sixth-largest company. It was immediately cheered by investors who drove the Tesla rally higher.

In terms of its performance over 2020, the company’s sales received a strong boost from the significant scaling up of production at its plant in Shanghai. Along with the launch of a Model Y car, based on the former Model 3 vehicle.

Focus on Production over 2021

Looking ahead, investors have been buoyed by Tesla’s plans to ramp up production further in 2021. Plants are due to open in Texas and Germany. The key issue for Tesla is to ensure that it is able to satisfy increasing demand with a proportionate rise in production. The main focus for investors and analysts this year will be on the scaling up of its production at the two proposed sites listed.

While Tesla was successful in boosting its production in Shanghai last year, it will need to be as successful this year in order to avoid a bottleneck. This could weigh on sentiment.

Tesla is next due to report earnings on February 2nd. The market is looking for Q4 earnings per share of $0.93.

Tesla At High But Bearish Divergence Noted

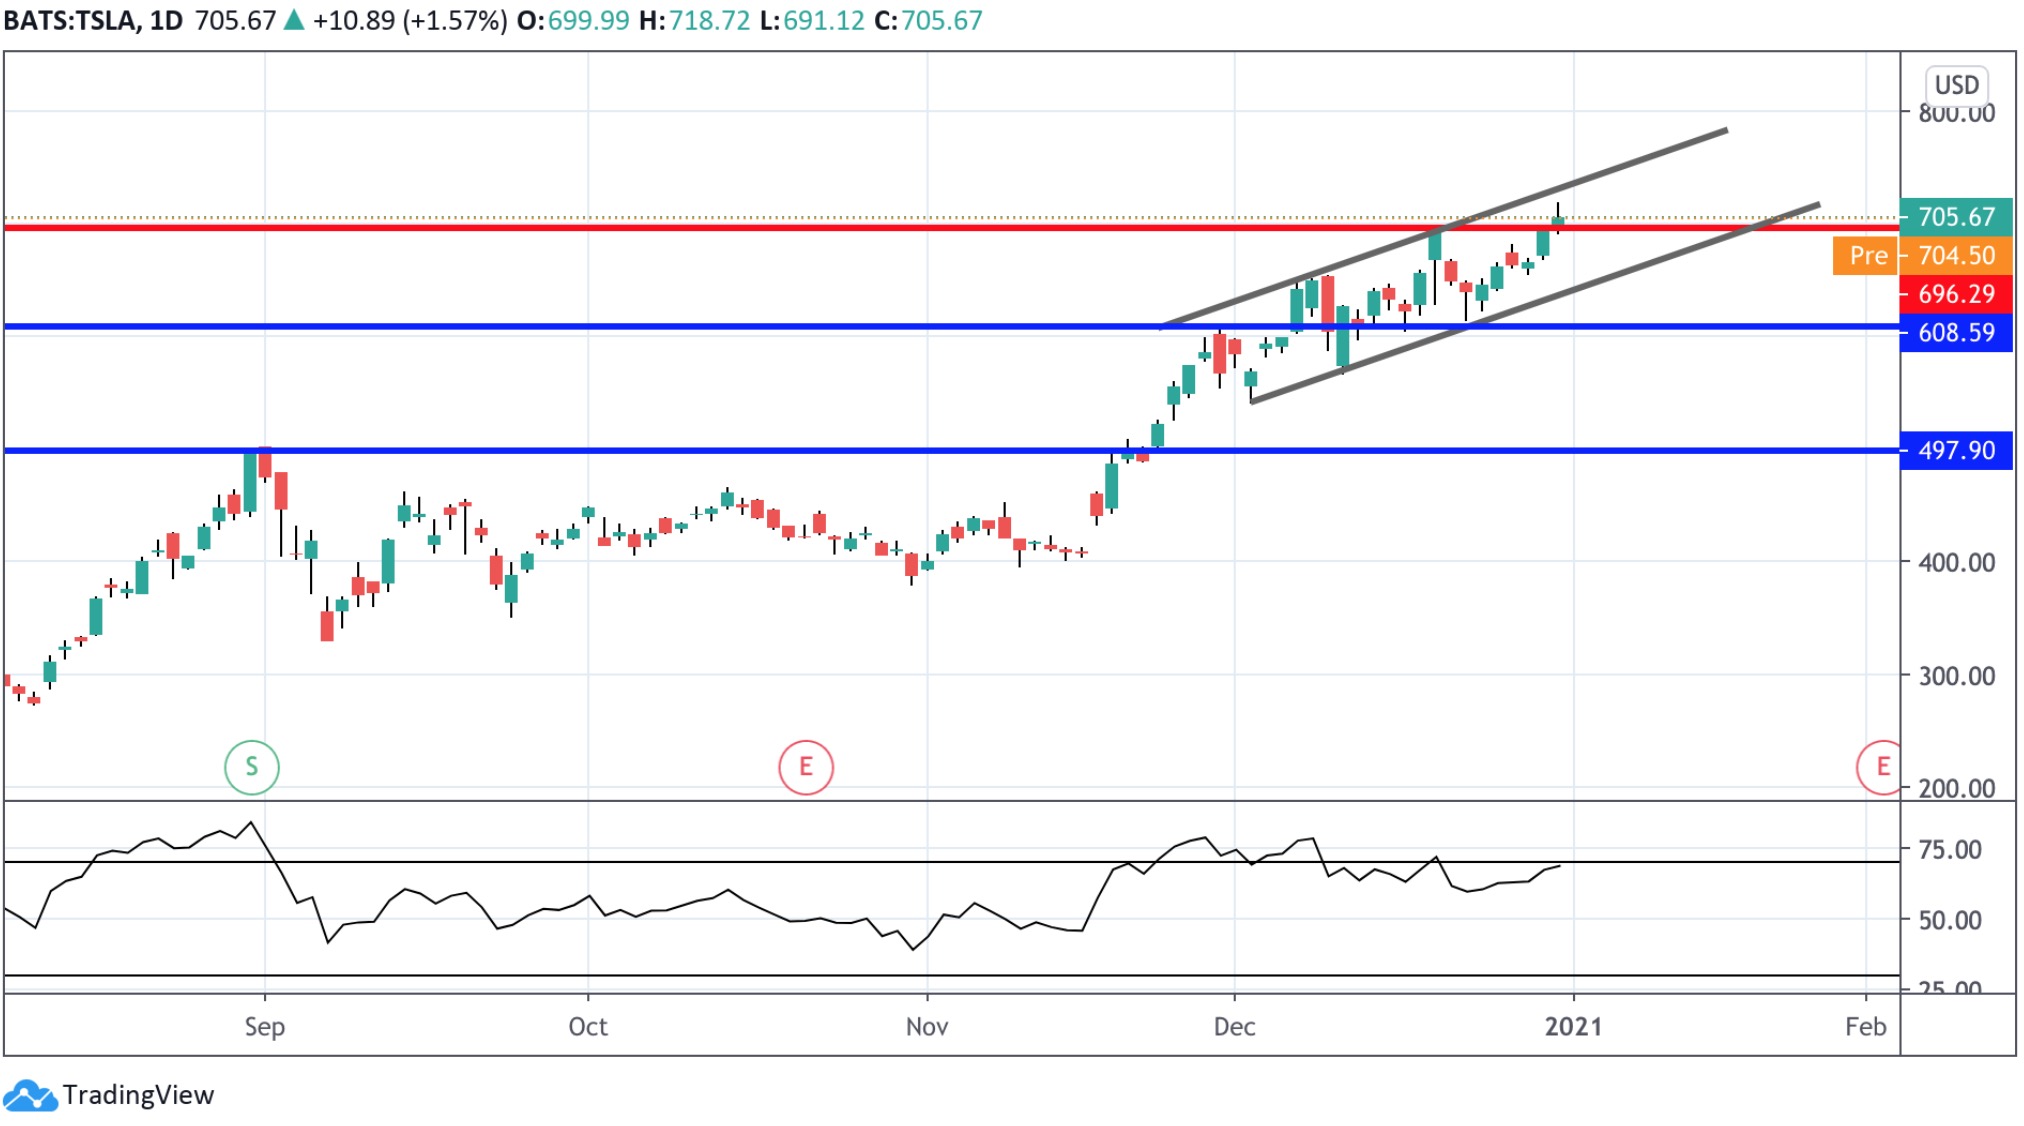
Tesla shares continue to trade in a tight bullish channel and are currently sitting just above prior resistance at the 696.29 level. While price remains within a bullish formation, for now, bearish divergence on the RSI indicator suggests the risk of a reversal lower.

To the downside, any correction lower will turn focus to support at the 608.59 level. A break of there would open the way for a test of the 497.90 level next.

By Orbex

Forex Technical Analysis & Forecast 04.01.2021

Article By RoboForex.com

EURUSD, “Euro vs US Dollar”

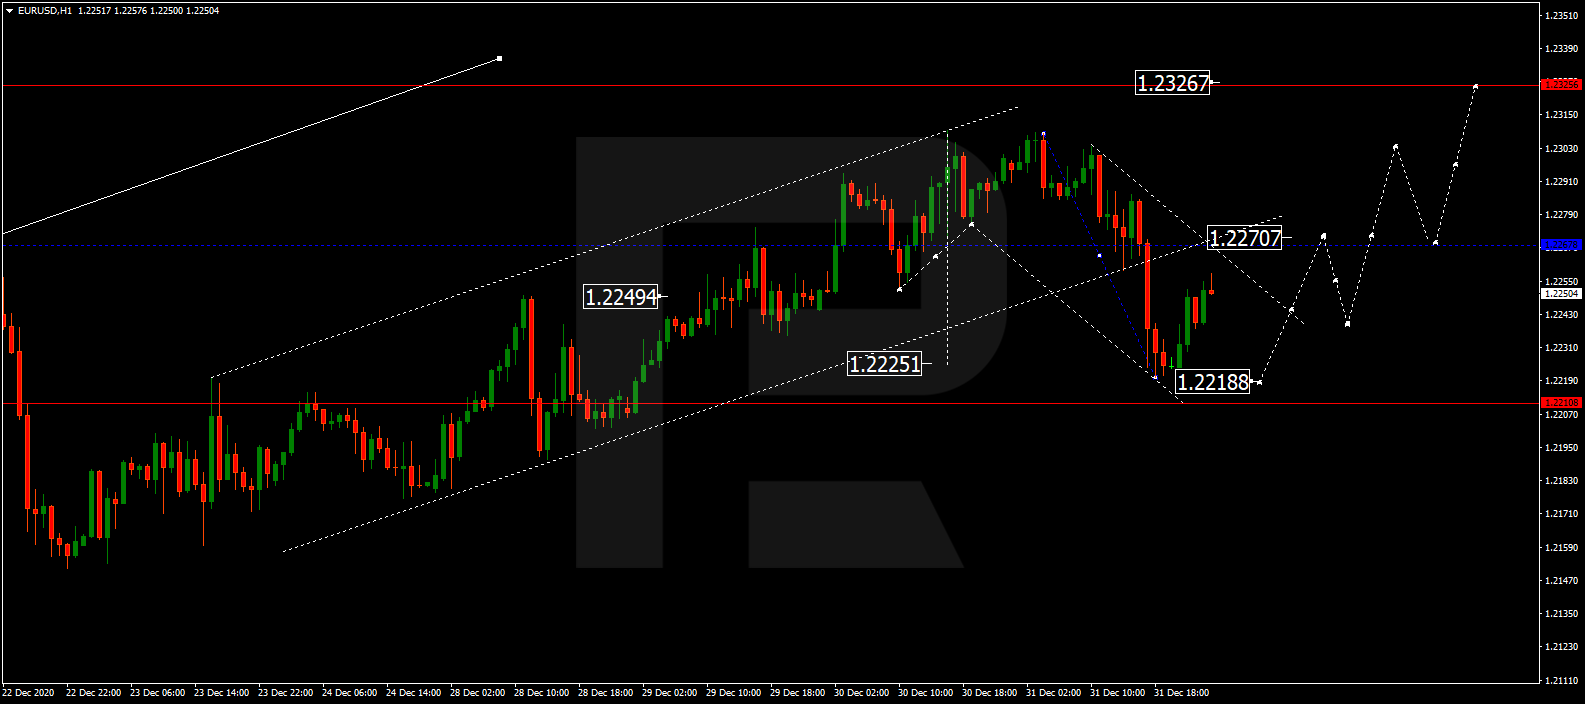
After finishing the ascending wave at 1.2300 along with the correction towards 1.2220, EURUSD is expected to reach 1.2270 and then fall towards 1.2240, thus forming a new consolidation range between the two latter levels. If later the price breaks this range to the upside, the market may form one more ascending structure towards 1.2326; if to the downside – continue the correction with the target at 1.2218.

EURUSD
Risk Warning: the result of previous trading operations do not guarantee the same results in the future

GBPUSD, “Great Britain Pound vs US Dollar”

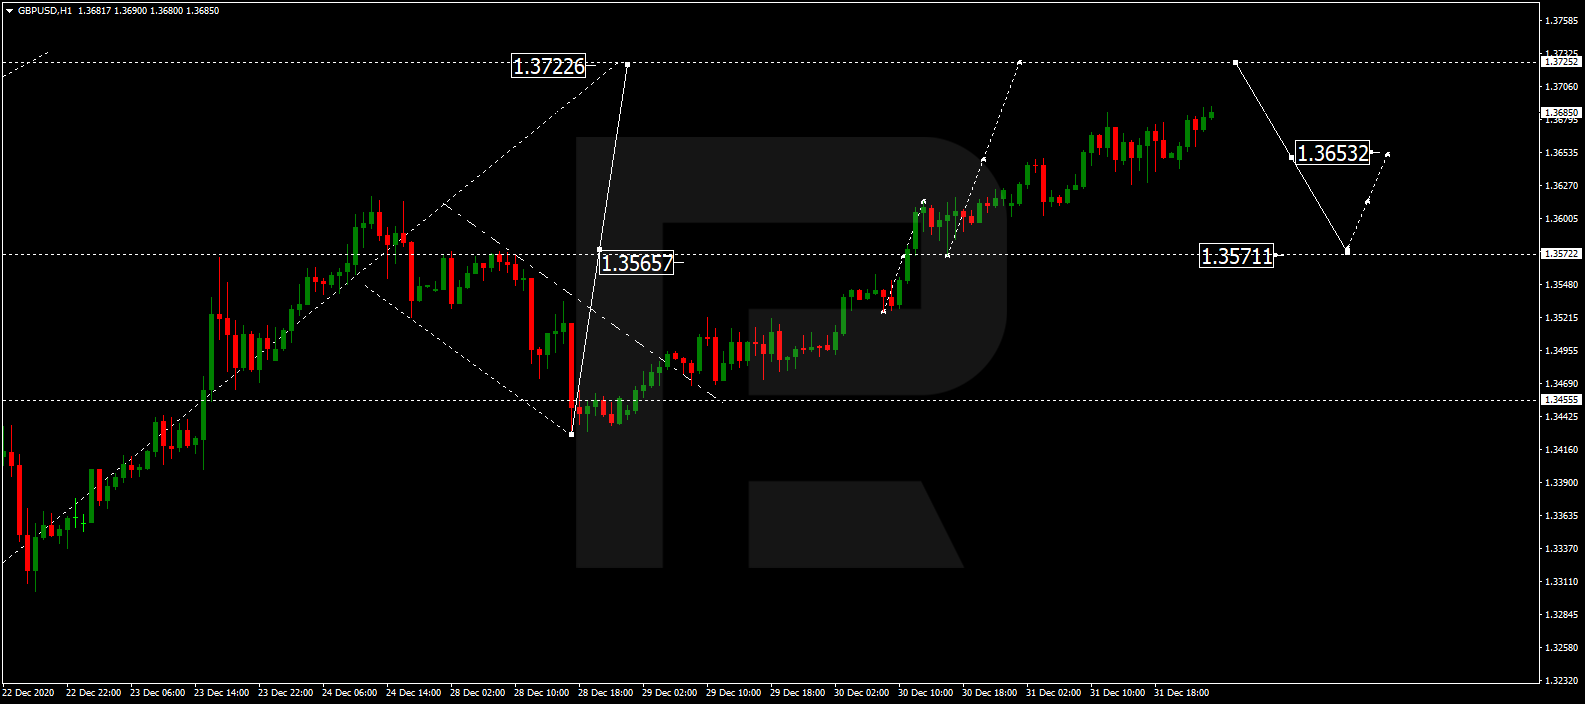
GBPUSD is growing towards 1.3722. After that, the instrument may correct to reach 1.3571 and then move upwards with the target at 1.3643, thus forming a new consolidation range between these two levels. If later the price breaks this range to the downside, the market may form a new descending structure with the first target at 1.3455.

GBPUSD
Risk Warning: the result of previous trading operations do not guarantee the same results in the future

USDRUB, “US Dollar vs Russian Ruble”

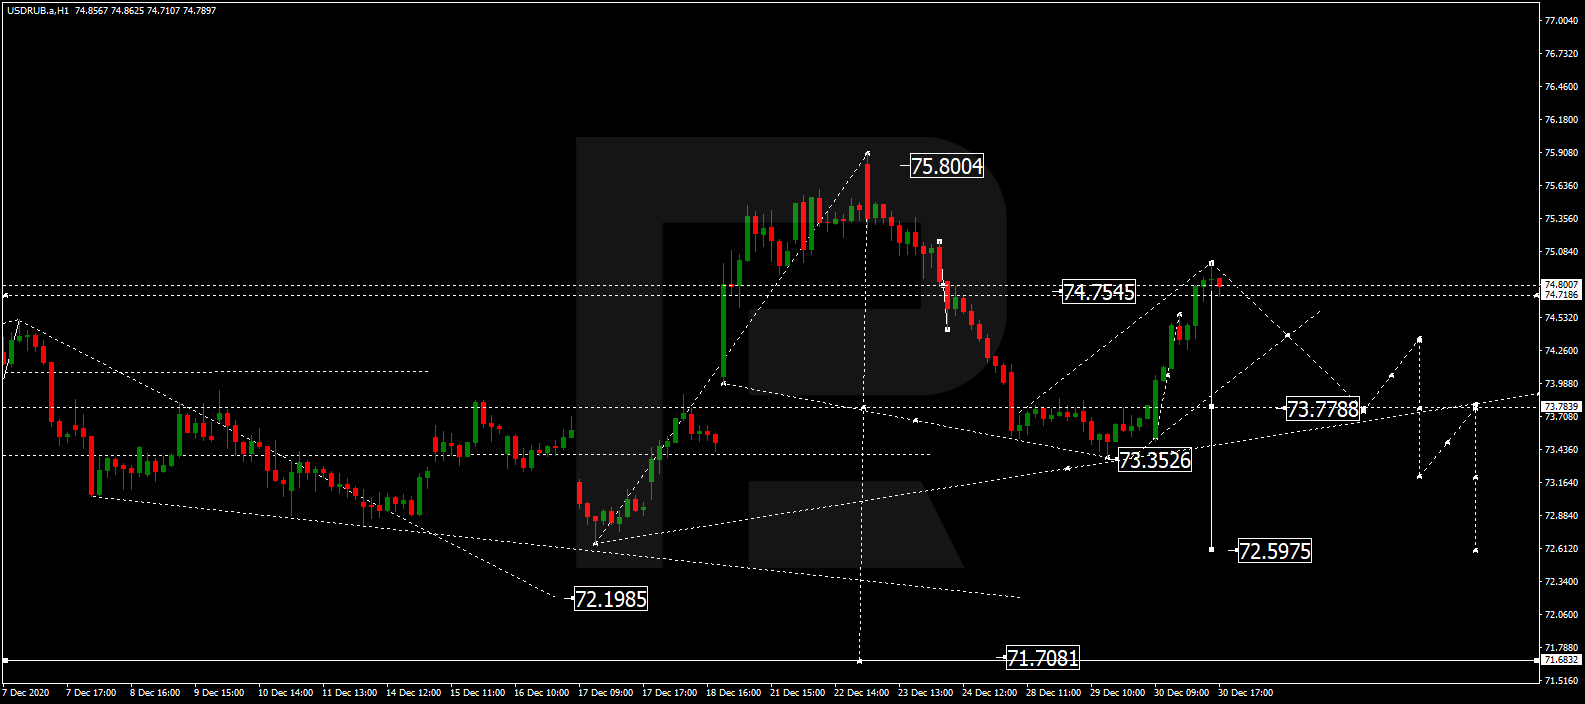
USDRUB has completed the correction at 74.74. After the market opening, the pair may fall to break 73.73 and then continue trading downwards with the short-term target at 72.60. In fact, the market is expected to continue forming the descending wave to reach 71.71.

USDRUB
Risk Warning: the result of previous trading operations do not guarantee the same results in the future

USDJPY, “US Dollar vs Japanese Yen”

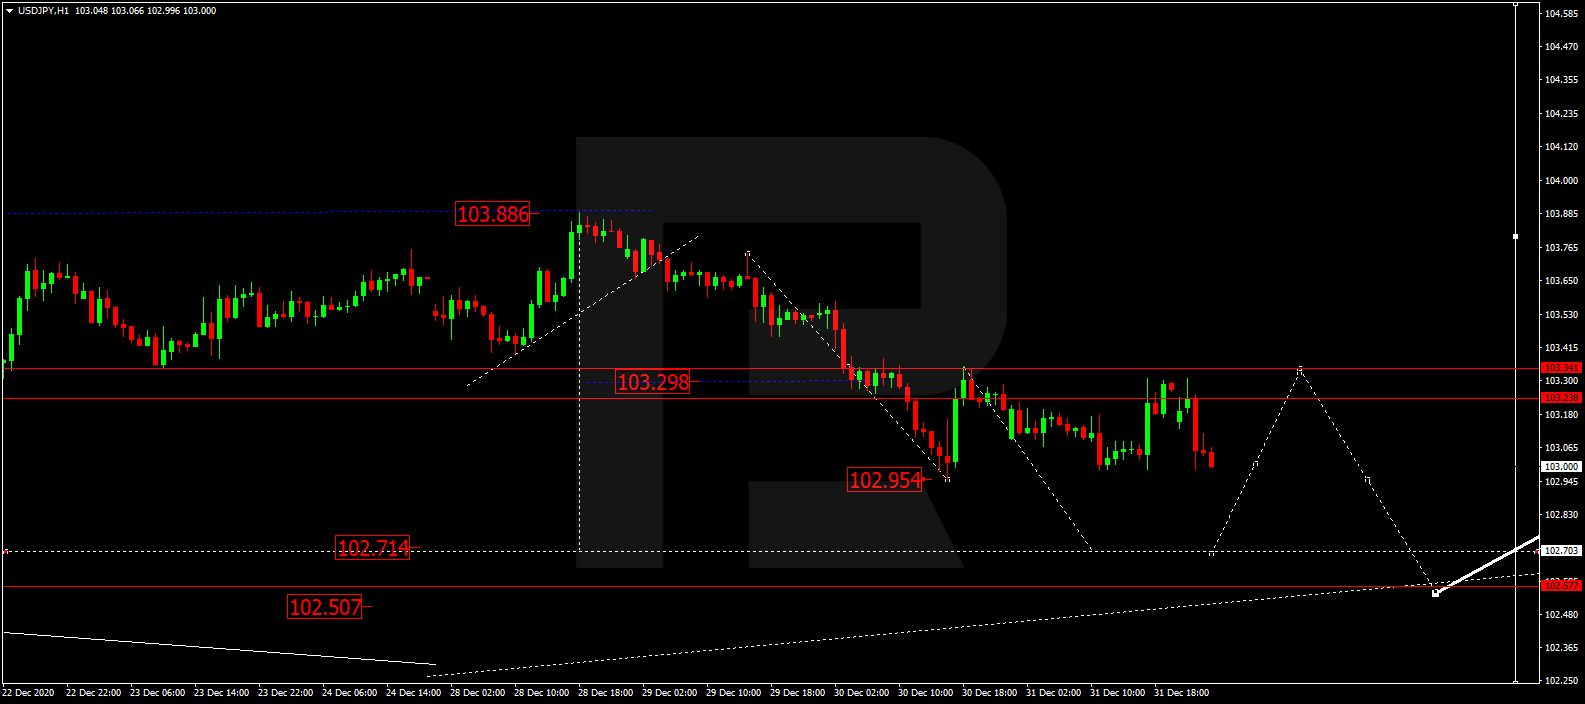
After completing the descending wave at 102.95 along with the correction towards 103.30, USDJPY is falling to reach 102.70. After that, the instrument may correct to return to 103.30 and then resume trading downwards with the key target at 102.50.

USDJPY
Risk Warning: the result of previous trading operations do not guarantee the same results in the future

USDCHF, “US Dollar vs Swiss Franc”

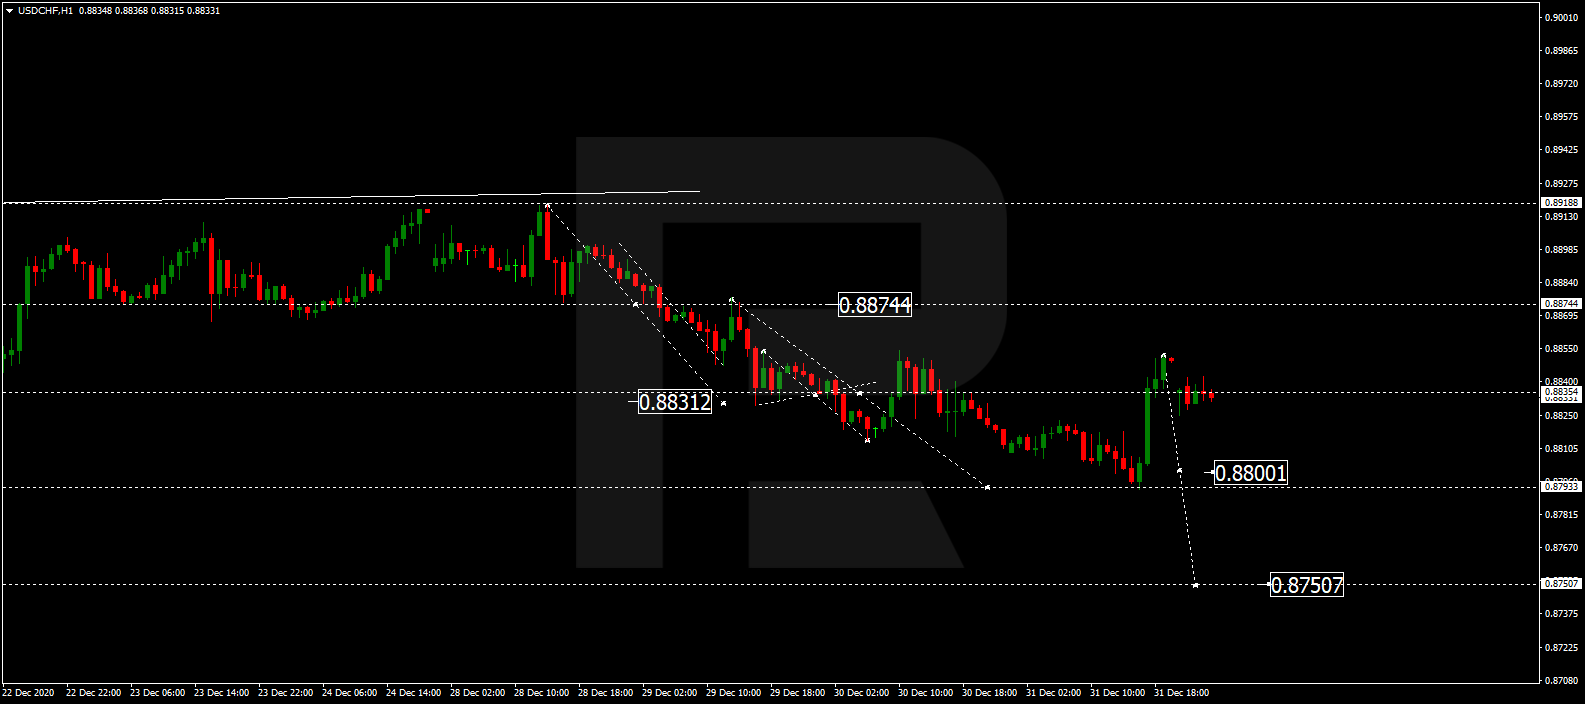
After finishing the descending wave at 0.8800 along with the correction towards 0.8850, USDCHF is expected to form a new consolidation range below the latter level. If later the price breaks this range to the downside, the market may resume trading downwards with the target at 0.8750.

USDCHF
Risk Warning: the result of previous trading operations do not guarantee the same results in the future

AUDUSD, “Australian Dollar vs US Dollar”

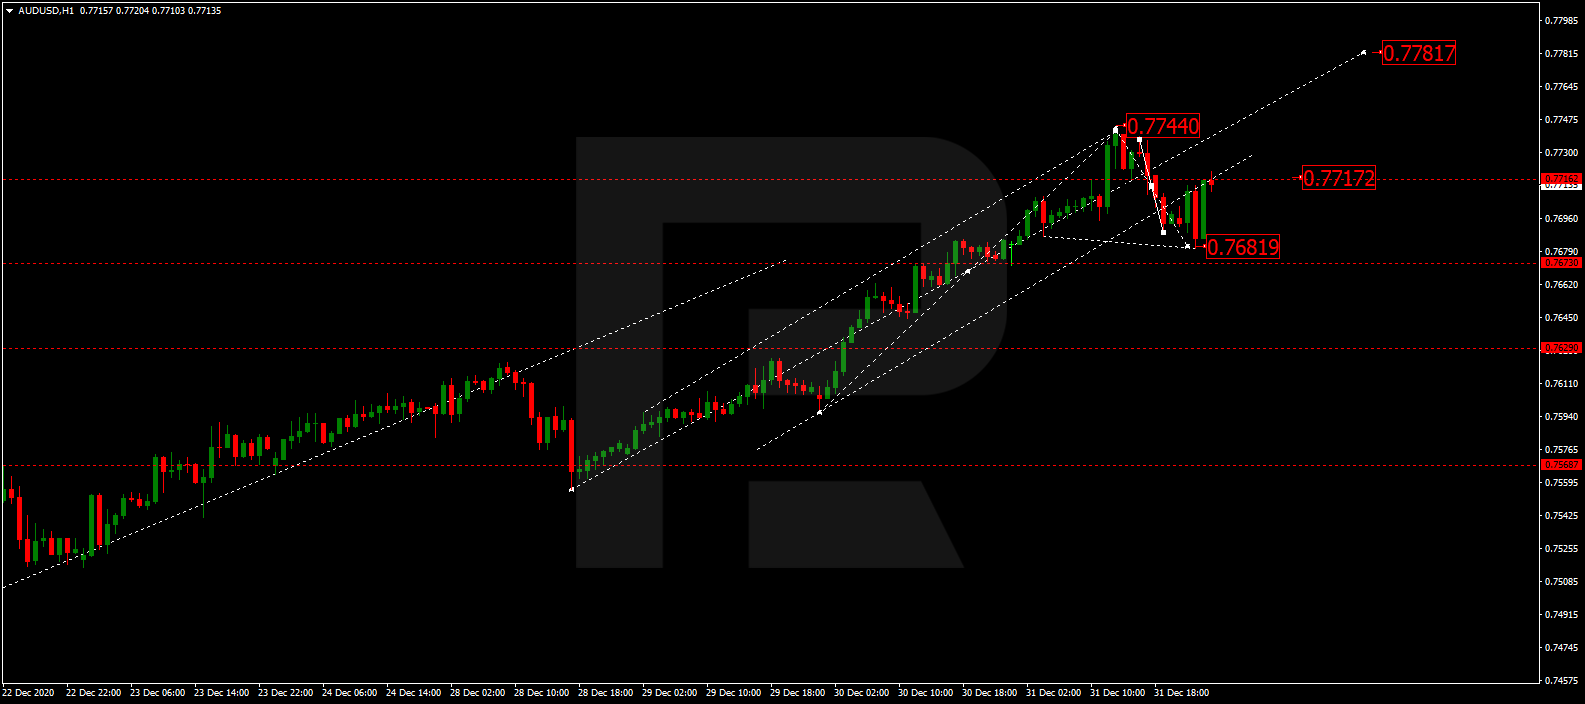
After finishing the ascending wave at 0.7744 and then completing the correction towards 0.7681, AUDUSD has returned to 0.7717 and may form a new consolidation range between the two latter levels. If later the price breaks this range to the upside, the market may resume growing towards 0.7781; if to the downside – start a new decline with the target at 0.7628.

AUDUSD
Risk Warning: the result of previous trading operations do not guarantee the same results in the future

BRENT

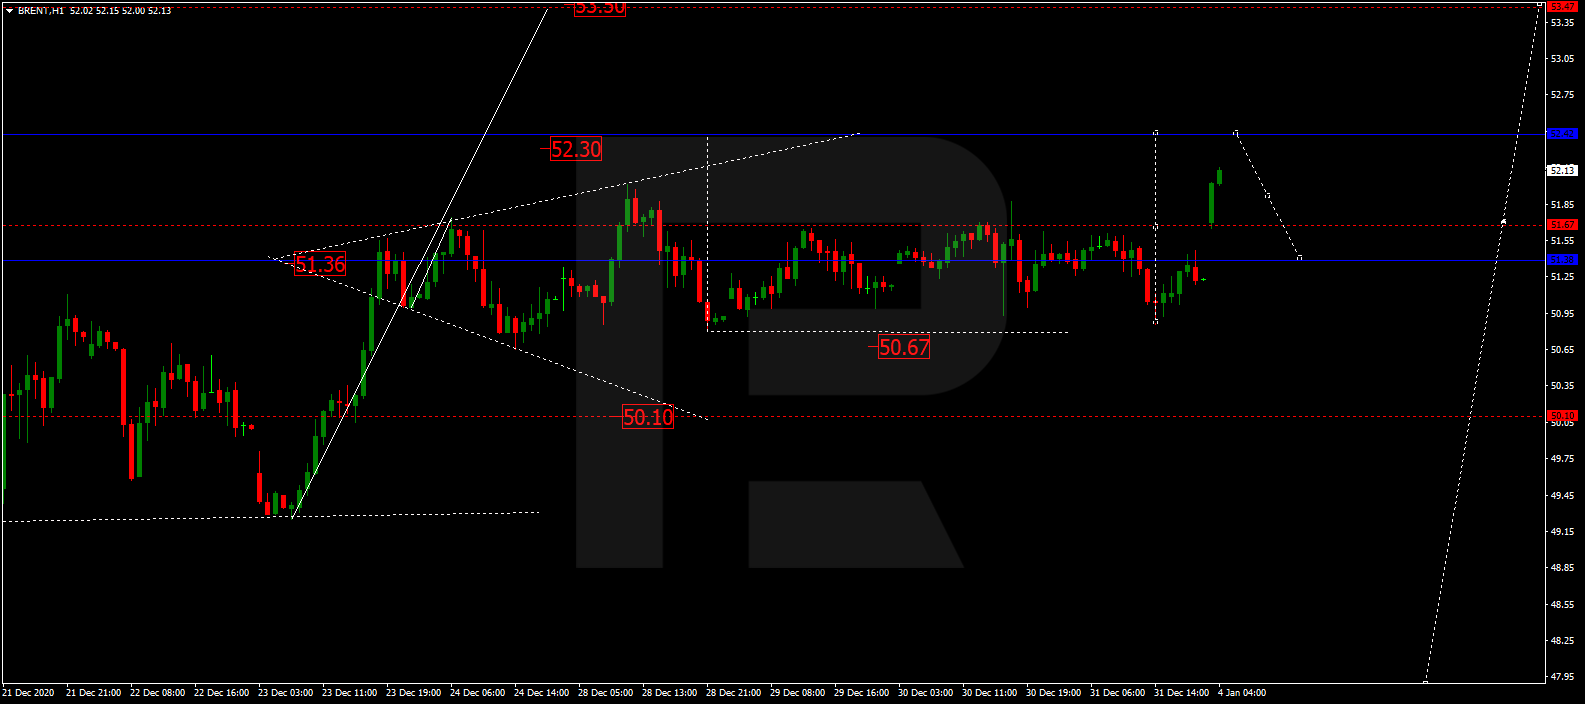
Brent is moving upwards to reach 52.30. After that, the instrument may correct towards 51.55 and then resume trading upwards with the short-term target at 53.50.

BRENT
Risk Warning: the result of previous trading operations do not guarantee the same results in the future

XAUUSD, “Gold vs US Dollar”

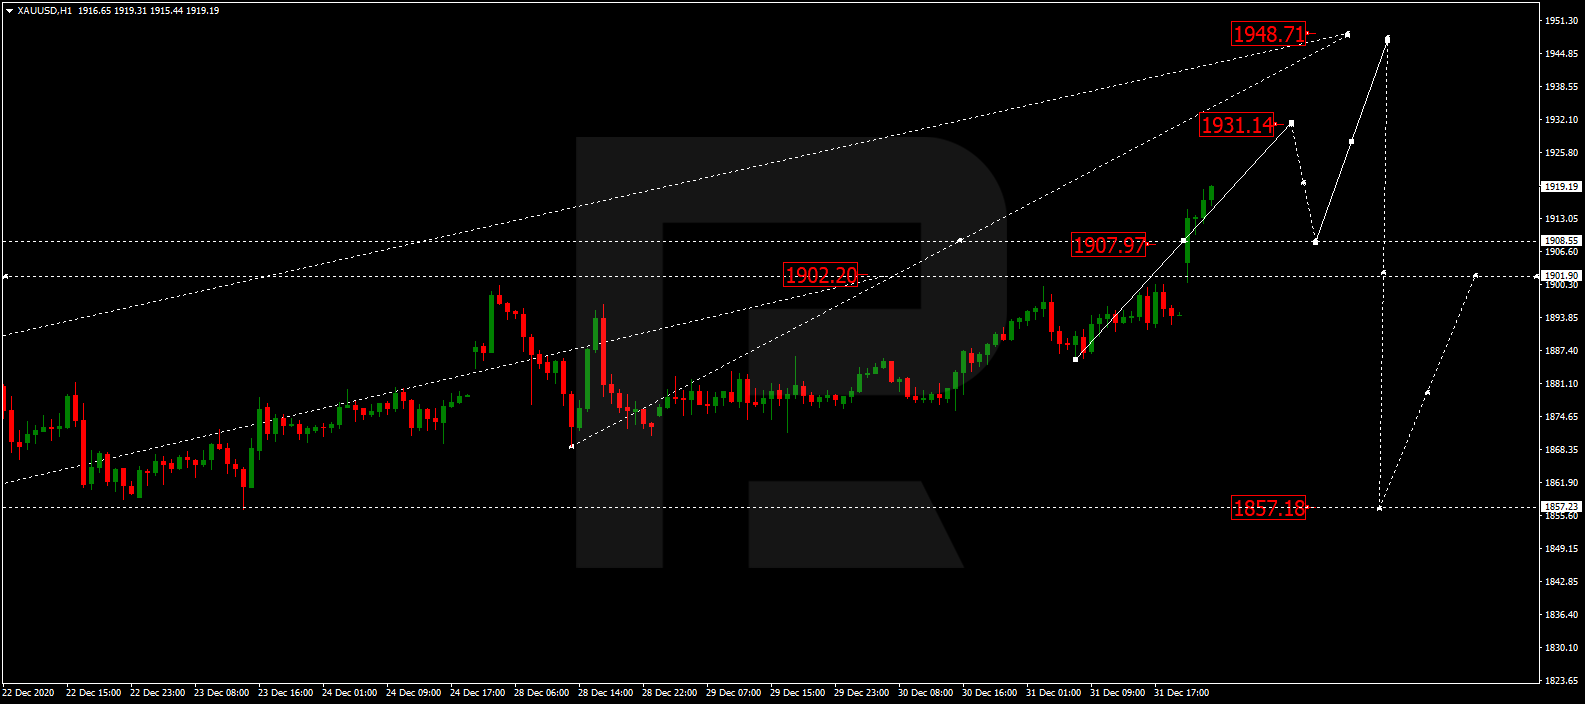
Gold is growing to reach 1931.14. Later, the market may start another correction towards 1907.97 and then form one more ascending structure with the target at 1948.70.

GOLD
Risk Warning: the result of previous trading operations do not guarantee the same results in the future

BTCUSD, “Bitcoin vs US Dollar”

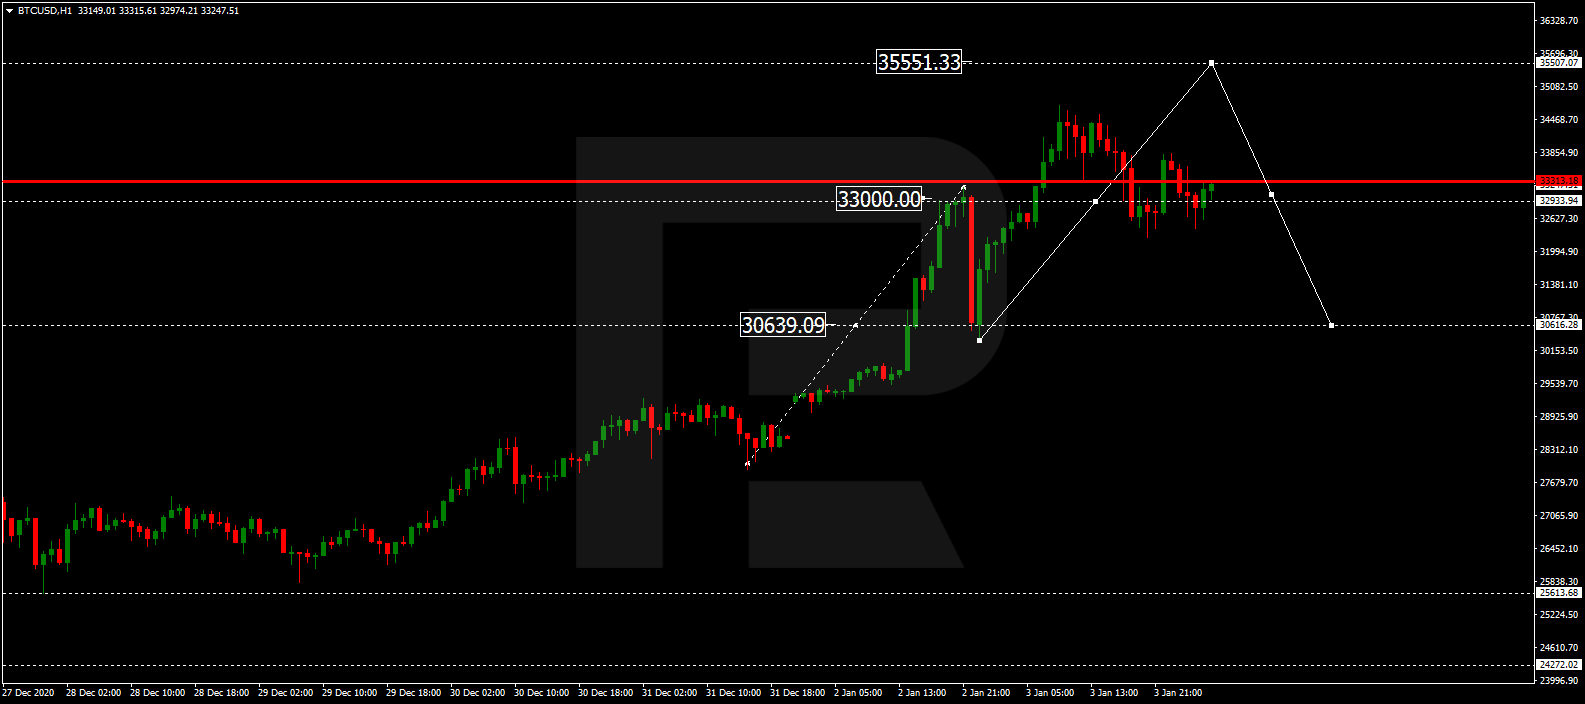
After completing the ascending wave at 33000.00 along with the correction towards 30600.00, BTCUSD is forming another ascending structure to reach 35555.00. After that, the instrument may resume trading downwards with the target at 30000.00.

BTCUSD
Risk Warning: the result of previous trading operations do not guarantee the same results in the future

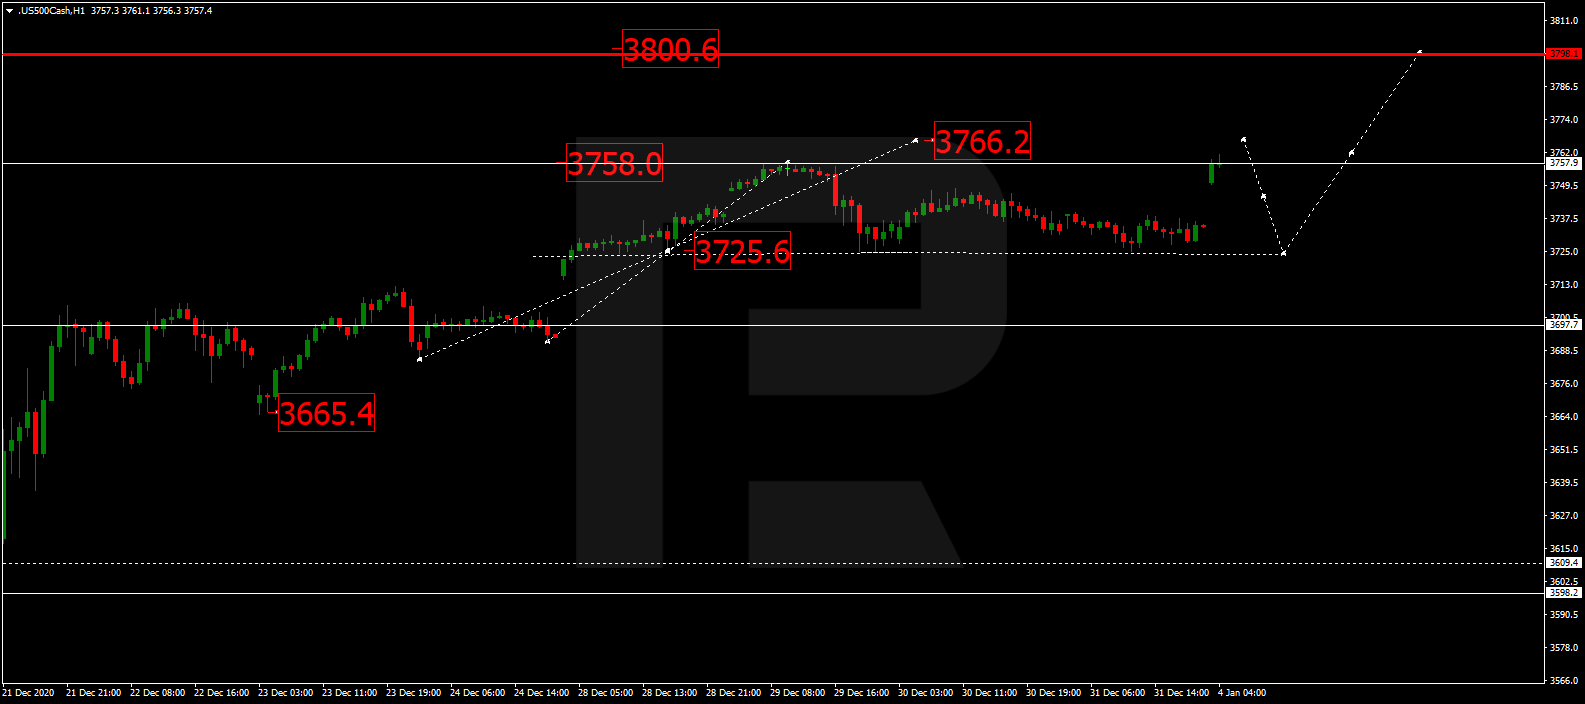
S&P 500

The S&P index is growing towards 3766.1. Later, the market may correct to reach 3725.5 and then complete this ascending wave by trading upwards with the key target at 3800.6. After that, the instrument may form a new descending structure towards 3600.0.

S&P500

Article By RoboForex.com

Attention!
Forecasts presented in this section only reflect the author’s private opinion and should not be considered as guidance for trading. RoboForex LP bears no responsibility for trading results based on trading recommendations described in these analytical reviews.

Fibonacci Retracements Analysis 04.01.2021 (GOLD, USDCHF)

Article By RoboForex.com

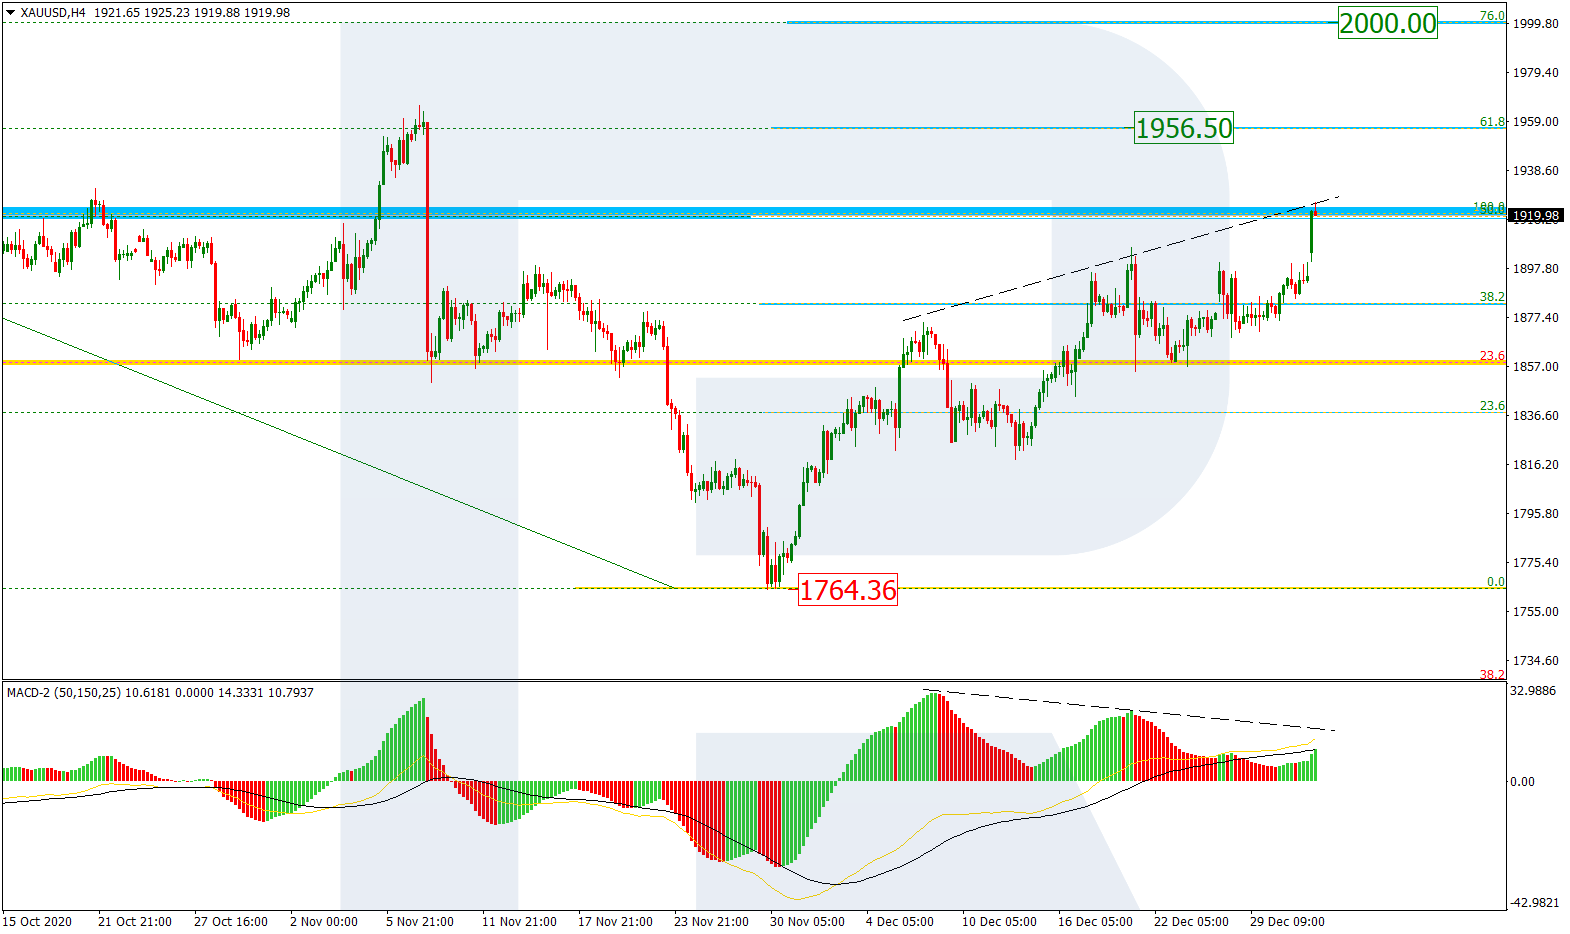
XAUUSD, “Gold vs US Dollar”

As we can see in the H4 chart, after a correctional movement in the form of a Triangle pattern and several tests of the high, XAUUSD has formed a quick rising impulse to break it. As a result, the mid-term uptrend has reached 50.0% fibo and may later continue towards 61.8% and 76.0% fibo at 1956.50 and 2000.00 respectively. However, one shouldn’t disregard a divergence on MACD, which may hint at further mid-term decline towards the key support – the low at 1764.36.

GOLD_H4
Risk Warning: the result of previous trading operations do not guarantee the same results in the future

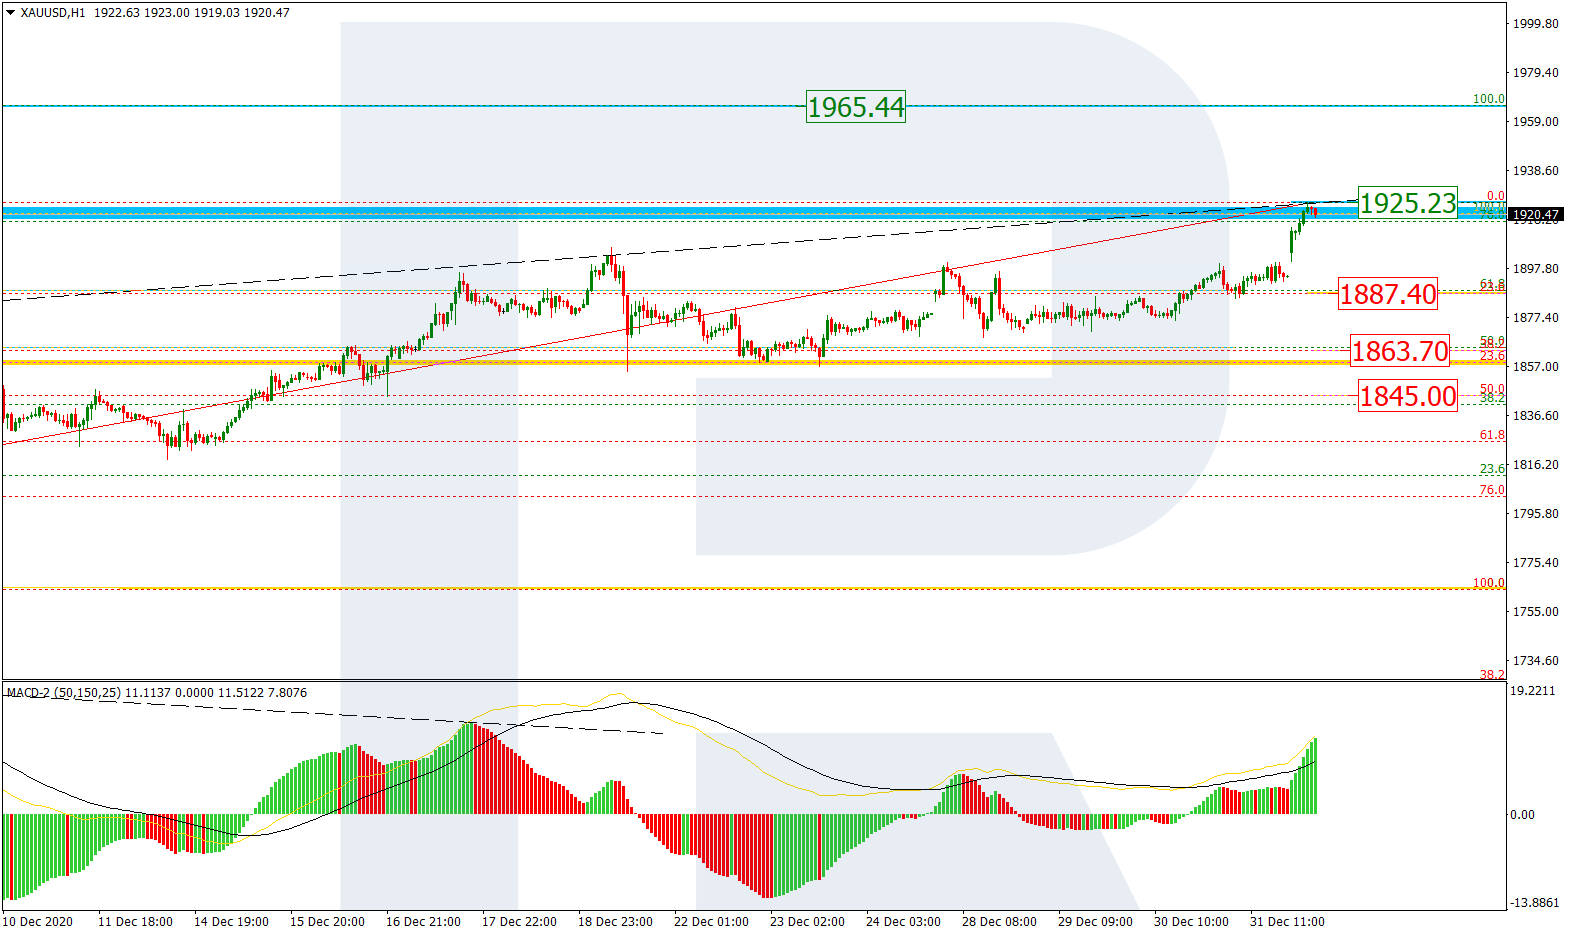
The H1 chart shows that the pair has reached 76.0% fibo. Considering a divergence on MACD, the asset may fall towards 23.6%, 38.2%, and 50.0% fibo at 1887.40, 1863.70, and 1845.00 respectively. However, a breakout of the local high at 1925.23 will result in further trend to the upside.

GOLD_H1
Risk Warning: the result of previous trading operations do not guarantee the same results in the future

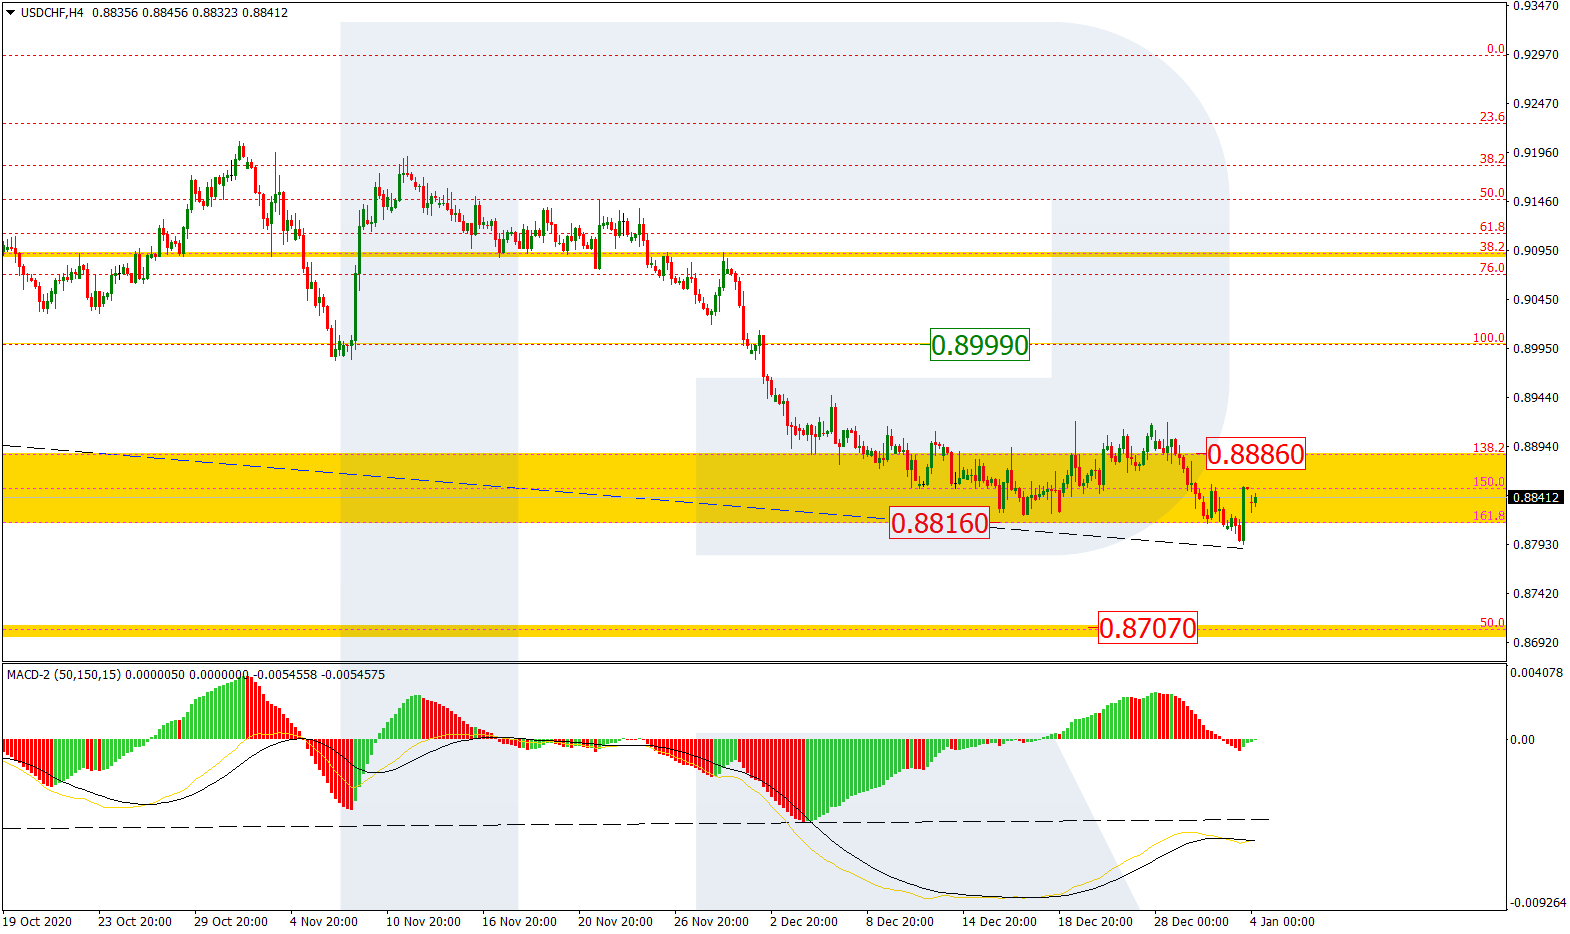
USDCHF, “US Dollar vs Swiss Franc”

As we can see in the H4 chart, after updating the low and attempting to leave the post-correctional extension area between 138.2% and 161.8% fibo at 0.8886 and 0.8816 respectively, USDCHF has skyrocketed and this movement to the upside may be considered as the start of a new mid-term correction. The correctional target remains at the resistance at 0.8999.

USDCHF_H4
Risk Warning: the result of previous trading operations do not guarantee the same results in the future

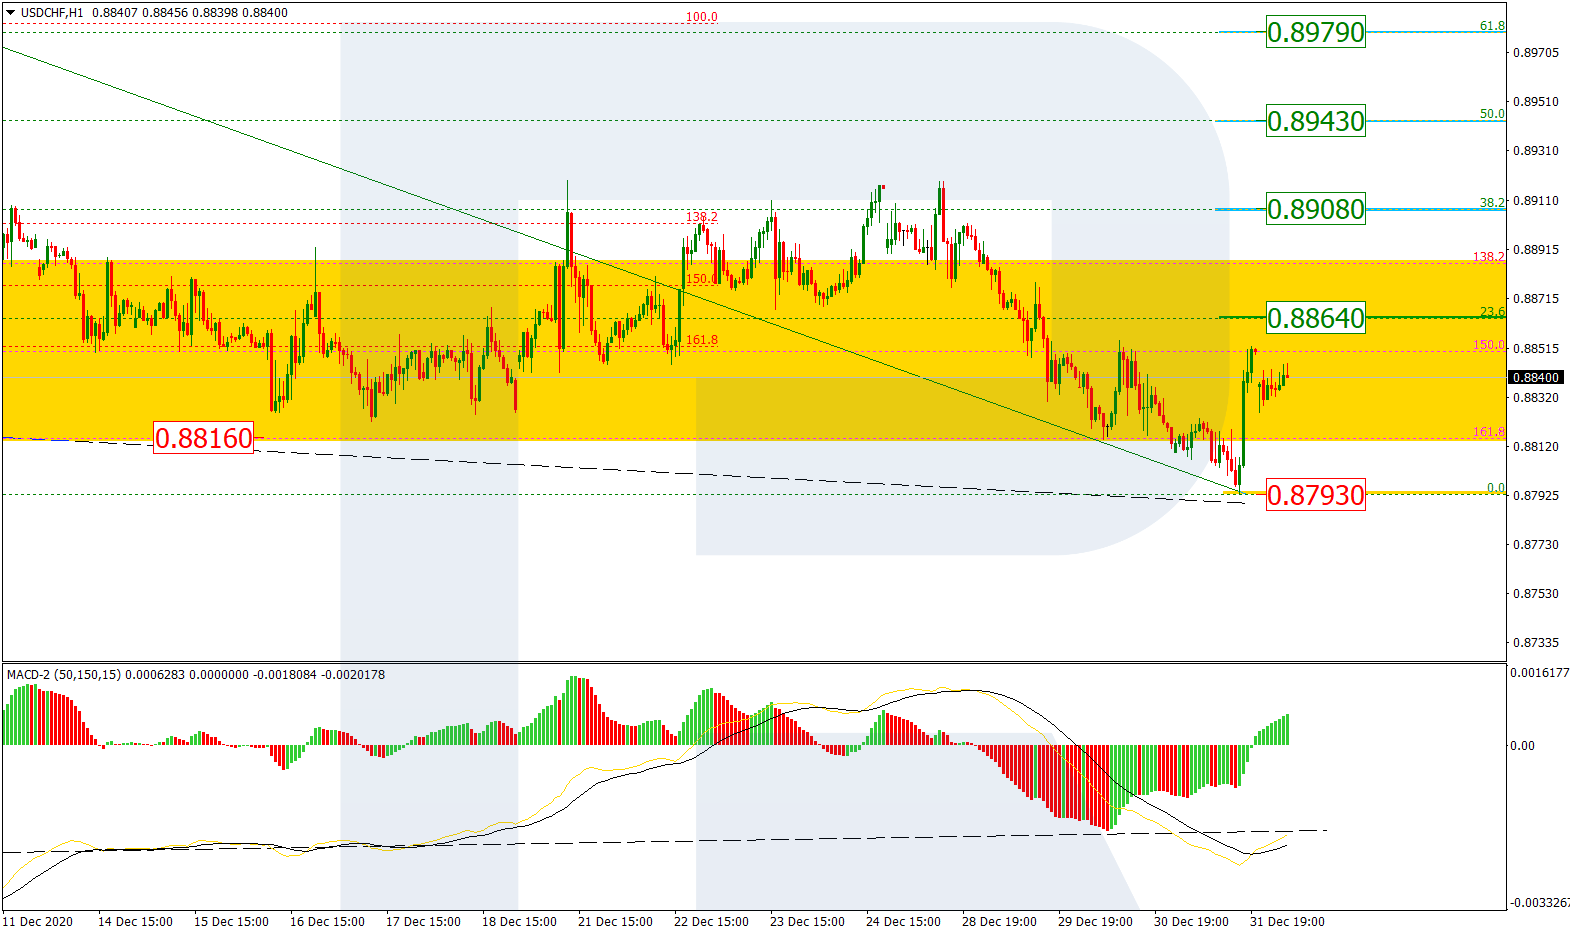
The H1 chart shows a more detailed structure of the correction after a convergence on MACD. The asset is approaching 23.6% fibo at 0.8864 and, after breaking it, may continue moving towards 38.2%, 50.0%, and 61.8% fibo at 0.8908, 0.8943, and 0.8979 respectively. A breakout of the support at 0.8793 will complete this correction.

USDCHF_H1

Article By RoboForex.com

Attention!
Forecasts presented in this section only reflect the author’s private opinion and should not be considered as guidance for trading. RoboForex LP bears no responsibility for trading results based on trading recommendations described in these analytical reviews.

The Analytical Overview of the Main Currency Pairs on 2021.01.04

by JustForex

The EUR/USD currency pair

Technical indicators of the currency pair:
  • Prev Open: 1.2297
  • Prev Close: 1.2216
  • % chg. over the last day: -0.66%

EUR/USD is recovering from Thursday’s fall. There were no particular reasons for the sharp decline. The credit market didn’t show any significant change in trading. The dollar index continues to remain close to the minimum values, continuing to decline in the Asian session. The pair remained in an ascending channel, bouncing off the nearest support.

Trading recommendations
  • Support levels: 1.2216, 1.2151
  • Resistance levels: 1.2309, 1.2353

The main trading scenario for EUR/USD is trading in a sideways range. Technically, the pair indicated the first sign of correction, breaking through the lower border of the channel. But considering the time when it happened, the break-through may turn out to be false. Now the euro is in an ascending channel again. The ADX almost didn’t react to the fall. The price is stuck between two moving averages. Given the mixed signals and the first day of trading, low volatility can be expected.

Alternative scenario: if the price can fix below the level of 1.2216, it is possible that the price will go lower to 1.2151 – 1.2130. A break-through of 1.2309 will resume the uptrend.

EUR/USD
News feed for 2021.01.04:
  • – German Manufacturing PMI (Dec.) at 11:55 (GMT+2);
  • – Eurozone Manufacturing PMI (Dec.) at 12:00 (GMT+2).

The GBP/USD currency pair

Technical indicators of the currency pair:
  • Prev Open: 1.3620
  • Prev Close: 1.3658
  • % chg. over the last day: +0.28%

The pound is gradually continuing to renew its highs, showing no signs of a correction. The pair is the strongest among all the majors. However, we can’t say the same about British securities. Gilts profitability continues to fall, throwing into question the further long-term growth of the sterling. But technically, the trend continues and the nearest resistance is far away.

Trading recommendations
  • Support levels: 1.3627, 1.3428
  • Resistance levels: 1.4386

The main scenario is risk-averse buying on a decline. The pair’s technical characteristics remain strong. The price is above the moving averages. But on the hourly timeframe, the ADX showed a decrease in the trend potential after moving into the overvalued area. On H4, the oscillator just hit this area. With that in mind, you should be vigilant when building up long positions.

Alternative scenario: if the pair fixes below 1.3627, the northern scenario is likely to reverse and the pair will head towards 1.3428.

GBP/USD
News feed for 2021.01.04:
  • – UK Manufacturing PMI (Dec.) at 12:30 (GMT+2).

The USD/JPY currency pair

Technical indicators of the currency pair:
  • Prev Open: 103.17
  • Prev Close: 103.26
  • % chg. over the last day: +0.08%

USD/JPY continues to be dominated by bears. With the opening of trading in Europe, the main support level was broken. Apparently, the move is based solely on the decline of the dollar index, as the stock market continues to rise. The 102.03 mark becomes the closest support in case the price fails to return above 102.89 during the day.

Trading recommendations
  • Support levels: 102.03, 101.20
  • Resistance levels: 103.33, 103.90

The main scenario – selling on growth. For the fourth trading day, the pair is confidently remaining below the moving averages. The MACD is below zero, while the ADX continues to react only to a decline. Now the potential for the trend has decreased, which may indicate a slowdown in the rate of decline. But there are no signs of correction yet.

An alternative scenario assumes a break-though of 103.33 from the bottom up. In this case, the pair may reach 103.90.

USD/JPY
There is no news feed for today.

The USD/CAD currency pair

Technical indicators of the currency pair:
  • Prev Open: 1.2751
  • Prev Close: 1.2757
  • % chg. over the last day: +0.05%

There was a large portion of bearish pressure with the opening of trades. A decline in the dollar and an increase in oil prices brought the pair back to the December lows. The market is awaiting a decision of OPEC+ concerning the extension of the production cut program. Against this background, serious changes can occur during the day.

Trading recommendations
  • Support levels: 1.2686, 1.2523
  • Resistance levels: 1.2875, 1.2954

The main scenario – risk-averse selling during growth. The MACD shows convergence, which gives confidence to the bears. But ADX didn’t show a significant reaction with a significant withdrawal of the price from the moving averages. At the same time, the price bounced off its strong support level, indicating a stop near current levels. Based on this, we can wait for the price to return to the SMA 50 at 1.2750 and try to build up sales in case of a rebound from the line.

Alternative scenario: if the price manages to return above 1.2750 – 1.2787, the pair may resume the upward correction.

USD/CAD
There is no news feed for today.

by JustForex


This article reflects a personal opinion and should not be interpreted as an investment advice, and/or offer, and/or a persistent request for carrying out financial transactions, and/or a guarantee, and/or a forecast of future events.

Dollar kicks off 2021 on the backfoot, Gold shines

By Hussein Sayed, Chief Market Strategist (Gulf & MENA), ForexTime

The Greenback remains an unloved currency on the first trading day of 2021. Low interest rates and an improving economic outlook following vaccines rollout has led to further short selling in the US Dollar, particularly against the Euro and Chinese Yuan.

China’s Renminbi strengthened 1% in early Monday trade, with USD/CNY crossing below 6.50 for the first time since June 2018. That has erased all Chinese currency losses since the US-China trade war kicked off officially in July 2018.  The strength in the Chinese Renminbi came despite slowing manufacturing activity. The Caixin/Markit manufacturing PMI slipped 1.9 points in December to 53.0. However, activity in the world’s second-largest economy remains in expansionary mode, while developed economies continue to impose lockdowns to control the virus spread.

Another supporting source for the currency comes from China’s Foreign Exchange Trade System which announced a reduction in the US Dollar’s weighting in the currency basket to 18.79% from 21.59%, while increasing the Euro’s weighting to 18.15% from 17.40%. The absence of any intervention from the PBOC or state banks would suggest further gains in the upcoming weeks with a possible retest of the 2018 lows of 6.24.

Tuesday’s Georgia Senate runoff elections will be critical for the US Dollar as a Democrat win of the two Senate seats could potentially unleash a lot more stimulus which simply suggests more pain for the Greenback.

Gold is also starting the new year with a bang as the precious metal has surged more than 1.2% and hit a high of $1925. Multiple factors are likely to continue lending support for Gold in the upcoming months. The pandemic will not disappear in a matter of weeks with tougher lockdowns also expected as Covid cases continue to rise. Hence central banks will need to keep policy loose by expanding their balance sheets. And given we are starting 2021 with extraordinarily rich valuations in equity markets, Gold is a must-have asset in portfolios. I think it’s only a matter of time before we cross back above $2,000 and I won’t be surprised if new highs are recorded in the first quarter of 2021.

Disclaimer: The content in this article comprises personal opinions and should not be construed as containing personal and/or other investment advice and/or an offer of and/or solicitation for any transactions in financial instruments and/or a guarantee and/or prediction of future performance. ForexTime (FXTM), its affiliates, agents, directors, officers or employees do not guarantee the accuracy, validity, timeliness or completeness, of any information or data made available and assume no liability as to any loss arising from any investment based on the same.


Forex-Time-LogoArticle by ForexTime

ForexTime Ltd (FXTM) is an award winning international online forex broker regulated by CySEC 185/12 www.forextime.com