Archive for Stock Market News – Page 42

Why Meta’s share price collapse is good news for the future of social media

By Renaud Foucart, Lancaster University 

Facebook may not be the original social media platform but it has stood the test of time – until recently. Meta, the company that owns Facebook, Instagram and WhatsApp, saw its value plummet by around $80 billion (£69 billion) in just one day at the end of October, after its third-quarter profits halved amid the global slowdown. Meta is now valued at around $270 billion compared with more than $1 trillion last year.

Several issues have caused investors to turn away from the social media giant, including falling advertising revenue, a conflict with Apple over its app store charging policy, and competition for younger audiences from newer platforms such as TikTok.

Meta’s chief-executive Mark Zuckerberg has also used his majority control to double down on his ambitions for the “metaverse”, a virtual reality project on which he has already spent more than $100 billion – with questionable results according to initial investor and media reaction. Zuckerberg has promised even more investment in the metaverse next year.

It’s tempting to describe this spending spree as a billionaire’s “insane fantasy”, but there is a simpler explanation. As dominant platforms compete for a limited amount of advertising revenue, regulation – particularly when it differs between countries or regions – has created space for more competitors. This is good news for new social media companies, but it also means that the only way Meta is likely to be able to keep its dominant position is by placing a massive bet on the technology of the future. Zuckerberg believes that means the metaverse, but this remains to be seen.

Tech’s changing fortunes

Even with its recent troubles, Meta owns the largest social network in the world. Those recent results that caused investors to flee in their droves still showed total revenues of $27 billion and profits of $4.4 billion.

To maintain its position as market leader in the past, Meta has typically bought its most promising competitors as early as possible. Integrating these newly acquired startups into the company’s ecosystem helped to maximise advertising revenue and preclude competition.

Research shows that digital markets are typically dominated by a single firm, but also that these firms tend to be much more specialised than the major companies of the past. Meta is only active in social media and makes money almost exclusively by selling advertising.

Attempts by such firms to expand into other areas typically fail – know anyone with a Facebook phone? And while you may not remember Google’s attempt at social media, iPhone users are probably at least aware of Apple’s maps app.

So Facebook relies on consumers using devices produced by other tech companies to make money. But as global social media advertising revenue slows down, this is becoming more difficult. Apple has begun charging Meta for the revenue it makes from iPhone users, for example. And research shows that, when two companies compete to make money from the same captive source, their successive markups not only push prices higher for consumers but also keep profits lower for both firms.

Global domination fail

Meta’s strategy has, until recently, allowed it to rule social media in western markets – but not in China, a country of more than 300 million social media users. Since 2009, Facebook has been blocked by the country’s “great firewall”, the largest and most sophisticated system of censorship in the world.

Reported attempts to adapt Facebook to suit Chinese government media control have never been successful. And so, Chinese company ByteDance was able to launch a news platform called Toutiao in 2012 without having to compete with a dominant social network. In 2016, ByteDance launched Douyin, a social media platform for publishing short videos which was subsequently released to the rest of the world in 2018 as TikTok.

Despite not being profitable, ByteDance’s market capitalisation is now estimated at around $300 billion – versus Meta’s current £270 billion valuation. It is also popular among younger users that tend to be much more avid social media users.

Meta cannot simply buy TikTok: it is too big, not publicly traded and under tight control by the Chinese government. Zuckerberg’s firm has instead tried to compete by launching similar features on Instagram. Ironically, the only large market where this strategy is really working is India, a country that banned TikTok in 2021 due to a military conflict with China.

Fair competition

At the same time that TikTok has been expanding beyond Meta’s reach, western regulators have also started to examine the impact of the lack of competition in digital markets on innovation. While research shows that the winner-take-all nature of highly innovative markets is typically good for consumers, this is only true when all companies get a fair chance to become dominant.

In addition to recent rulings against tech company dominance by its highest court, the European Union also recently introduced the Digital Markets Act. This outlaws many practices used by dominant firms to preserve their status in a market.

Similar legislation is expected from the US after the November midterm elections, while the UK has forced Meta to sell gif library Giphy to ensure it doesn’t decrease competition in the online advertising sector.

All of this means that, for Facebook to remain dominant, Meta needs to invest in its own products. To be the market leader of tomorrow, the company cannot simply count on buying up promising startups.

But its metaverse is a nebulous project and an odd bet. After all, Google has already failed to drum up interest in Google Glass, even though the technology behind it was successful. What has changed to convince normal people to regularly wear virtual reality headsets?

The only alternative for Meta may be to find a better idea in which to invest. In the meantime, regulation continues to protect potential competitors. This is great news for consumers and creators alike: now might be the best moment to launch an innovative social media format that can actually compete with giants like Meta to become the market leader.

The Conversation

About the Author:

Renaud Foucart, Senior Lecturer in Economics, Lancaster University Management School, Lancaster University

This article is republished from The Conversation under a Creative Commons license. Read the original article.


Solar Co.’s Equipment Sales Rise 74% YOY

Source: Streetwise Reports  (11/3/22)

Shares of turnkey residential solar firm Sunrun Inc. traded 19% higher after the company reported Q3/22 financial results that included a 44% YoY increase in revenue and a 21% gain in its installed customer base.

After U.S. markets closed yesterday, residential solar, battery storage, and energy services company Sunrun Inc. (RUN:NASDAQ), announced financial results for the third quarter of 2022, which ended September 30, 2022.

The company’s CEO, Mary Powell, commented, “Sunrun continues to become faster, better, and stronger, delivering a quarter that demonstrates the financial value we can create for our customers and shareholders, leading the market and now serving over 760,000 customers . . . Sunrun’s energy subscription model, which can deliver clean energy technology and innovation that is more affordable and reliable for customers, is particularly well suited for this economic environment.”

Sunrun’s CFO Danny Abajian remarked, “The Sunrun team executed well in Q3, delivering volumes above the midpoint of our prior guidance range, despite pressures on sales and installation activities at the end of the quarter from the devastating hurricanes in Puerto Rico and Florida. The actions we took throughout the year to respond to higher interest rates and material costs have resulted in strong improvements in our Net Subscriber Value, which exceeded our prior guidance.”

The company explained that the growth opportunity for the solar industry is massive and remains intact. The firm noted that the U.S. residential electricity market is estimated at greater than US$194 billion and that presently only about 4% of the 77 million addressable homes in the U.S. are equipped with solar power.

Sunrun advised that for FY/22, it estimates that the Total Value Generated will exceed US$1 billion.

The company added that solar-enable households that own electric vehicles (EVs) typically use two-time the amount of electricity, which significantly increases the firm’s value proposition.

The company believes that as it adds new customers and grows its network storage capacity, it will also improve its position to meet the needs of the US$125 billion yearly utility capex market for distributive power.

The company discussed several recent operating highlights and noted that as of the end of Q3/22, it had a total of 47,000 installed solar and battery systems in the U.S.

The firm advised that the Inflation Reduction Act (IRA) that was enacted into law in August 2022 will serve to “enhance and extend the investment tax credit (ITC) available to Sunrun.” Specifically, the IRA will allow for a 10-year extension of the 30% solar ITC. In addition, the IRA offers tax credits of US$7,500 for new EVs and US$4,000 for used EVs.

The company stated that during Q3/22, it reported the launch of its Level 2 EV charger as a complement to its home solar energy systems. The firm said about 80% of EV charging is done at home, and the integration of home EV charging is critical.

Sunrun listed that in Q3/22, it added a total of 35,760 new customers, including 25,468 subscriber additions, representing a 21% increase over Q3/21. The firm indicated that as of the end of Q3/22, it had an installed base of 759,937 customers, including 639,748 subscribers.

The company stated that as of September 30, 2022, annual recurring revenue generated by subscriptions was US$969 million and added that the average contract life remaining on these subscriptions is 17.6 years.

The company advised that the total value generated in Q3/22 from subscriptions was US$337.7 million. The firm said that net subscriber value increased to US$13,259, compared to US$7,910 in Q2/22.

Sunrun indicated that in Q3/22, it had 255.8 Megawatts of installed solar energy capacity and that subscribers represented about 181.6 Megawatts of the total. The firm added that as of September 30, 2022, “its Networked Solar Energy Capacity was 5,392 Megawatts, and its Networked Solar Energy Capacity for Subscribers was 4,567 Megawatts.”

The company offered some forward guidance and stated that for FY/22, it expects that it will grow its installed solar energy capacity by about 25%. The firm indicated that during Q4/22, it anticipates that net subscriber value will rise sequentially compared to Q3/22.

Sunrun advised that for FY/22, it estimates that the Total Value Generated will exceed US$1 billion.

The company reported that during Q3/22, total revenue increased by 44% year-over-year to US$631.9 million, compared to US$193.1 million in Q3/21.

The firm stated that for Q3/22, revenues from customer agreements and incentives increased by 17% y-o-y to US$271.2 million, and revenues from solar energy systems and product sales rose by 74% y-o-y to US$360.7 million.

The company advised that for Q3/22, it recorded a GAAP net income of US$210.6 million, or US$0.96 per diluted share, versus a GAAP net income of US$24.1 million, or US$0.11 per diluted share in Q3/21.

Sunrun Inc. is a home solar, battery storage, and energy services firm based in San Francisco, Calif. The company offers affordable and reliable energy to residential users. The firm also manages customer premises and shared stored solar energy from the batteries across the electric grid, which benefits households, utility companies, and the environment.

Sunrun started the day with a market cap of around US$4.6 billion, with approximately 212.1 million shares outstanding and a short interest of about 14%. RUN shares opened nearly 6% higher today at US$22.90 (+US$1.24, +5.72%) over yesterday’s US$21.66 closing price. The stock traded today between US$22.88 and US$26.47 per share and closed for trading at US$25.71 (+US$4.05, +18.70%).

Disclosures:

1) Stephen Hytha wrote this article for Streetwise Reports LLC and provides services to Streetwise Reports as an independent contractor. He or members of his household own securities of the following companies mentioned in the article: None. He or members of his household are paid by the following companies mentioned in this article: None.

2) The following companies mentioned in this article are billboard sponsors of Streetwise Reports: None. Click here for important disclosures about sponsor fees.

3) Comments and opinions expressed are those of the specific experts and not of Streetwise Reports or its officers. The information provided above is for informational purposes only and is not a recommendation to buy or sell any security.

4) The article does not constitute investment advice. Each reader is encouraged to consult with his or her individual financial professional and any action a reader takes as a result of information presented here is his or her own responsibility. By opening this page, each reader accepts and agrees to Streetwise Reports’ terms of use and full legal disclaimer. This article is not a solicitation for investment. Streetwise Reports does not render general or specific investment advice and the information on Streetwise Reports should not be considered a recommendation to buy or sell any security. Streetwise Reports does not endorse or recommend the business, products, services or securities of any company mentioned on Streetwise Reports.

5) From time to time, Streetwise Reports LLC and its directors, officers, employees or members of their families, as well as persons interviewed for articles and interviews on the site, may have a long or short position in securities mentioned. Directors, officers, employees or members of their immediate families are prohibited from making purchases and/or sales of those securities in the open market or otherwise from the time of the decision to publish an article until three business days after the publication of the article. The foregoing prohibition does not apply to articles that in substance only restate previously published company releases.

Nestle Continues To Execute as Profits Grow

Source: Adrian Day  (10/31/22)

Today expert Adrian Day discusses results from two core holdings, both doing well, according to him, despite cost inflation. Day believes you can use current weakness to accumulate a portfolio of blue chips. Nestle SA (NESN:VX; NSRGY:OTC) reported a strong quarter, with organic growth of 8.5%, broad-based across most geographies and categories, and off sales increase of 9.2%. Pricing rose 7.5%, reflecting cost inflation.

The company is looking for full-year growth of around 8%, with an operating profit expected at around 17%. These numbers are all near the top end of the company’s goals.

Net acquisitions had a positive impact of 1.2% on earnings. The company continued to build the Health Science division, buying two small companies in Brazil and New Zealand. Acquisitions also included The Bountiful Company and Orgain, two well-known niche brands.

Nestlé also announced plans to acquire Seattle’s Best Coffee brand from Starbucks.

Spending on Pets Grows Rapidly

As has been the case recently, pet care continued to be the largest contributor to organic growth, particularly the premium brands and veterinary products. It seems people are still prepared to spend increasing amounts on their pets.

Nestlé, the world’s largest food and beverage group, has a strong balance sheet, reflected in Moody’s Aa3 rating. It has increased revenue (and its dividend) in virtually all of the past 60 years and never cut the payout over that period.

It bought back over Euro 6 billion of stock last year and continues with the program. With a consistently high return on capital and equity–its return on invested capital is more than twice virtually every peer–it is trading near the low end of its valuations (with a p/e of 18.3, its lowest since 2015), though the yield (at 2.6%) is lower than its historical average.

Nestlé is a core holding and is a Buy here.

Consistency Is a Virtue, as Agnico Beats Expectations Again

Agnico Eagle Mines Ltd. (AEM:TSX; AEM:NYSE) beat market expectations modestly, with a solid quarter that saw most projects advance on track. Costs were relatively under control, though synergies with Kirkland after the merger are still helping, as is the low Canadian dollar keeping USD costs down at its Canadian mines. Management noted that mitigating cost increases is a major focus.

One mine, the new Amaruq, in Nunavit, completed on time and on budget, is experiencing a successful ramp-up, more than doubling production since the first quarter of the year and helping the company’s increase in production.

President Ammar AlJoundi called it “a world-class mine by any standards.” Management, in fact, emphasized the continued progress on all the expansion projects, with some excellent drill results, validating Agnico’s theme of leveraging existing mines and infrastructure.

Cash Flow Used To Pay Down Debt and Buy Back Shares

Agnico has earned an operating margin of US$2.4 billion year-to-date. It used this to reduce debt, repaying US$100 million notes to end the quarter with net debt of US$520 million.

And it repurchased around one million shares, almost twice as many as it had purchased in the previous two quarters.

Agnico, as we have discussed before, is a solid, conservative company with a strong culture, with mines in five mining-friendly jurisdictions, with top management, and a strong balance sheet.

The stock price has bounced in the last 10 days to the top of its four-month range, so we will look for a pull-back to add to positions. But the valuations are quite low, trading at less than 1.3 times book and nine times cash flow.

If you do not own one, this is one to Buy and put away.

BEST BUYS this week, in addition to the above, include Midland Exploration Inc. (MD:TSX.V); Franco-Nevada Corp. (FNV:TSX; FNV:NYSE); Lara Exploration Ltd. (LRA:TSX.V); and Barrick Gold Corp. (ABX:TSX; GOLD:NYSE).

Adrian Day Disclosures:

Adrian Day’s Global Analyst is distributed for $990 per year by Investment Consultants International, Ltd., P.O. Box 6644, Annapolis, MD 21401. (410) 224-8885. www.AdrianDayGlobalAnalyst.com. Publisher: Adrian Day. Owner: Investment Consultants International, Ltd. Staff may have positions in securities discussed herein. Adrian Day is also President of Global Strategic Management (GSM), a registered investment advisor, and a separate company from this service. In his capacity as GSM president, Adrian Day may be buying or selling for clients securities recommended herein concurrently, before or after recommendations herein, and may be acting for clients in a manner contrary to recommendations herein. This is not a solicitation for GSM. Views herein are the editor’s opinion and not fact. All information is believed to be correct, but its accuracy cannot be guaranteed. The owner and editor are not responsible for errors and omissions. © 2022. Adrian Day’s Global Analyst. Information and advice herein are intended purely for the subscriber’s own account. Under no circumstances may any part of a Global Analyst e-mail be copied or distributed without prior written permission of the editor. Given the nature of this service, we will pursue any violations aggressively.

Disclosures:

1) Adrian Day: I, or members of my immediate household or family, own securities of the following companies mentioned in this article: All. I personally am, or members of my immediate household or family are, paid by the following companies mentioned in this article: None. My company has a financial relationship with the following companies mentioned in this article: None. Funds controlled by Adrian Day Asset Management, which is unaffiliated with Adrian Day’s newsletter, hold shares of the following companies mentioned in this article: All. I determined which companies would be included in this article based on my research and understanding of the sector.

2) The following companies mentioned in this article are billboard sponsors of Streetwise Reports: None. Click here for important disclosures about sponsor fees. The information provided above is for informational purposes only and is not a recommendation to buy or sell any security.

3) Statements and opinions expressed are the opinions of the author and not of Streetwise Reports or its officers. The author is wholly responsible for the validity of the statements. The author was not paid by Streetwise Reports for this article. Streetwise Reports was not paid by the author to publish or syndicate this article. Streetwise Reports requires contributing authors to disclose any shareholdings in, or economic relationships with, companies that they write about. Streetwise Reports relies upon the authors to accurately provide this information and Streetwise Reports has no means of verifying its accuracy.

4) This article does not constitute investment advice. Each reader is encouraged to consult with his or her individual financial professional and any action a reader takes as a result of information presented here is his or her own responsibility. By opening this page, each reader accepts and agrees to Streetwise Reports’ terms of use and full legal disclaimer. This article is not a solicitation for investment. Streetwise Reports does not render general or specific investment advice and the information on Streetwise Reports should not be considered a recommendation to buy or sell any security. Streetwise Reports does not endorse or recommend the business, products, services, or securities of any company mentioned on Streetwise Reports.

5) From time to time, Streetwise Reports LLC and its directors, officers, employees, or members of their families, as well as persons interviewed for articles and interviews on the site, may have a long or short position in the securities mentioned. Directors, officers, employees, or members of their immediate families are prohibited from making purchases and/or sales of those securities in the open market or otherwise from the time of the decision to publish an article until three business days after the publication of the article. The foregoing prohibition does not apply to articles that in substance only restate previously published company release. As of the date of this article, officers and/or employees of Streetwise Reports LLC (including members of their household) own securities of  Agnico Eagle Corp., a company mentioned in this article.


Mid-Week Technical Outlook: Major Indices

By ForexTime 

An uneasy calm settled across financial markets ahead of the Federal Reserve’s policy meeting this evening. Equities struggled for direction; the dollar index remained static while gold prices were little changed.

Sentiment in general remains shaky and fragile thanks to concerns over slowing global growth with investors adopting a guarded approach ahead of what could be a volatile event. Markets widely expect the Federal Reserve to raise interest rates by 75bp in November but much attention will be directed towards the press conference which could offer fresh clues into monetary policy.

Our focus this afternoon will be directed toward the global equity arena, especially US indices which remain highly reactive to Fed rate hike expectations.

S&P 500 tangled between MA’s

After failing to secure a daily close above the 100-day SMA, the S&P 500 has the potential to trade lower if the 50-day SMA is breached. A strong breakdown below 3810 could trigger a selloff towards 3760 and 3700, respectively. Should 3810 prove to be reliable support, prices could rebound towards 3945 and 4000. It is worth keeping in mind that the short-term outlook will be influenced by the Fed meeting this evening and the US jobs report on Friday.

Nasdaq trapped below 11650?

It looks like the Nasdaq could gearing up for a selloff. After failing to break above the 11650 resistances, prices have tumbled with bears eyeing the 11037 supports. The Fed rate decision and press conference may influence the Nasdaq’s short-term outlook. Technical levels to watch out for are 11037 and 10716. Given how prices are trading below the 50, 100, and 200 Simple Moving Average – bears still have some power. A strong break under 10716 could signal a selloff towards 10436.

FTSE100 lingers below resistance

Since punching above the 7200-resistance level, prices have struggled to push higher as the 100-day Simple Moving Average offered another line of resistance. Although the FTSE100 has staged a rebound from the 6705 regions, prices still remain in a bearish channel. Should 7200 prove to be a tough nut to crack for bulls, prices could sink back towards 7000. Alternatively, a strong breakout above 7200 may open the doors towards 7340 – a level where the 200-day SMA resides.

EURO STOXX 50 breakout or fakeout?

This index remains in an uptrend on the daily charts as there have been consistently higher highs and higher lows. Prices are trading above the 50 and 100-day SMA but below the 200-day which could offer strong resistance. If bulls lose momentum and secure a solid daily close below 3650, this may trigger a selloff back towards 3550 – a level just above the 100-day SMA. Alternatively, a strong daily close above the 3685 regions could inject bulls with enough confidence to push above the 200-day SMA. Such a development may result in an incline towards 3700, 3770, and 3820, respectively.


Forex-Time-LogoArticle by ForexTime

ForexTime Ltd (FXTM) is an award winning international online forex broker regulated by CySEC 185/12 www.forextime.com

Beyond passenger cars and pickups: 5 questions answered about electrifying trucks

By Daniel Sperling, University of California, Davis; Lewis Fulton, University of California, Davis; Marshall Miller, University of California, Davis, and Miguel Jaller, University of California, Davis 

As part of its effort to reduce air pollution and cut greenhouse gas emissions that contribute to climate change, California is pursuing aggressive policies to promote clean trucks. The state already requires that by 2035, all new cars and other light-duty vehicles sold in the state must be zero emission. Its powerful Air Resources Board has adopted rules requiring that most trucks be zero emission by 2035, and is now proposing that all trucks sold by 2040 must be zero emission. The Conversation asked a panel of transportation experts from the University of California, Davis what’s involved in such a rapid transition.

1. Why is California targeting medium- and heavy-duty trucks?

Although diesel engines are valuable for moving heavy loads, they also are major polluters. Diesel trucks account for one-fourth of greenhouse gas emissions and about half of conventional air pollution from transportation in U.S. cities.

Pollutants in diesel exhaust include nitrogen oxides, fine particulates and numerous cancer-causing compounds. Since many disadvantaged communities are located near highways and industrial centers, their residents are especially affected by diesel truck pollution. Two regions in California – the Central Valley and Los Angeles-Long Beach – have some of the dirtiest air in the U.S., so the state has placed particular emphasis on cutting diesel use.

Almost all diesel fuel in the U.S. is used in trucks, not in passenger vehicles.

2. Are zero-emission trucks ready to go?

To a degree, yes. Some new models, mainly powered by batteries but some by hydrogen fuel cells, are available on the market, and more are being announced almost daily.

But the production volumes are still small, and there are many variations of truck models needed for very diverse applications, from delivering mail locally and plowing snow to hauling goods cross-country. Many of these needs cannot be met with currently offered zero-emission trucks.

Another hurdle is that new electric truck models have higher purchase prices than comparable diesel trucks. However, as the market for zero-emission trucks grows, economies of scale should bring these costs down significantly. We already see this happening with zero-emission cars and light-duty trucks.

The total cost of ownership for zero-emission trucks, which includes the purchase price, fuel costs and maintenance, is already competitive in some applications with conventional diesel trucks. One example is trucks used for local goods delivery by companies like Amazon, UPS and FedEx. This stage is also known as last-mile delivery – getting a product to a buyer’s door.

These trucks are typically driven less than 150 miles per day, so they don’t need large battery packs. Their lower energy costs and reduced maintenance needs often offset their higher purchase costs, so owners save money on them over time.

Our studies indicate that by 2025 and especially by 2030, many applications for battery trucks, and perhaps hydrogen fuel cell trucks, will have competitive or even lower total costs of ownership than comparable diesel trucks. That’s especially true because of California subsidies and incentives, such as the Hybrid and Zero-Emission Truck and Bus Voucher Incentive Project, which reduces the cost of new electric trucks and buses. And the state’s Low Carbon Fuel Standard greatly reduces the cost of low-carbon fuels and electricity for truck and bus fleets.

The market in California is already reacting to these policy signals and is developing quickly. In the past year, there has been a large increase in sales of last-mile electric delivery trucks, and companies have stepped up their pledges to procure such vehicles.

Over 150 zero-emission truck models are commercially available and eligible for state incentive funding. They range from large pickup trucks to heavy-duty tractor units for tractor-trailer combinations.

3. Is there enough charging infrastructure to support all these vehicles?

Providing near-zero-carbon electricity for EVs and hydrogen for fuel cells, and expanding charging and hydrogen refueling infrastructure, is just as important as getting zero-emission trucks on the roads.

Fleet owners will need to install chargers that can charge their battery-powered trucks overnight, or sometimes during the day. These stations may require so much power that utilities will need to install additional hardware to bring electricity from the grid to the stations to meet potentially high demands at certain times.

This video from the utility Southern California Edison shows some of the steps involved in electrifying medium- and heavy-duty vehicle fleets.

Fuel cell trucks will require hydrogen stations installed either at fleet depots or public locations. These will allow fast refueling without high instantaneous demands on the system. But producing the hydrogen will require electricity, which will put an additional burden on the electric system.

Presently there are few public or private charging or hydrogen stations for truck fleets in California. But the California Public Utility Commission has allowed utilities to charge their customers to install a significant number of stations throughout the state. And the U.S. Department of Energy recently allocated $8 billion for construction of hydrogen hubs – networks for producing, processing, storing and delivering clean hydrogen – across the country.

Despite these efforts, the rollout of charging and hydrogen infrastructure will likely slow the transition to zero-emission trucks, especially long-haul trucks.

4. Who would be affected by a diesel truck ban?

California’s rules will affect both truck manufacturers and truck users. The state’s Advanced Clean Trucks rule, adopted in 2020, requires the sale of increasing percentages of zero emission trucks starting in 2024. By 2035, 40% to 75% of all trucks, depending on the truck type, must be zero emission.

A new proposal scheduled for adoption in early 2023, the Advanced Clean Fleets rule, would require fleets with over 50 trucks to purchase an increasing number of zero-emission trucks over time, with the requirement that all truck sales and purchases be zero emission by 2040.

These two policies would work together. The Advanced Clean Trucks rule ensures that zero-emission trucks will become available to fleets, and the Advanced Clean Fleets rule would give truck manufacturers confidence that the zero-emission trucks they produce will find buyers.

These two rules are the most ambitious in the world in accelerating a transition to zero-emission trucks.

5. Are other states emulating California?

Yes, there is strong interest in many other states in electrifying trucking. Oregon, Washington, New York, New Jersey and Massachusetts have already adopted the Advanced Clean Trucks rule, and others are in the process of doing so. Seventeen states and the District of Columbia have agreed to work together to foster a self-sustaining market for medium- and heavy-duty vehicles.

We expect that transitioning to zero-emission truck fleets will require strong policy support at least until the 2030s and perhaps longer. The transition should become self-sufficient in most cases as production scales up and fleets adapt their operations, resulting in lower costs. This could be soon, especially with medium-duty trucks.

Converting large long-haul trucks will be especially challenging because they need large amounts of onboard energy storage and benefit from rapid refueling. Fuel cell systems with hydrogen may make the most sense for many of these vehicles; fleets will ultimately decide which technologies are best for them.

The transition to zero-emission trucks will be disruptive for many fleets and businesses, and will require government support during the early years of the transition. Overall, though, we believe prospects are bright for zero-emission trucking, with enormous clean air and climate benefits, and eventually, cost savings for truck owners.The Conversation

About the Author:

Daniel Sperling, Distinguished Blue Planet Prize Professor of Civil and Environmental Engineering and Founding Director, Institute of Transportation Studies, University of California, Davis; Lewis Fulton, Co-director, STEPS (Sustainable Transportation Energy Pathways), University of California, Davis; Marshall Miller, Senior Development Engineer, institute of Transportation Studies, University of California, Davis, and Miguel Jaller, Associate Professor of Civil & Environmental Engineering, University of California, Davis

This article is republished from The Conversation under a Creative Commons license. Read the original article.

Robotics-Driven Services Co. Posts 20% Revenue Gains in Q3

Source: Streetwise Reports  (10/28/22)

Shares of Oceaneering International Inc. traded 16.5% higher yesterday after the diversified offshore engineering services and manufacturing firm reported Q3/22 financial results that included a 20% YoY increase in revenue and improved operating performance and profitability across all its business units.

After U.S. markets closed Wednesday, Oceaneering International Inc. (OII:NYSE), a global provider of engineered products, services, and robotic solutions for the offshore energy, aerospace, defense, and manufacturing industries, announced financial results for the third quarter of 2022 ended September 30, 2022.

The company reported that for Q3/22, it posted total revenue of US$559.7 million, compared to US$466.8 million in Q3/21. The firm provided a breakdown of revenue by business segment and indicated that its subsea robotics unit accounted for US$169.4 million, manufactured products were US$94.0 million, offshore projects group US$153.0 million, integrity management and digital solutions US$58.5 million and aerospace and defense technologies posted US$84.8 million.

Oceaneering International advised that for Q3/22, it recorded a net income of US$18.3 million, or US$0.18 per share, versus a net loss of US$7.4 million, or a net loss of US$0.07 per share in Q3/21.

The company added that adjusted net income for Q3/22 was US$23.7 million, or US$0.23 per share, and noted that the adjustments were the result of US$1.1 million in pre-tax adjustments related to foreign exchange losses and another US$4.4 million in discretionary tax adjustments pertaining to asset valuation and tax allowances.

The company stated that during Q3/22, it generated cash flow from operations of US$85.9 million, had a free cash flow of US$66.6 million, and ended the quarter with US$428 million in cash on its balance sheet.

The firm pointed out further that during Q3/22, its fleet of 250 remotely operated vehicles (ROVs) achieved a utilization rate of 67%, and each, on average, contributed revenue of US$8,468 per day. The company added that as of September 30, 2022, its Manufactured Products division had a backlog of US$365 million.

Oceaneering International’s President and CEO Roderick A. Larson commented, “Our third-quarter results were driven by improved offshore activity and pricing, particularly in the Gulf of Mexico, which ticked up further during the quarter. We produced adjusted consolidated EBITDA of US$77.6 million, which exceeded our guidance and consensus estimates.”

“Offshore activity drove significant operating improvements in our energy businesses, which were led by our Subsea Robotics (SSR) and Offshore Projects Group (OPG) segments. In addition, increased manufacturing throughput led to improved operating margins in our Manufactured Products segment. We also saw a meaningful recovery in our government-focused businesses after experiencing the effects of negative timing during the second quarter of 2022,” Larson added.

The firm stated that it expects that revenues in Q4/22 will decline slightly or be on par with those registered in Q3/22. The company indicated that it estimates that the manufactured products group and ADTech revenues and profitability will be higher but will be offset by slightly lower revenues and operating profitability in its SSR, OPG, and IMDS segments, in part due to seasonality.

Oceaneering indicated that for FY/22, it estimates that adjusted EBITDA will be in the range of US$215-240 million.

The company advised that for FY/23, it anticipates higher levels of activity and improved performance in each of its primary business areas led by its SSR and OPG segments. The firm said that for FY/23, it expects consolidated EBITDA of US$260-310 million and free cash flow of over US$100 million.

The company indicated that going forward, it remains focused on safety, financial discipline, free cash flow generation, debt management, and growth. The firm stated that it will continue to look for opportunities to increase its prices and improve margins to benefit shareholders.

Oceaneering is a global technology firm based in Houston, Texas, that provides underwater, on land, and in space engineered services and products and robotic solutions to the offshore energy, aerospace, defense, entertainment, and manufacturing industries. The company employs more than 10,000 people and has operations in 24 countries.

The firm’s Subsea Robotics business segment offers remotely operated vehicles (ROVs) that are used to support offshore oil and gas drilling and vessel-based services such as subsea surveying, installation, construction, inspection, maintenance, and repair. The company fleet includes approximately 250 work-class ROVs. Its Manufactured Products segment manufactures distribution and connection systems, pipeline connections, and other hardware and repair systems for the energy industry.

Through its Offshore Projects Group, Oceaneering offers subsea installation, intervention, inspection, maintenance, and repair services, including ROV workover control systems and project management and engineering. The firm also provides asset integrity management, software, and analytical solutions for the bulk cargo maritime and energy industries through its Integrity Management & Digital Solutions segment. Lastly, the company’s Aerospace and Defense Technologies segment supports U.S. government agencies with engineering and related manufacturing assistance for use in defense and space exploration efforts.

Oceaneering International started yesterday with a market cap of around US$1.13 billion, with approximately 100.26 million shares outstanding and a short interest of about 4.4%. OII shares opened almost 9% higher yesterday at US$12.22 (+US$0.99, +8.82%) over the previous day’s US$11.23 closing price. The stock traded yesterday between US$12.12 and US$13.92 per share and closed for trading at US$13.08 (+US$1.88, +16.47%).

Disclosures:
1) Stephen Hytha wrote this article for Streetwise Reports LLC and provides services to Streetwise Reports as an independent contractor. He or members of his household own securities of the following companies mentioned in the article: None. He or members of his household are paid by the following companies mentioned in this article: None.

2) The following companies mentioned in this article are billboard sponsors of Streetwise Reports: None. Click here for important disclosures about sponsor fees.

3) Comments and opinions expressed are those of the specific experts and not of Streetwise Reports or its officers. The information provided above is for informational purposes only and is not a recommendation to buy or sell any security.

4) The article does not constitute investment advice. Each reader is encouraged to consult with his or her individual financial professional and any action a reader takes as a result of information presented here is his or her own responsibility. By opening this page, each reader accepts and agrees to Streetwise Reports’ terms of use and full legal disclaimer. This article is not a solicitation for investment. Streetwise Reports does not render general or specific investment advice and the information on Streetwise Reports should not be considered a recommendation to buy or sell any security. Streetwise Reports does not endorse or recommend the business, products, services or securities of any company mentioned on Streetwise Reports.

5) From time to time, Streetwise Reports LLC and its directors, officers, employees or members of their families, as well as persons interviewed for articles and interviews on the site, may have a long or short position in securities mentioned. Directors, officers, employees or members of their immediate families are prohibited from making purchases and/or sales of those securities in the open market or otherwise from the time of the decision to publish an article until three business days after the publication of the article. The foregoing prohibition does not apply to articles that in substance only restate previously published company releases.

Expert Says Buy Pharma Co. Stock ‘as Soon as Possible’

Source: Clive Maund  (10/25/22)

Algernon Pharmaceuticals has entered into a clinical trial agreement with Yale and caught expert Clive Maund’s attention. In light of this, Maund reviews the company’s chart to tell you when he believes you should buy its stock.

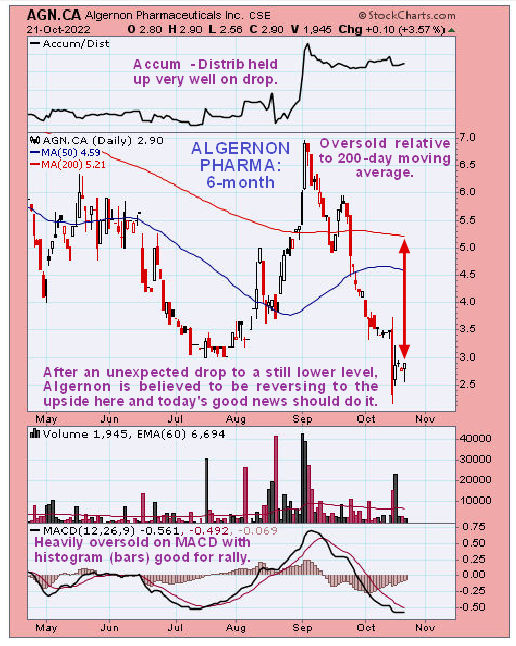
Algernon Pharmaceuticals Inc. (AGN:CSE; AGNPF:OTCQB; AGN0:XFRA) got sold down further than we expected, making an unexpected further drop last week that took it down close to a trendline connecting a series of lows.

However, it now looks set to reverse to the upside, especially as this morning it came out with the news that it has entered into a clinical trial agreement with Yale University for a DMT Phase 2 Depression Study.

The fact that it has only 2 million shares in issue improves its potential for rapid recovery.

Anyone holding should therefore stay long, and it is rated a Buy again here. Those interested should aim to buy it as soon as possible after the open this morning.

Algernon Pharmaceuticals’s website.

Algernon Pharmaceuticals Inc. closed at CA$2.90, $2.09 on October 21, 2022.

CliveMaund.com Disclosures

The above represents the opinion and analysis of Mr. Maund, based on data available to him, at the time of writing. Mr. Maund’s opinions are his own, and are not a recommendation or an offer to buy or sell securities. Mr. Maund is an independent analyst who receives no compensation of any kind from any groups, individuals or corporations mentioned in his reports. As trading and investing in any financial markets may involve serious risk of loss, Mr. Maund recommends that you consult with a qualified investment advisor, one licensed by appropriate regulatory agencies in your legal jurisdiction and do your own due diligence and research when making any kind of a transaction with financial ramifications. Although a qualified and experienced stock market analyst, Clive Maund is not a Registered Securities Advisor. Therefore Mr. Maund’s opinions on the market and stocks can only be construed as a solicitation to buy and sell securities when they are subject to the prior approval and endorsement of a Registered Securities Advisor operating in accordance with the appropriate regulations in your area of jurisdiction.

Disclosures:
1) Clive Maund: I, or members of my immediate household or family, own securities of the following companies mentioned in this article: None. I personally am, or members of my immediate household or family are, paid by the following companies mentioned in this article: None.

2) The following companies mentioned in this article are billboard sponsors of Streetwise Reports: Algernon Pharmaceuticals Inc. Click here for important disclosures about sponsor fees. As of the date of this article, an affiliate of Streetwise Reports has a consulting relationship with Algernon Pharmaceuticals Inc. Please click here for more information.

3) Statements and opinions expressed are the opinions of the author and not of Streetwise Reports or its officers. The author is wholly responsible for the validity of the statements. The author was not paid by Streetwise Reports for this article. Streetwise Reports was not paid by the author to publish or syndicate this article. Streetwise Reports requires contributing authors to disclose any shareholdings in, or economic relationships with, companies that they write about. Streetwise Reports relies upon the authors to accurately provide this information and Streetwise Reports has no means of verifying its accuracy.

4) This article does not constitute investment advice. Each reader is encouraged to consult with his or her individual financial professional and any action a reader takes as a result of information presented here is his or her own responsibility. By opening this page, each reader accepts and agrees to Streetwise Reports’ terms of use and full legal disclaimer. This article is not a solicitation for investment. Streetwise Reports does not render general or specific investment advice and the information on Streetwise Reports should not be considered a recommendation to buy or sell any security. Streetwise Reports does not endorse or recommend the business, products, services or securities of any company mentioned on Streetwise Reports.

5) From time to time, Streetwise Reports LLC and its directors, officers, employees or members of their families, as well as persons interviewed for articles and interviews on the site, may have a long or short position in securities mentioned. Directors, officers, employees or members of their immediate families are prohibited from making purchases and/or sales of those securities in the open market or otherwise from the time of the decision to publish an article until three business days after the publication of the article. The foregoing prohibition does not apply to articles that in substance only restate previously published company releases. As of the date of this article, officers and/or employees of Streetwise Reports LLC (including members of their household) own securities of Algernon Pharmaceuticals Inc., a company mentioned in this article.

6) This article does not constitute medical advice. Officers, employees and contributors to Streetwise Reports are not licensed medical professionals. Readers should always contact their healthcare professionals for medical advice.

Six Resource Companies You Should Pay Attention To

Source: Adrian Day  (10/24/22) 

Several resource companies on expert Adrian Day’s list have reported their production numbers for the third quarter, with some positive surprises, though costs are rising.

Barrick Gold Corp. (ABX:TSX; GOLD:NYSE) reported production of just under one million ounces, down 54,000 ounces from the year-ago quarter and below estimates, while costs have risen. Copper production, however, was stronger than forecast. The company believes it will have a strong fourth quarter so that annual production will be within guidance, at the lower end for gold but mid-range for copper.

While production was down, costs rose. Cash costs for gold rose 3-5% last quarter to US$889/oz, partly reflecting the lower production during the quarter. All-in-sustaining costs, estimated at US$1,248, are also up 3-5% on the quarter, 20% from a year ago.

The production shortfall is largely attributable to the Nevada Gold Mines, where anticipated higher grades did not materialize, though are expected this quarter. Pueblo Viejo in the Dominican Republic partly offset the lower Nevada output.

With dynamic management and world-class assets around the globe, Barrick, trading at low valuation multiples, is a Buy.

Osisko Has Another Record, With Growth Ahead

Osisko Gold Royalties Ltd. (OR:TSX; OR:NYSE) reported another record quarter with deliveries, revenues, and cash margin all at new highs. Production was up 7% quarter-on-quarter, and the company expects this trend to continue into the final quarter of the year, putting it on track to meet its annual guidance, albeit at the low end of the range.

One negative was that the Eagle mine, operated by Victoria Gold, still in ramp-up, had problems with a conveyer, with operations down for two to three weeks. The company bought back 1.3 million shares at a total cost of CA$16.5 million during the quarter.

With conservative management and a built-in pipeline of growth, Osisko is a Buy.

Royal on Track To Meet Guidance

Royal Gold Inc. (RGLD:NASDAQ; RGL:TSX) announced it has sold just 56,000 oz of gold equivalent ounces (GEOs) during the quarter, identical to the previous quarter, though below analyst estimates.

The company had 31,000 ounces in inventory at the quarter end, mostly gold but also silver and copper. The company in on track to achieve the upper end of its annual production guidance.

With quality assets, Royal Gold is a Buy.

Another Strong Quarter for Altius

Altius Minerals Corp. (ALS:TSX.V) reported strong quarterly revenue, though slightly down from Q2, which was a record for the company. For the year-to-date, revenue is up 30% on the comparable period in 2021. The outperformance was attributable to higher thermal coal revenue and strong if expected, revenues from potash.

Once again, the results demonstrate the benefits of a diversified portfolio, as some commodities perform better than others.

During the quarter, Altius purchased additional shares in Labrador Iron Ore Royalty, and it remains active on its buy-back program. Separately, the Supreme Court of Canada ruled in an unrelated case on what constitutes a taking by regulatory action.

This has positive implications for Altius’ ongoing case against Alberta for its action against coal mines on which the company holds royalties.

Although Altius is a core holding for us, given that the volatile stock is at the top of the recent range, we will hold and look for pullbacks to add.

Key Drilling Ahead for Lara

Lara Exploration Ltd. (LRA:TSX.V) has resumed drilling at its Planalto Project in Brazil after receipt of a new permit to extend drilling northwards from the new Cupuzeiro discovery at the project. Additional critical drilling to test the gap between Cupuzeira and the original Homestead deposit is planned once a separate permit is received for that.

Capstone Copper can earn up to 70% in the project on certain conditions.

At this price, Lara is a very strong Buy.

New Targets for Midland

Midland Exploration Inc. (MD:TSX.V) said it had discovered several new mineralized areas of high-grade copper and gold in its strategic alliance with SOQUEM in the Labrador Trough in Quebec. The company will evaluate the results and looks to advance exploration, possibly with drilling next year.

With strong management, a solid balance sheet, and multiple active projects, Midland is a Buy.

BEST BUYS this week include, in addition to the above, Wheaton Precious Metals Corp. (WPM:TSX; WPM:NYSE); Gladstone Investment Corp. (GAIN: NASDAQ); Nestle SA (NESN:VX; NSRGY:OTC); Hutchison Port Holdings Trust (HPHT:Singapore)); Ares Capital Corp. (ARCC:NASDAQ); and Pan American Silver Corp. (PAAS:TSX; PAAS:NASDAQ).


Adrian Day Disclosures:

Adrian Day’s Global Analyst is distributed for $990 per year by Investment Consultants International, Ltd., P.O. Box 6644, Annapolis, MD 21401. (410) 224-8885. www.AdrianDayGlobalAnalyst.com. Publisher: Adrian Day. Owner: Investment Consultants International, Ltd. Staff may have positions in securities discussed herein. Adrian Day is also President of Global Strategic Management (GSM), a registered investment advisor, and a separate company from this service. In his capacity as GSM president, Adrian Day may be buying or selling for clients securities recommended herein concurrently, before or after recommendations herein, and may be acting for clients in a manner contrary to recommendations herein. This is not a solicitation for GSM. Views herein are the editor’s opinion and not fact. All information is believed to be correct, but its accuracy cannot be guaranteed. The owner and editor are not responsible for errors and omissions. © 2022. Adrian Day’s Global Analyst. Information and advice herein are intended purely for the subscriber’s own account. Under no circumstances may any part of a Global Analyst e-mail be copied or distributed without prior written permission of the editor. Given the nature of this service, we will pursue any violations aggressively.

Disclosures:

1) Adrian Day: I, or members of my immediate household or family, own securities of the following companies mentioned in this article: All. I personally am, or members of my immediate household or family are, paid by the following companies mentioned in this article: None. My company has a financial relationship with the following companies mentioned in this article: None. Funds controlled by Adrian Day Asset Management, which is unaffiliated with Adrian Day’s newsletter, hold shares of the following companies mentioned in this article: All. I determined which companies would be included in this article based on my research and understanding of the sector.

2) The following companies mentioned in this article are billboard sponsors of Streetwise Reports: None. Click here for important disclosures about sponsor fees. The information provided above is for informational purposes only and is not a recommendation to buy or sell any security.

3) Statements and opinions expressed are the opinions of the author and not of Streetwise Reports or its officers. The author is wholly responsible for the validity of the statements. The author was not paid by Streetwise Reports for this article. Streetwise Reports was not paid by the author to publish or syndicate this article. Streetwise Reports requires contributing authors to disclose any shareholdings in, or economic relationships with, companies that they write about. Streetwise Reports relies upon the authors to accurately provide this information and Streetwise Reports has no means of verifying its accuracy.

4) This article does not constitute investment advice. Each reader is encouraged to consult with his or her individual financial professional and any action a reader takes as a result of information presented here is his or her own responsibility. By opening this page, each reader accepts and agrees to Streetwise Reports’ terms of use and full legal disclaimer. This article is not a solicitation for investment. Streetwise Reports does not render general or specific investment advice and the information on Streetwise Reports should not be considered a recommendation to buy or sell any security. Streetwise Reports does not endorse or recommend the business, products, services, or securities of any company mentioned on Streetwise Reports.

5) From time to time, Streetwise Reports LLC and its directors, officers, employees, or members of their families, as well as persons interviewed for articles and interviews on the site, may have a long or short position in the securities mentioned. Directors, officers, employees, or members of their immediate families are prohibited from making purchases and/or sales of those securities in the open market or otherwise from the time of the decision to publish an article until three business days after the publication of the article. The foregoing prohibition does not apply to articles that in substance only restate previously published company release. As of the date of this article, officers and/or employees of Streetwise Reports LLC (including members of their household) own securities of  Wheaton Precious Metals Corp. and Pan American Silver Corp., companies mentioned in this article.

Yes, Elliott Waves Work with Individual Stocks — Here’s How

“The primary value of the Wave Principle is that it provides a context for market analysis”

By Elliott Wave International

Elliott waves reflect the repetitive patterns of mass psychology — so they are ideally suited for analyzing the widely traded main stock indexes.

On the other hand, thinly traded individual stocks may not trace out Elliott wave price patterns nearly as well.

That said, there are many individual stocks which are widely traded — like most of the big and well-known companies (and others which have captured the interest of investors).

Consider the stock of the largest bank in the U.S. Back in March, our Global Market Perspective showed this chart and said:

This chart shows the five-wave pattern of JPMorgan Chase’s rise from March 2009 to September 2021.

Of course, the completion of a five-wave up pattern means a downtrend is next. When that analysis published, the share price was $134.40. As of this intraday writing on Oct.3, it’s $106.79.

Let’s go back in time to review another example of how Elliott wave analysis can be applied to an individual stock.

This case-in-point involves GE. The September Elliott Wave Theorist was discussing wave analysis with individual stocks and showed these side-by-side charts and said:

The October 27, 2000 [Global Market Perspective] published the chart on the left, showing a completed Elliott wave in GE stock. This quarter-century pattern portended a major reversal. The chart on the right shows what happened thereafter.

Not every forecast based on the Elliott wave model works out perfectly. At the same time, keep in mind these words from Frost & Prechter’s Wall Street classic, Elliott Wave Principle: Key to Market Behavior:

The primary value of the Wave Principle is that it provides a context for market analysis. This context provides both a basis for disciplined thinking and a perspective on the market’s general position and outlook. At times, its accuracy in identifying, and even anticipating changes in direction is almost unbelievable.

If you’d like to read the entire online version of the book for free, you may do so once you become a member of Club EWI, the world’s largest Elliott wave educational community (approximately 500,000 worldwide members).

A Club EWI membership also opens the door to free access to a wealth of other Elliott wave resources — such as videos and articles from Elliott Wave International’s analysts.

Jump on the Club EWI bandwagon now by following this link: Elliott Wave Principle: Key to Market Behaviorget free and instant access.

Measuring the ‘Halloween effect’ – can retail investor optimism really affect stock returns?

By Moritz Wagner, University of Canterbury 

The upcoming spooky season is not only a favourite time for most kids (and a few adults), but also for share markets due to what’s been called the “Halloween effect” – often referred to as “sell in May and go away”.

There is hardly a year investors and the media do not refer to the popular market wisdom suggesting higher stock returns in the months November through to April, compared with May through to October (that is, in the northern hemisphere’s winter and summer, but it also applies to southern hemisphere countries where the seasons are offset by six months).

With investors looking for a crystal ball to help with investing, predictable patterns can offer a guide for when to invest and when to sell. But has this pattern survived the financial volatility of the past two decades?

New research shows this seasonal investment pattern is still alive and well in most stock markets around the world and, if anything, has become more pronounced in recent years.

Both the Halloween and January effect – the observation that stock prices of mainly smaller firms tend to increase in January more than in other months – are pervasive. These patterns seemingly provide guidance for the two most fundamental decisions when making an investment: what assets to buy or sell, and when.

Of course, such anomalies appear to be inconsistent with the common hypothesis that markets are efficient and that prices change randomly.

Finally answering the ‘why’

A recent analysis using stock returns and mutual fund flows in the United States provides a simple answer to the nagging question of why these anomalies exist and why they have worked for so long. Previous explanations have largely been inconclusive.

Aggregate fund flows (the bars depicting money invested or withdrawn by investors) exhibit a similar calendar-based pattern as market returns (the lines). The returns are substantially higher during winter months than during summer months.

Remarkably, in years where this is not the case – when summer flow is higher than winter flow – the winter excess returns are also negative.

Markets influenced by optimism or pessimism

When examined jointly, high average stock returns in winter months (Halloween effect) and in January (January effect) can be attributed to a large average influx of funds. After accounting for the effect of these increased fund flows, there are no seasonal factors affecting market returns anymore.

The study builds on earlier findings, providing strong evidence of the price-pressure effects from funds that expand their portfolios when they receive money from investors (cash inflow) and sell their shares when investors withdraw money (cash outflow).

In other words, large cash inflow induces fund managers to invest the excess cash, driving up the demand for stocks. When funds experience outflow, they liquidate investment positions, increasing the supply of stocks.

Such trading across funds can affect returns by temporarily driving stock prices away from their fundamental value. Interestingly, only flows to retail funds catering to individual investors, as opposed to institutional funds catering to high-net-worth or institutional investors, are seasonal.

The effect also appears to be short-lived and reverses within a few months and highlights the behavioural nature of the patterns observed in the market.

Overall, the interrelation between seasonal flows and stock returns originates from the buying and selling activities of perhaps overly optimistic or pessimistic individual retail investors.

Time to get into investing?

Some readers might ask whether it is still a good idea to buy stocks in the coming Halloween season, as the recent downturn in markets may appear like a good entry point.

However, the troublesome mix of record high inflation, rising interest rates and Russia’s war in Ukraine may ultimately result in a recession.

If retail investors then stay away from the market, seasonal patterns are less likely to materialise this time around. But there is no crystal ball to predict what is going to happen.

The best advice is to keep emotions out of investment decisions and focus on a broader strategy – look for long-term opportunities in the market rather than trying to time it.The Conversation

About the Author:

Moritz Wagner, Lecturer, University of Canterbury

This article is republished from The Conversation under a Creative Commons license. Read the original article.