Archive for Forex and Currency News – Page 355

The Analytical Overview of the Main Currency Pairs on 2020.10.06

by JustForex

The EUR/USD currency pair

Technical indicators of the currency pair:
  • Prev Open: 1.17110
  • Open: 1.17816
  • % chg. over the last day: +0.52
  • Day’s range: 1.17745 – 1.18002
  • 52 wk range: 1.0637 – 1.2012

During yesterday’s trading session, the greenback weakened against its main competitors. EUR/USD quotes have reached the round level of 1.1800. The 1.1765 mark is already a “mirror” support. The demand for the US currency has weakened amid worries about Donald Trump’s health and the US elections. Investors continue to monitor the progress of negotiations in the US Congress on a new stimulus package. The trading instrument has the potential for further growth. We recommend opening positions from key levels.

The news feed on 2020.10.06:
  • – JOLTS job openings at 17:00 (GMT+3:00).

We also recommend paying attention to the speeches by the presidents of the ECB and the Fed.

EUR/USD

Indicators signal the power of buyers: the price has fixed above 50 MA and 100 MA.

The MACD histogram is in the positive zone, but below the signal line, which gives a weak signal to buy EUR/USD.

Stochastic Oscillator is in the neutral zone, the %K line has crossed the %D line. There are no signals at the moment.

Trading recommendations
  • Support levels: 1.1765, 1.1740, 1.1700
  • Resistance levels: 1.1800, 1.1850

If the price fixes above 1.1800, further growth in EUR/USD quotes is expected. The movement is tending to 1.1840-1.1860.

An alternative could be a decline in the EUR/USD currency pair to 1.1740-1.1710.

The GBP/USD currency pair

Technical indicators of the currency pair:
  • Prev Open: 1.29321
  • Open: 1.29728
  • % chg. over the last day: +0.37
  • Day’s range: 1.29627 – 1.30070
  • 52 wk range: 1.1409 – 1.3516

GBP/USD quotes show a positive trend. The British pound has updated its two-week highs. The trading instrument found resistance near the round level of 1.3000. The 1.2950 mark is already a “mirror” support. The demand for greenback is still quite low. The GBP/USD currency pair has the potential for further growth. Positions should be opened from key levels.

At 11:30 (GMT+3:00), the UK construction PMI will be published.

GBP/USD

Indicators signal the power of buyers: the price has fixed above 50 MA and 100 MA.

The MACD histogram is in the positive zone, but below the signal line, which gives a weak signal to buy GBP/USD.

Stochastic Oscillator is in the neutral zone, the %K line is below the %D line, which indicates the bearish sentiment.

Trading recommendations
  • Support levels: 1.2950, 1.2900, 1.2830
  • Resistance levels: 1.3000, 1.3050

If the price fixes above 1.3000, further growth of the GBP/USD currency pair is expected. The movement is tending to 1.3040-1.3060.

An alternative could be a drop in GBP/USD quotes to the round level of 1.2900.

The USD/CAD currency pair

Technical indicators of the currency pair:
  • Prev Open: 1.32982
  • Open: 1.32587
  • % chg. over the last day: -0.21
  • Day’s range: 1.32419 – 1.32733
  • 52 wk range: 1.2949 – 1.4669

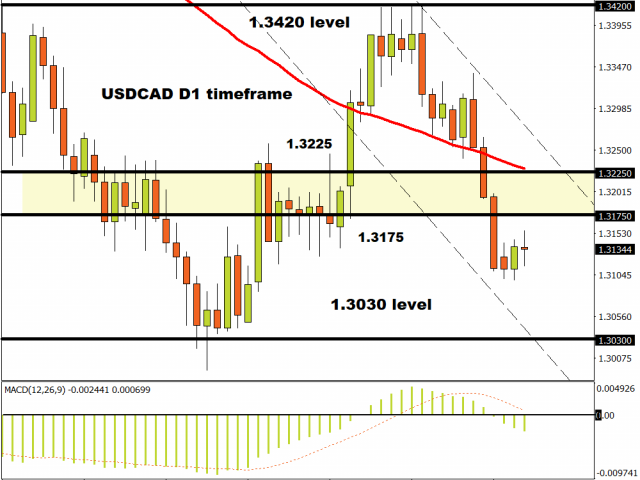
The bearish sentiment prevails on the USD/CAD currency pair. USD/CAD quotes have updated local lows again. At the moment, the loonie is consolidating in the range of 1.3245-1.3280. The demand for the US dollar is still quite low. The trading instrument has the potential for further decline. We recommend paying attention to the dynamics of oil prices. Positions should be opened from key levels.

The news feed on Canada’s economy is calm.

USD/CAD

Indicators signal the power of sellers: the price has fixed below 50 MA and 100 MA.

The MACD histogram is in the negative zone, but above the signal line, which gives a weak signal to sell USD/CAD.

Stochastic Oscillator is near the overbought zone, the %K line has crossed the %D line. There are no signals at the moment.

Trading recommendations
  • Support levels: 1.3245, 1.3200
  • Resistance levels: 1.3280, 1.3300, 1.3330

If the price fixes below 1.3245, a further fall in USD/CAD quotes is expected. The movement is tending to the round level of 1.3200.

An alternative could be the growth of the USD/CAD currency pair to 1.3300-1.3330.

The USD/JPY currency pair

Technical indicators of the currency pair:
  • Prev Open: 105.276
  • Open: 105.714
  • % chg. over the last day: +0.19
  • Day’s range: 105.546 – 105.783
  • 52 wk range: 101.19 – 112.41

The USD/JPY currency pair has stabilized near two-week highs. At the moment, the technical pattern is ambiguous. Investors expect additional drivers. The key support and resistance levels are 105.50 and 105.80, respectively. USD/JPY quotes are tending to decline. We recommend paying attention to the dynamics of US government bonds yield. Positions should be opened from key levels.

The news feed on Japan’s economy is quite calm.

USD/JPY

Indicators do not give accurate signals: 50 MA has crossed 100 MA.

The MACD histogram is in the positive zone, but below the signal line, which gives a weak signal to buy USD/JPY.

Stochastic Oscillator is in the neutral zone, the %K line has crossed the %D line. There are no signals at the moment.

Trading recommendations
  • Support levels: 105.50, 105.40, 105.25
  • Resistance levels: 105.80, 106.00

If the price fixes below 105.50, USD/JPY quotes are expected to fall. The movement is tending to 105.25-105.00.

An alternative could be the growth of the USD/JPY currency pair to 106.00-106.20.

by JustForex


This article reflects a personal opinion and should not be interpreted as an investment advice, and/or offer, and/or a persistent request for carrying out financial transactions, and/or a guarantee, and/or a forecast of future events.

The US Currency Is Declining

by JustForex

The US dollar is declining against a basket of currency majors. Yesterday, the US dollar index (#DX) updated local lows and closed in the red zone (-0.39%). US President Donald Trump drew new criticism on Tuesday after returning from the hospital after four days of treatment for COVID-19. At the same time, he urged people not to be afraid of the disease. Trump arrived at the White House and defiantly removed his surgical mask on-camera. “I learned a lot about COVID. Don’t let it dominate you. Don’t be afraid of it. You’re going to beat it. We have the best medical equipment. We have the best medicines, all developed recently,” said the US President.

The British pound is growing after British Prime Minister Boris Johnson and President of the European Commission Ursula von der Leyen agreed to reopen talks on a post-Brexit deal. The British pound is also supported by optimistic economic data. Thus, the composite PMI index counted to 56.5 in September, while experts expected 55.7. Services PMI counted to 56.1 and turned out to be better than the forecasted of 55.1.

Today, during the Asian trading session, the Reserve Bank of Australia has kept its interest rate unchanged. As expected, the regulator left the indicator at 0.25% per annum.

The “black gold” prices are consolidating. At the moment, futures for the WTI crude oil are testing the $39.30 mark per barrel. At 23:30 (GMT+3:00), API weekly crude oil stock will be published.

Market indicators

Yesterday, there was the bullish sentiment in the US stock market: #SPY (+1.77%), #DIA (+1.70%), #QQQ (+2.13%).

The 10-year US government bonds yield has started rising. The indicator has reached 0.76-0.77%.

The news feed for 2020.10.06:
  • – UK construction PMI at 11:30 (GMT+3:00);
  • – EIA short-term energy outlook at 15:00 (GMT+3:00);
  • – JOLTS job openings at 17:00 (GMT+3:00).

We also recommend paying attention to the speeches by the presidents of the ECB and the Fed.

by JustForex


This article reflects a personal opinion and should not be interpreted as an investment advice, and/or offer, and/or a persistent request for carrying out financial transactions, and/or a guarantee, and/or a forecast of future events.

Dollar weakened by hopes of more US fiscal stimulus

By Han Tan, Market Analyst, ForexTime

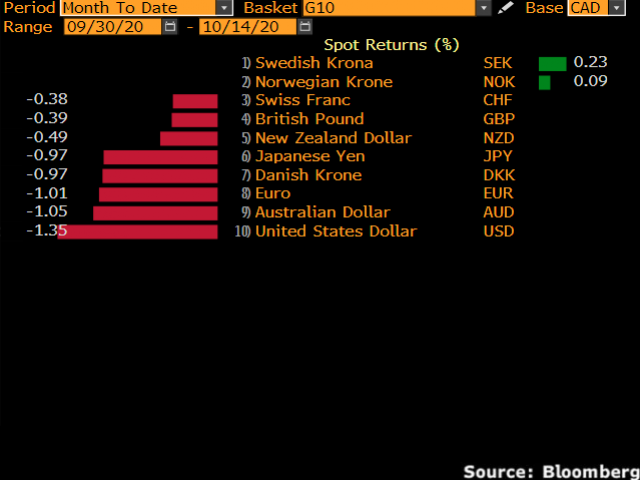
The US Dollar is now weaker against all of its G10 peers, as well as against most Asian currencies, as the Dollar index (DXY) test to see whether the 93.5 mark can successfully transform from resistance level, as was the case in August and September, to now a reliable support level.

The Greenback has been weakened of late by rising hopes over the next round of US fiscal stimulus, with House Speaker Nancy Pelosi and Treasury Secretary Steven Mnuchin still engaged in negotiations via phone. Still, there remains a gulf of some US$ 600 billion dollars that needs to be bridged between the two competing proposals on how best to send financial aid out into the world’s largest economy.

Nevertheless, as long as both sides are holding talks, it signals that investors can expect more fiscal support for the US economy. Such prospects bode well for risk-on sentiment, while more fiscal stimulus could also juice up US inflationary expectations. That in turn may erode the Dollar’s purchasing power, chipping away at the currency’s appeal to global investors while lending an easing bias for the US Dollar.

Investors are also looking ahead to speeches by Fed Chair Jerome Powell and ECB Chief Economist Philip Lane, who will deliver keynote addresses at the NABE conference today. Should either of them provide more clues on either the Fed or the European Central Bank’s monetary policy response to the global pandemic, that could also prompt moves in EURUSD and the Dollar index, with the Euro accounting for 57.6 percent of the DXY. EURUSD has been able to bounce off the 1.161 level in late-September, and is now set to test its 50-day simple moving average (MA) as a resistance level.

Meanwhile, the Nasdaq 100 minis have slipped into losses at the time of writing, after Monday’s late rally that was driven by news that US President Donald Trump is out of the hospital and has returned to the White House. While the President’s move does allay some of the worst fears surrounding his health for the time being, the road ahead for global markets still features major downside risks, especially considering the threat of a delayed outcome to the November elections. For the Nasdaq in particular, market participants will be eyeing developments surrounding US lawmakers’ proposal for sweeping reforms to US tech giants such as Amazon, Alphabet’s Google, and Apple.

From a technical perspective, the Nasdaq 100 minis have had a tough time breaking meaningfully above 11,600, even as its 50-day simple moving average (MA) continues to guide prices higher. A sudden burst of risk-on sentiment could see it closing the gap with its record high of 12,466.1. However, the likelier scenario is for this asset to adhere to a sideways trend, until major event risks have passed and investors can get more clarity on the next major move for US tech stocks. The FXTM Trader’s Sentiment on the ND100m remains net long.


Disclaimer: The content in this article comprises personal opinions and should not be construed as containing personal and/or other investment advice and/or an offer of and/or solicitation for any transactions in financial instruments and/or a guarantee and/or prediction of future performance. ForexTime (FXTM), its affiliates, agents, directors, officers or employees do not guarantee the accuracy, validity, timeliness or completeness, of any information or data made available and assume no liability as to any loss arising from any investment based on the same.


Forex-Time-LogoArticle by ForexTime

ForexTime Ltd (FXTM) is an award winning international online forex broker regulated by CySEC 185/12 www.forextime.com

Dollar net short bets declined despite mixed reports

By IFCMarkets.com

US dollar bearish bets decrease resumed with total net shorts falling to $30.47 billion from $33.60 billion against the major currencies during the one week period, according to the report of the Commodity Futures Trading Commission (CFTC) covering data up to September 29 and released on Friday October 2. The decrease in net short dollar bets was the result of mainly British Pound net long bets turning into net shorts, as well as decline in bullish bets on Australian dollar, yen and euro as Markit flash eurozone services PMI dropped to 47.6 from 51.9 in September while manufacturing purchasing managers index’s rose to 53.7 from 51.7. Dollar bearish bets declined despite the Labor Department report above expected 870 thousand Americans filed for first-time jobless benefits and Federal Reserve Fed chair Powell told interest rates would remain low until at least 2024 and “there is a long way to go” for recovery from the economic downturn. At the same time Census Bureau reported orders for durable goods rose 0.4% on month in August, the fourth straight gain, when 1.1% increase was expected. And Markit’s composite purchasing managers index flash reading declined to 54.4 in September from 54.6 in the prior month, signaling a slower pace of growth.

CFTC Sentiment vs Exchange Rate

September 29 2020BiasEx RateTrendPosition $ mlnWeekly Change
CADbearishpositive-14154
AUDbullishpositive637-534
EURbullishpositive27606-316
GBPbullishpositive-1024-1260
CHFbullishpositive1731-433
JPYbullishnuetral2933-591
Total30467

commitment of traders net long short


commitment of traders weekly change


market sentiment ratio long short positions


New Exclusive Analytical Tool

Any date range – from 1 day to 1 year

Any Trading Group – Forex, Stocks, Indices, etc.

Note: This overview has an informative and tutorial character and is published for free. All the data, included in the overview, are received from public sources, recognized as more or less reliable. Moreover, there is no guarantee that the indicated information is full and precise. Overviews are not updated. The whole information in each overview, including opinion, indicators, charts and anything else, is provided only for familiarization purposes and is not financial advice or а recommendation. The whole text and its any part, as well as the charts cannot be considered as an offer to make a deal with any asset. IFC Markets and its employees under any circumstances are not liable for any action taken by someone else during or after reading the overview.

Market Analysis provided by IFCMarkets.com

Technical outlook: DXY under pressure below 94.00

By Lukman Otunuga, Research Analyst, ForexTime

A wave of optimism swept through equity markets on Monday following reports that US President Donald Trump’s health was improving after testing positive for COVID-19.


Such encouraging news has injected investors with a fresh dosage of confidence, consequently renewing appetite for risk at the expense of safe-haven currencies like the Dollar and Japanese Yen.


Our currency spotlight this week will be the Greenback which was practically bullied by G10 majors last quarter.


However, the Dollar’s initial performance over the past few weeks suggested that bulls were gearing for a return. Risk aversion triggered by rising coronavirus cases across the globe, political uncertainty ahead of November’s presidential elections and concerns over the global economy sent investors rushing towards the world’s most liquid currency in September.


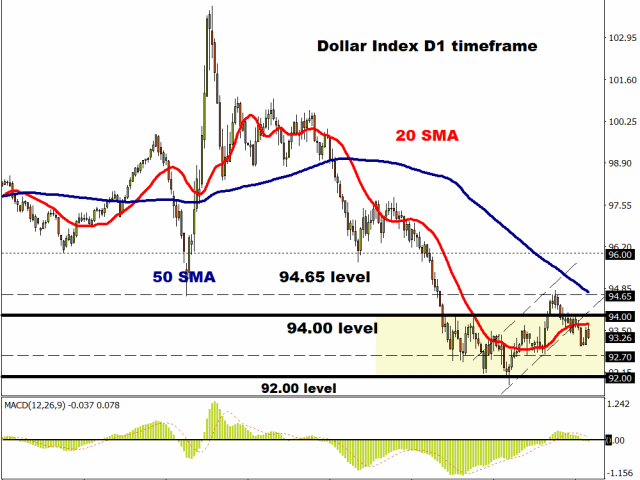
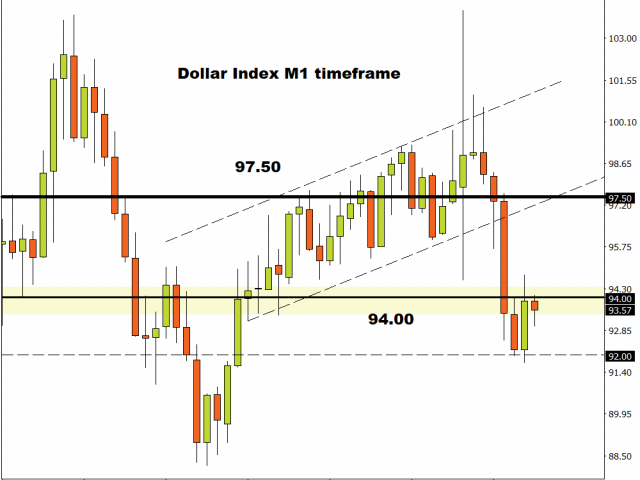
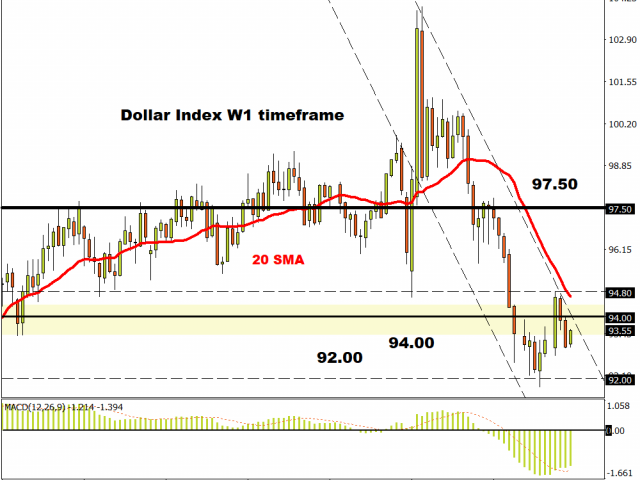
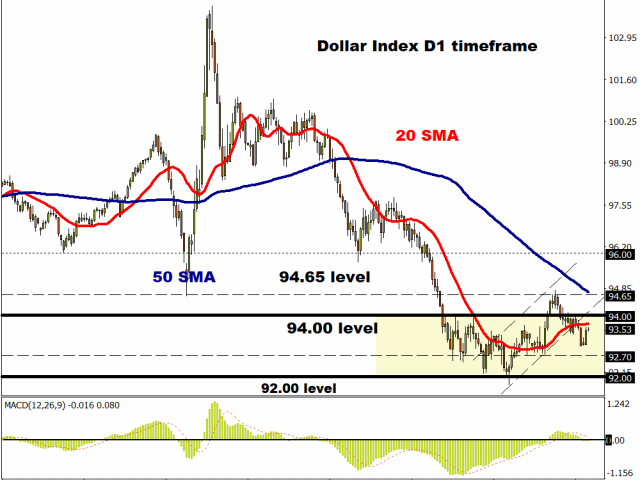
Focusing on today, Dollar bulls are nowhere to be found on the daily charts with the DXY trading around 93.50 as of speaking. There seems to be resistance around the 94.00 level while prices have cut below the 20 Simple Moving Average. Sustained weakness below 94.00 could trigger a decline towards 92.70 and 90.00, respectively.


Zooming out to the weekly charts, the next key level of interest can be found around 90.00. This level could be challenged if 92.00 proves to be unreliable support. However, if prices are able to secure a weekly close above 94.00, then bulls could test 94.65 and 96.00, respectively.


All in all, where the Dollar Index concludes this week will not only be influenced by developments revolving around Trump but key economic data in the form of PMI’s, FOMC minutes, speeches from Fed officials and overall sentiment.

Although the Dollar Index is under pressure below 94.00, King Dollar could still make a return in Q4 if risk aversion remains a dominant theme across markets.

Disclaimer: The content in this article comprises personal opinions and should not be construed as containing personal and/or other investment advice and/or an offer of and/or solicitation for any transactions in financial instruments and/or a guarantee and/or prediction of future performance. ForexTime (FXTM), its affiliates, agents, directors, officers or employees do not guarantee the accuracy, validity, timeliness or completeness, of any information or data made available and assume no liability as to any loss arising from any investment based on the same.


Forex-Time-LogoArticle by ForexTime

ForexTime Ltd (FXTM) is an award winning international online forex broker regulated by CySEC 185/12 www.forextime.com

The Week Ahead: Serious Talk

By Orbex

EURGBP Retreats on Signs of Brexit Progress

The pound sterling could be the mover and shaker after Brexit headlines kicked off volatility at the end of last week. EU officials have confirmed that both sides are in talks of ‘next steps’, a sign of progress that has put investors in a cautiously optimistic mood.

One is seldom accustomed to a smooth ride when it comes to trading the Brexit-sensitive pound. Volatility is likely to remain high considering the fact that London has yet to drop the contentious internal market bill.

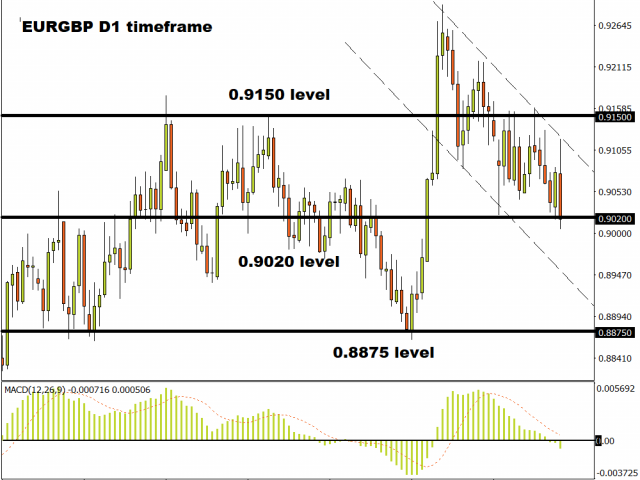
Positive news could push the euro below 0.9 and towards 0.8880. The lack of it, however, would mean that the pair could rise back to challenge 0.9210.

USDCHF Struggles After Lackluster Jobs Data

The US dollar has started a timid rebound from February 2015’s low as investors took some bets off riskier assets.

Uncertainty around the upcoming fiscal stimulus has given the greenback some respite. Whether it will be $1.6 or $2.2 trillion as proposed by Democrats and Republicans respectively, the major concern is if the check could be written before the election. Friday’s job numbers fell short of expectations and that may instill a sense of urgency among policymakers.

The pair’s rally would be sustainable as long as it stays above 0.9050. Further up, strong selling interests could be lying around 0.9450.

AUDJPY Halts Advance on Potential Rate Cut

Investors buying dips have helped the Australian dollar bounce back from its three month low. Global sentiment has turned upbeat with rallies across equity markets and encouraging Chinese data suggests strength in the economic recovery. All these would be supportive of the risk-sensitive Aussie.

However, the currency might struggle going into Tuesday’s RBA meeting, a major risk event as markets anticipate an interest rate cut. Should the central bank postpone the easing until November, the Aussie could see more buying interests.

77.70 is a key hurdle on the upside while 74.00 is the immediate support level.

CADCHF in Consolidation as Oil Goes Sideways

Uptick in investor sentiment has yet benefited the Canadian dollar which is stuck in its recent trading range. With oil prices moving sideways, the commodity-related loonie is looking for a strong enough catalyst to commit to a direction. Friday’s jobs data may tilt the balance. A crippled labor market may thwart the pair’s latest rebound.

A positive reading, however, could push the loonie to challenge the psychological level of 0.7000. In the meantime, traders are bound to range-trading opportunities within a 7-month-long consolidation area between 0.66 and 0.72.

By Orbex

Fibonacci Retracements Analysis 05.10.2020 (GOLD, USDCHF)

Article By RoboForex.com

XAUUSD, “Gold vs US Dollar”

As we can see in the H4 chart, XAUUSD is correcting to the upside after finishing the descending wave and has already reached 23.6% fibo but may be over quite soon. Later, the market may resume falling towards 38.2% and 50.0% fibo at 1836.50 and 1736.30 respectively. The resistance remains at the high at 2074.75 but it may relocate to 1927.40 after the asset reaches 38.2% fibo at 1836.50.

GOLD_H4
Risk Warning: the result of previous trading operations do not guarantee the same results in the future

The H1 chart shows a new descending wave after the local divergence, which has already reached 38.2% fibo. However, if XAUUSD rebounds from this level and then breaks the high at 1917.00, it may reach 61.8% fibo at 1926.00. Still, if the pair fails to rebounds, it may continue falling towards 50.0%, 61.8%, and 76.0% fibo at 1882.80, 1874.85, and 1865.20 respectively. The key target of this wave will be the low at 1848.67.

GOLD_H1
Risk Warning: the result of previous trading operations do not guarantee the same results in the future

USDCHF, “US Dollar vs Swiss Franc”

As we can see in the daily chart, after a test of the long-term 38.2% fibo and the convergence on MACD, USDCHF has reached 23.6% fibo; right now, it is correcting to the downside. After the correction is over, the asset may resume trading upwards to reach 38.2%, 50.0%, and 61.8% fibo at 0.9472, 0.9617, and 0.9764 respectively. However, an alternative scenario implies that the price may yet break the support at 0.8999 and then reach the long-term 50.0% fibo at 0.8707.

USDCHF_D1
Risk Warning: the result of previous trading operations do not guarantee the same results in the future

In the H4 chart, the asset is correcting downwards and has already reached 50.0% fibo. After reaching 61.8% fibo at 0.9144, the pair is expected to start a new rising impulse towards the high at 0.9296 or even higher.

USDCHF_H1

Article By RoboForex.com

Attention!
Forecasts presented in this section only reflect the author’s private opinion and should not be considered as guidance for trading. RoboForex LP bears no responsibility for trading results based on trading recommendations described in these analytical reviews.


Forex Technical Analysis & Forecast 05.10.2020

Article By RoboForex.com

EURUSD, “Euro vs US Dollar”

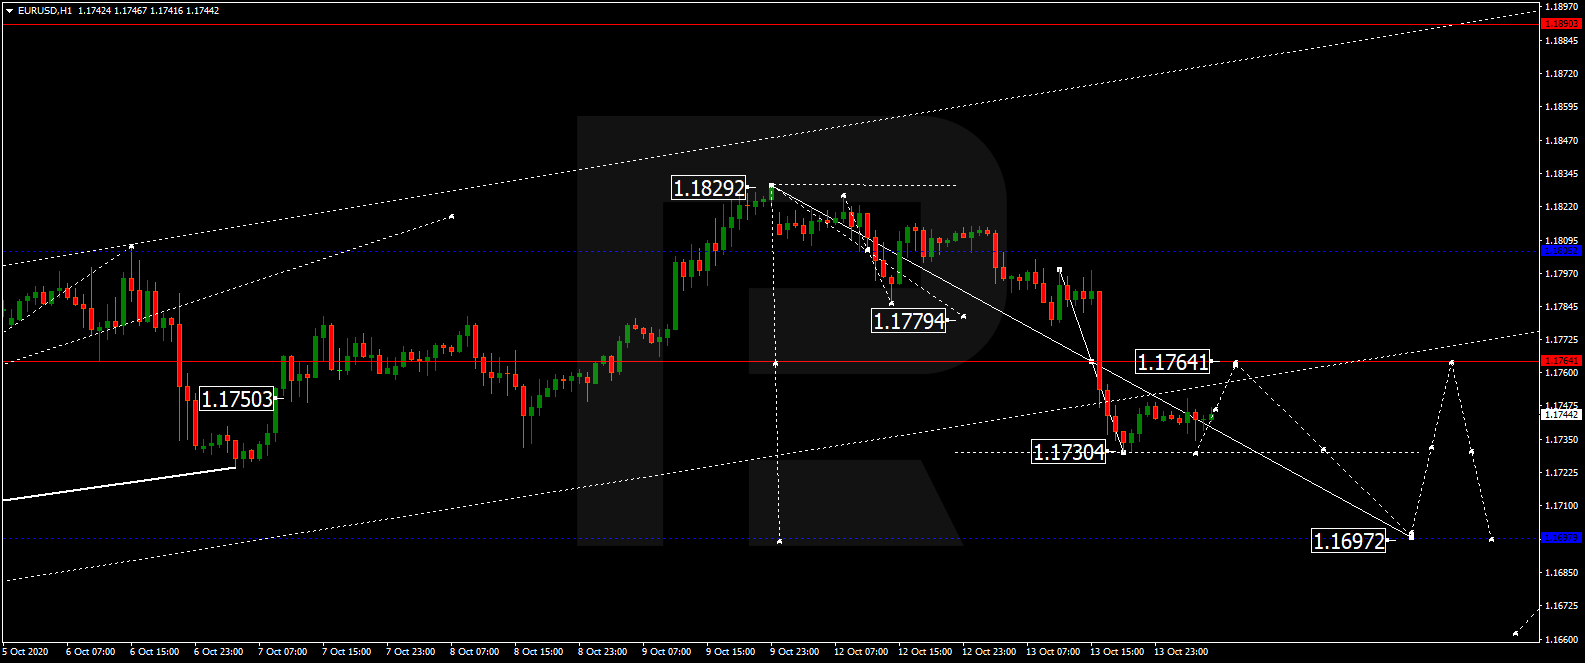
EURUSD is still consolidating around 1.1720. Today, the pair may grow to reach 1.1744 and then resume falling towards 1.1684. Later, the market may form one more ascending structure to return to 1.1720 and then continue trading within the downtrend with the first target at 1.1673.

EURUSD
Risk Warning: the result of previous trading operations do not guarantee the same results in the future

GBPUSD, “Great Britain Pound vs US Dollar”

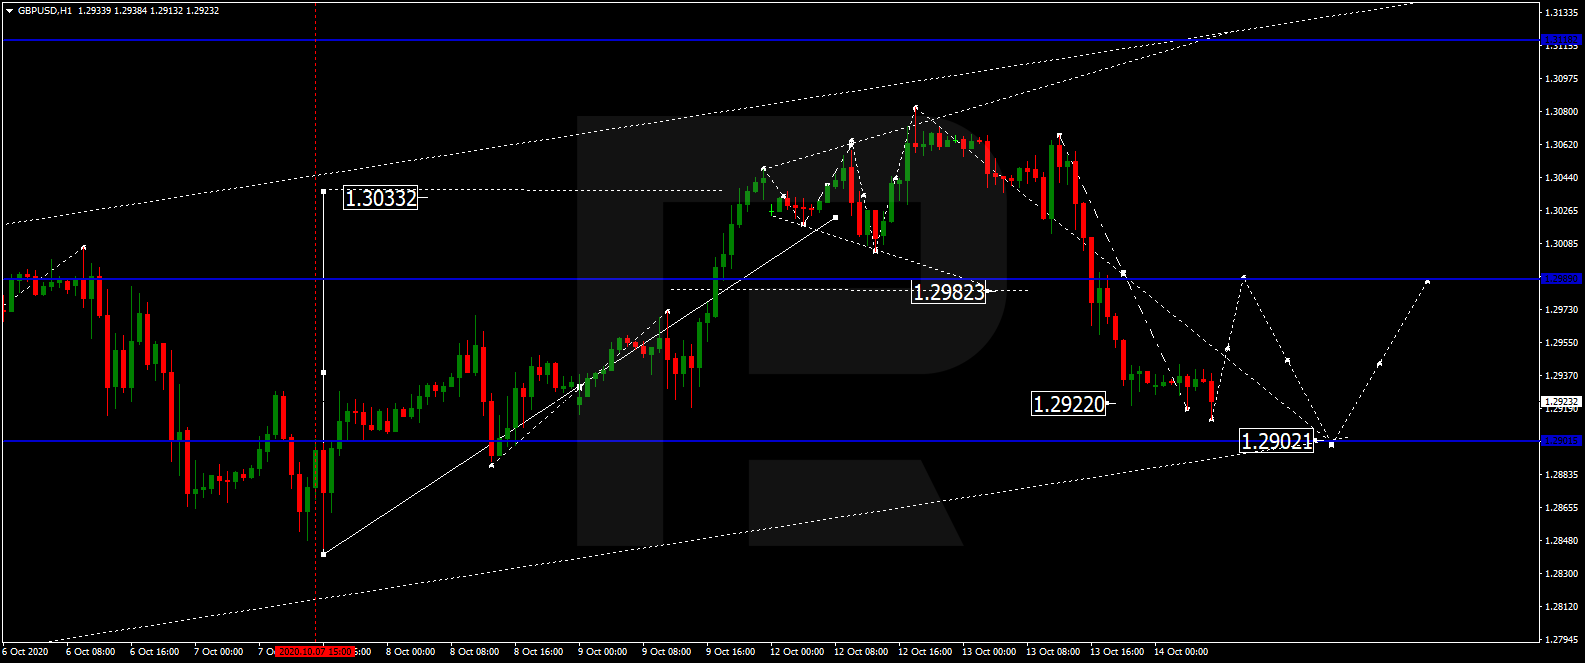
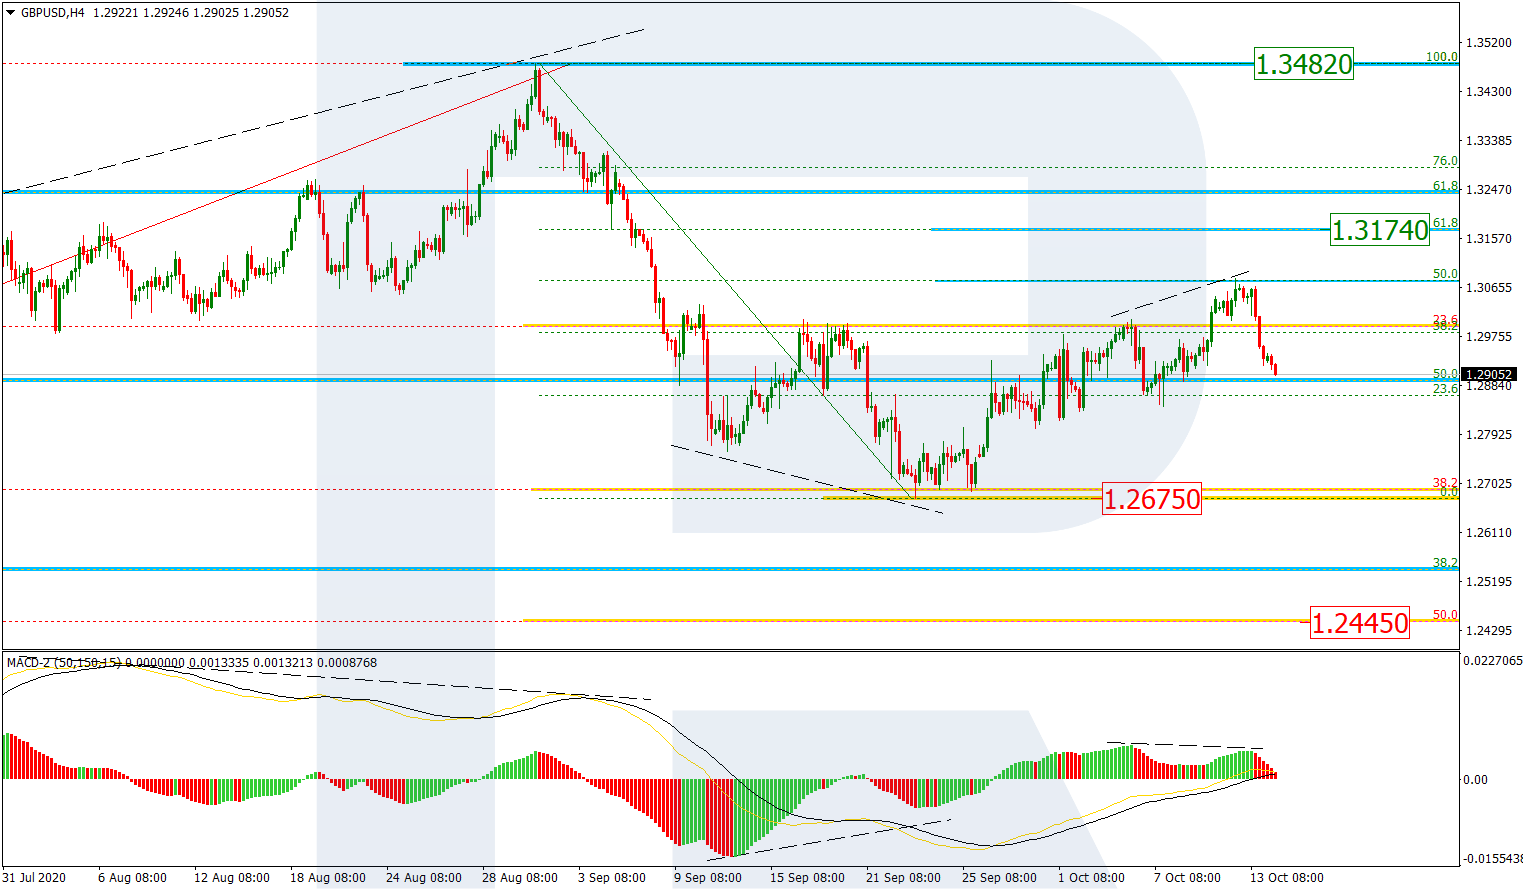
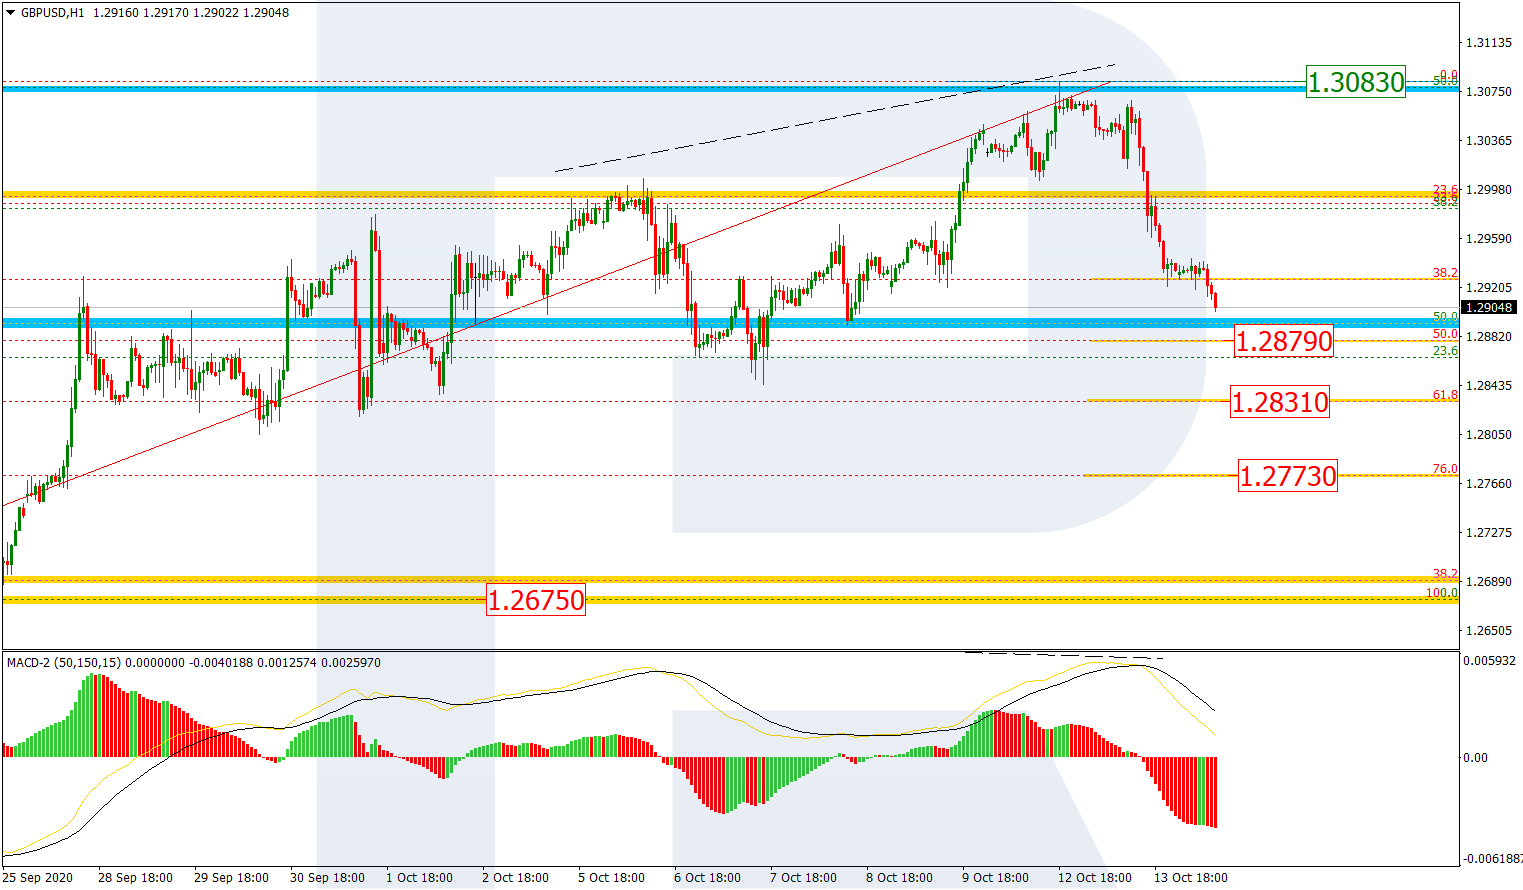
GBPUSD is still consolidating at 1.2900. Possibly, today the pair may grow to reach 1.2966 and then form a new descending structure towards 1.2828 or even continue falling with the first target at 1.2740.

GBPUSD
Risk Warning: the result of previous trading operations do not guarantee the same results in the future

USDRUB, “US Dollar vs Russian Ruble”

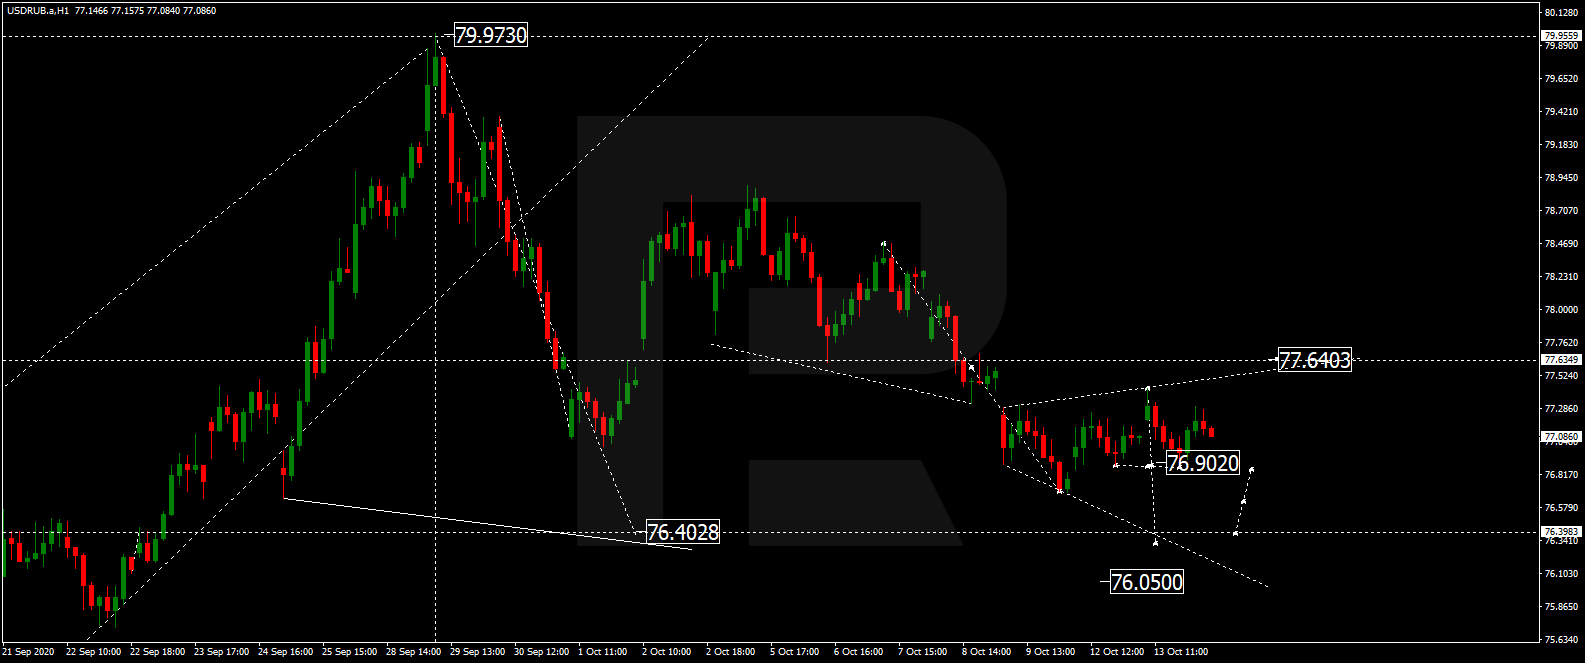
After finishing the ascending correctional structure at 78.80, USDRUB is expected to form a new descending wave with the first target at 76.40.

USDRUB
Risk Warning: the result of previous trading operations do not guarantee the same results in the future

USDJPY, “US Dollar vs Japanese Yen”

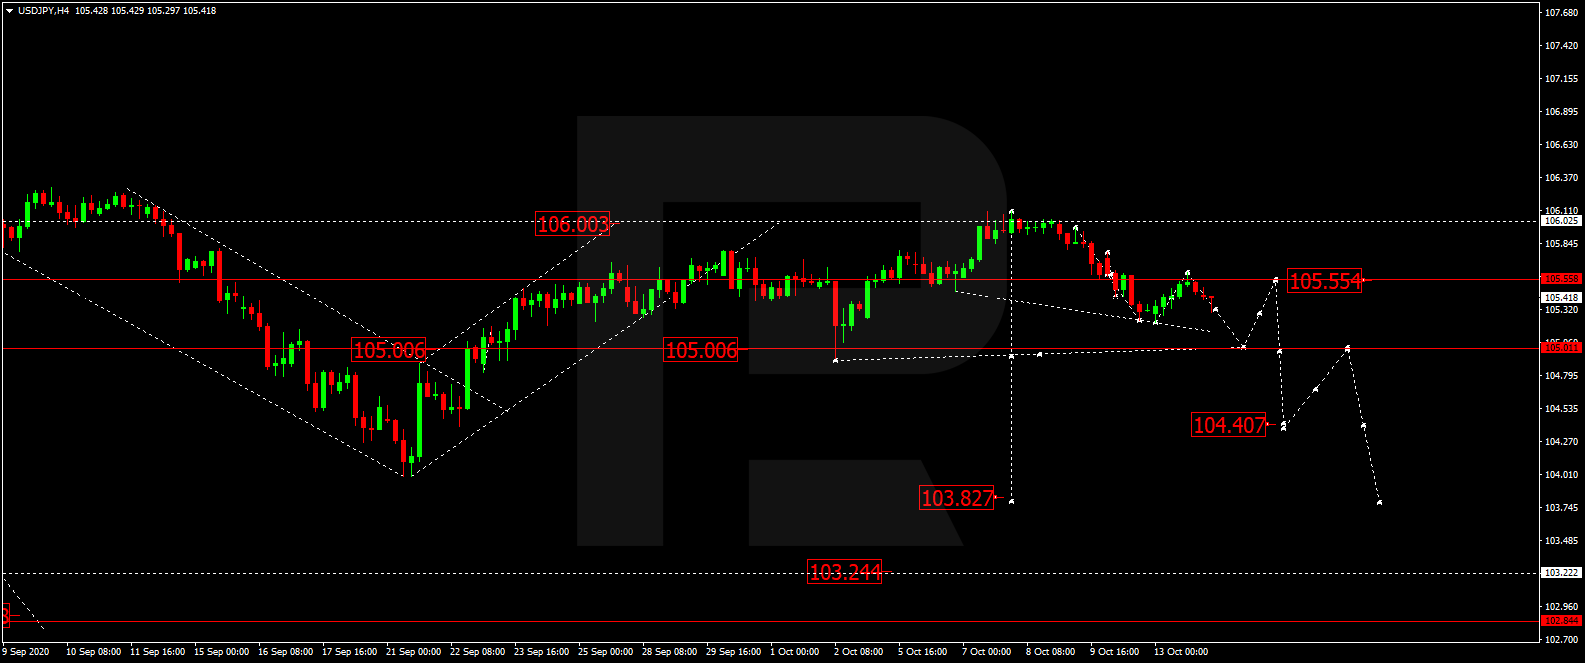
USDJPY is still forming the fifth structure of the current ascending wave with the target at 106.00. After that, the instrument may fall towards 105.00, thus forming a new consolidation range between these two levels. If later the price breaks this range to the downside, the market may form start another decline with the target at 103.25.

USDJPY
Risk Warning: the result of previous trading operations do not guarantee the same results in the future

USDCHF, “US Dollar vs Swiss Franc”

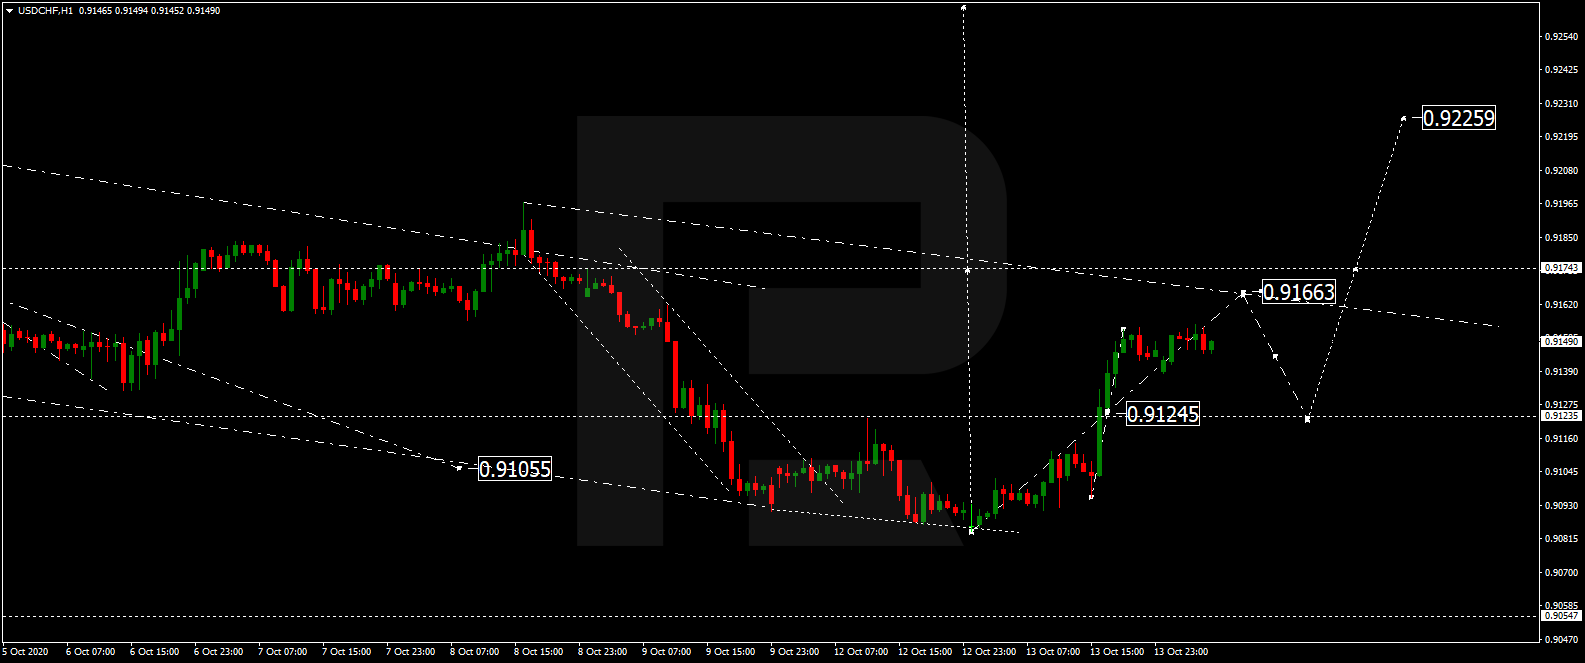
USDCHF is trading close to the downside border of a wide consolidation range. The main scenario implies that the price may expand the range down to 0.9155 and then start another growth towards the upside border at 0.9218. If later the price breaks this range to the upside, the market may resume moving upwards with the target at 0.9283 or even 0.9350.

USDCHF
Risk Warning: the result of previous trading operations do not guarantee the same results in the future

AUDUSD, “Australian Dollar vs US Dollar”

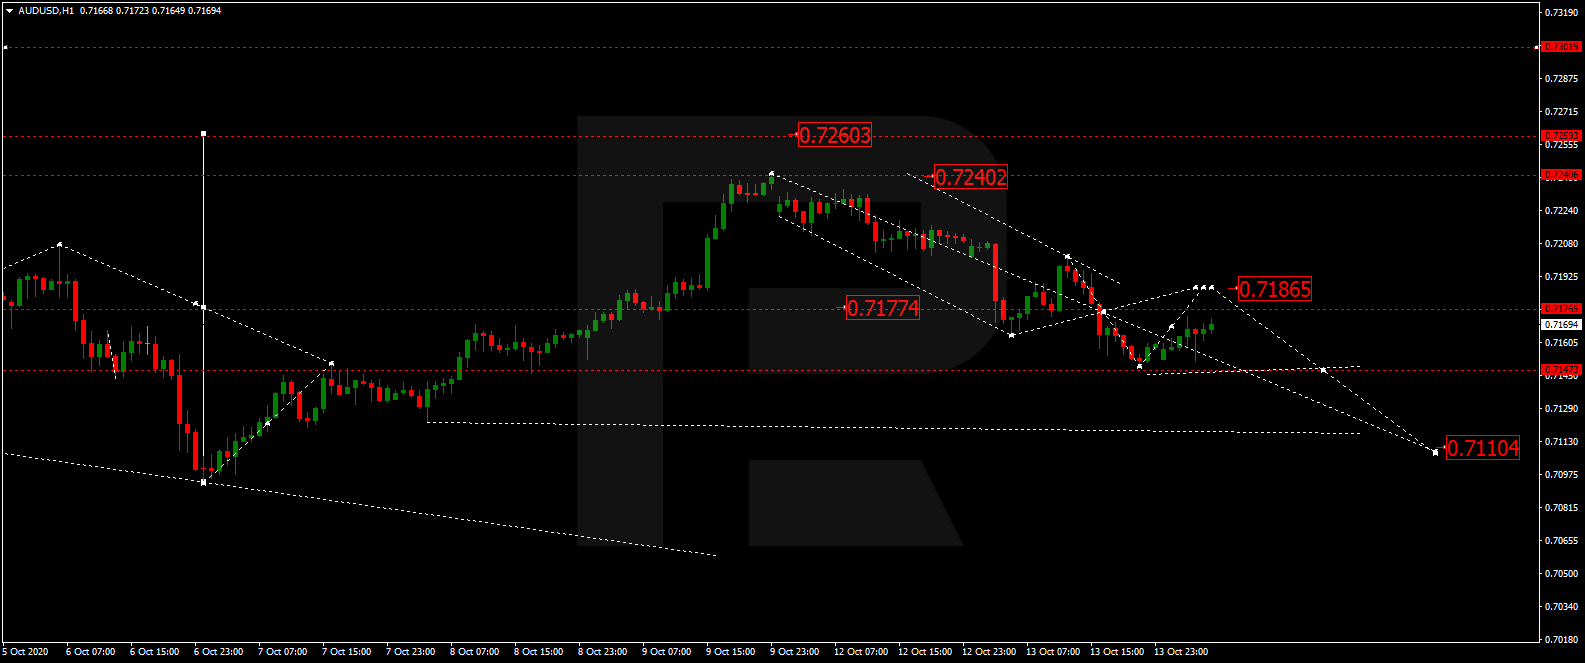
After completing two descending structures along with the correction at 0.7188, AUDUSD is expected to form the third one with the first target at 0.7017. After that, the instrument may correct in the form of a Flag pattern towards 0.7160 and then resume trading downwards to reach 0.7070.

AUDUSD
Risk Warning: the result of previous trading operations do not guarantee the same results in the future

BRENT

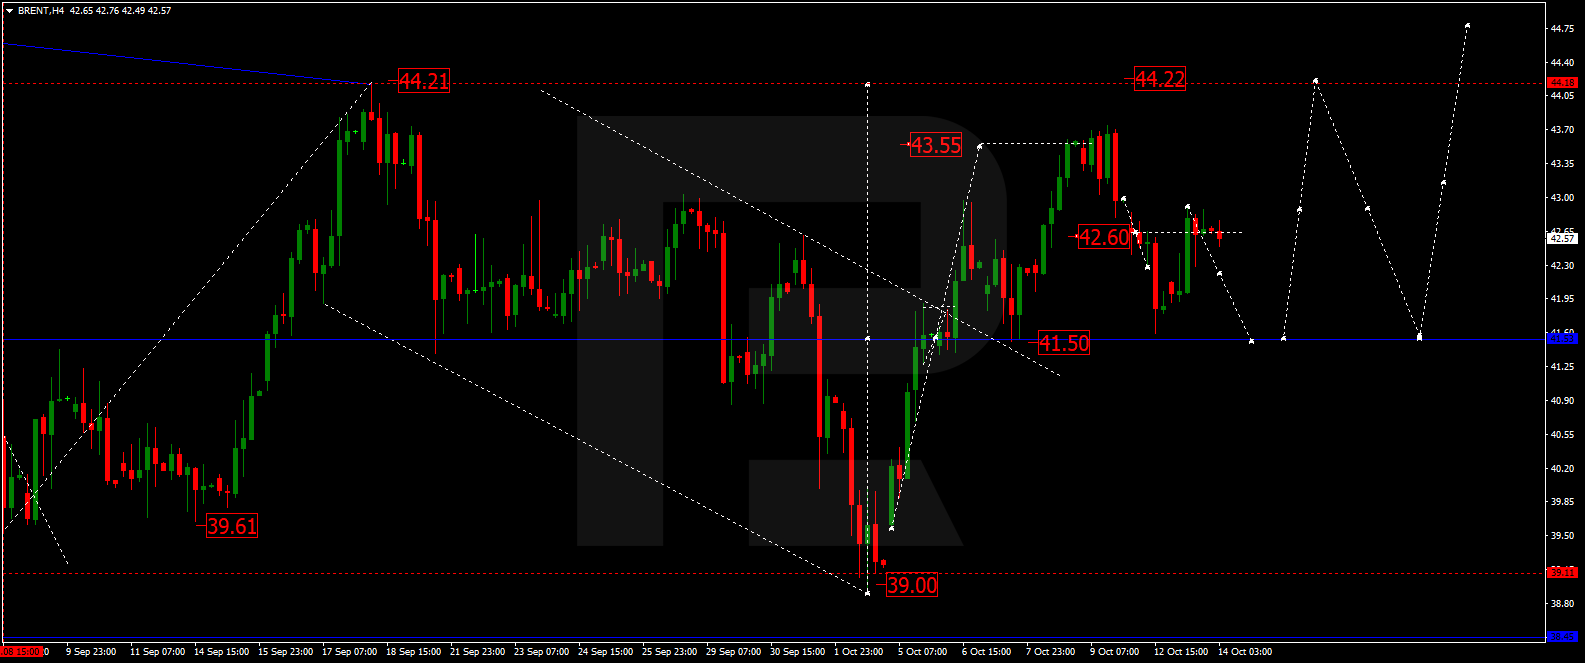
After finishing the descending wave at 39.00, Brent is expected to grow towards 40.80 and then start another correction to reach 40.00, thus forming a new consolidation range between these two levels. If later the price breaks this range to the upside, the market may continue moving upwards with the first target at 43.00.

BRENT
Risk Warning: the result of previous trading operations do not guarantee the same results in the future

XAUUSD, “Gold vs US Dollar”

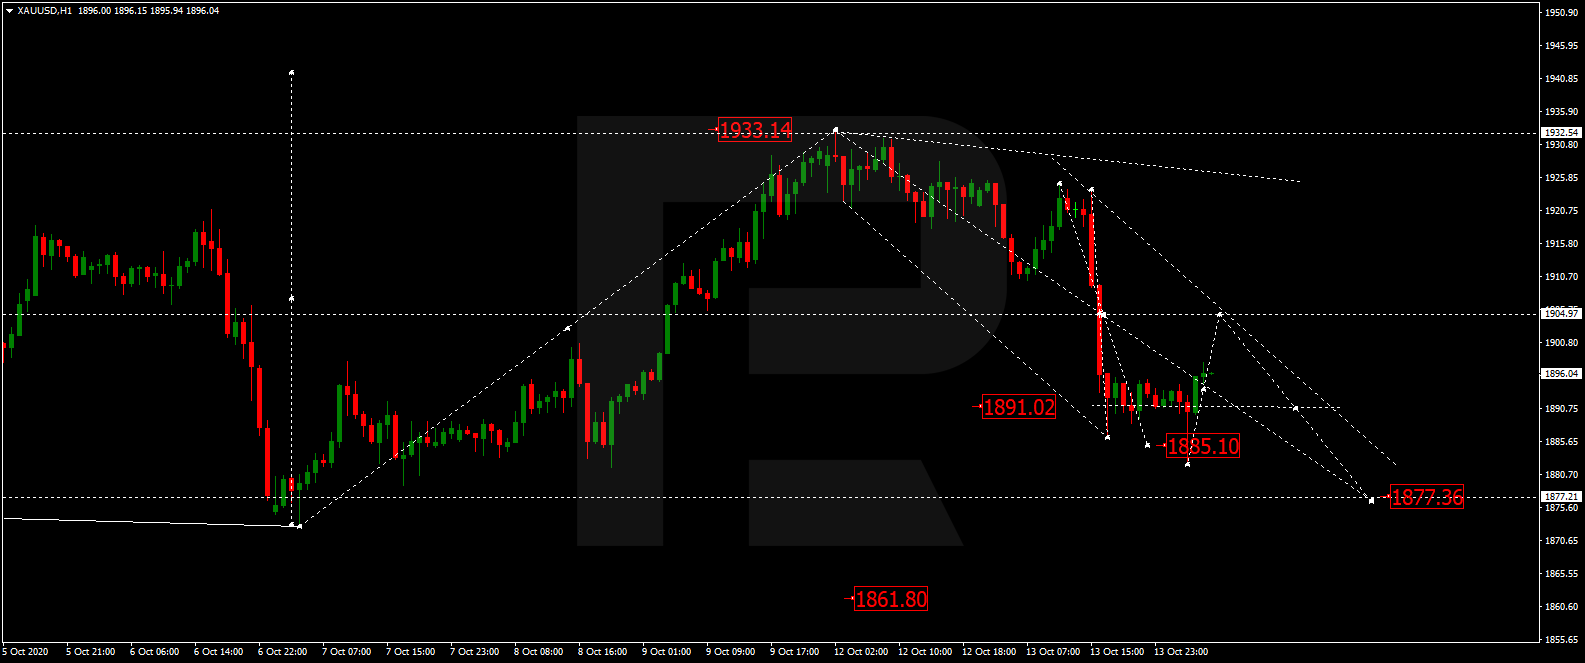
After completing the descending wave at 1893.60, Gold is expected to consolidate around this level. If later the price breaks this range to the upside, the market may correct towards 1905.00; if to the downside – resume trading downwards with the target at 1882.50.

GOLD
Risk Warning: the result of previous trading operations do not guarantee the same results in the future

BTCUSD, “Bitcoin vs US Dollar”

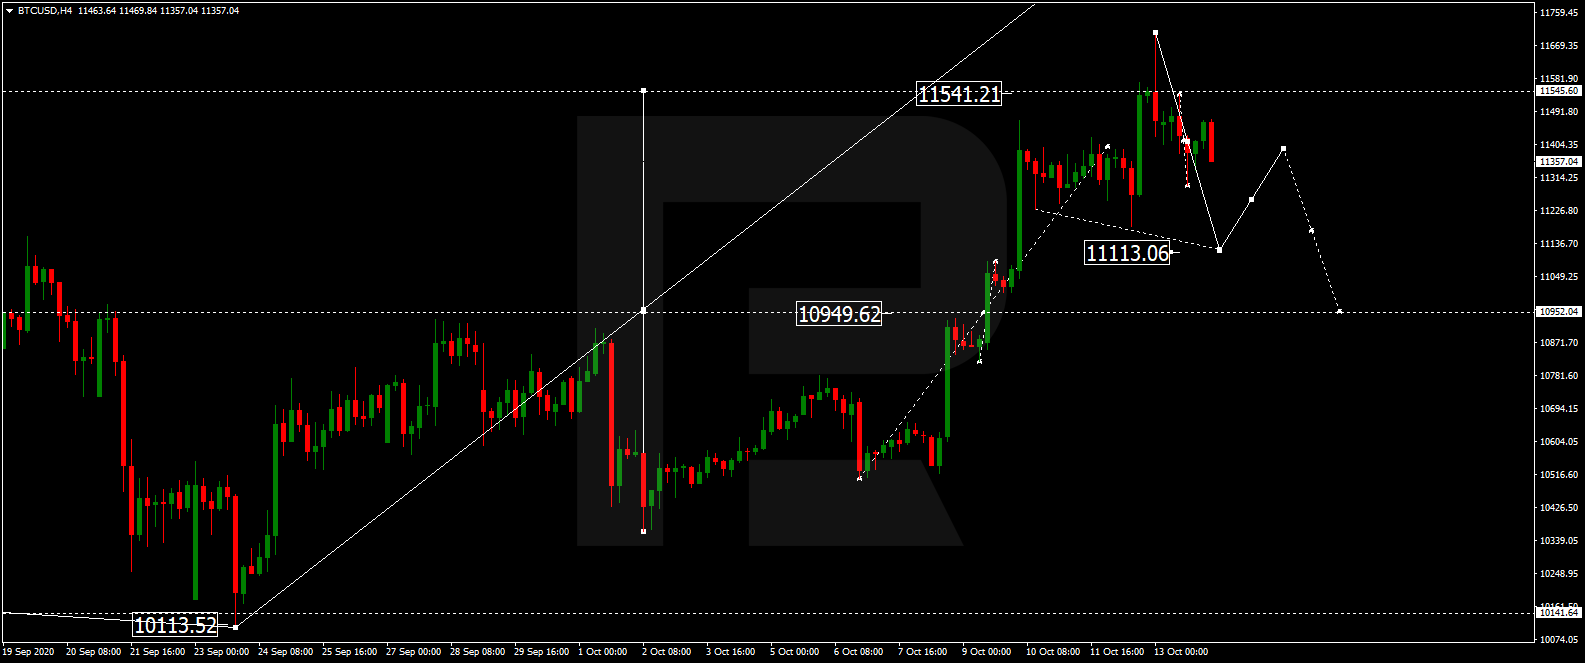
After falling and reaching 10400.00, BTCUSD has finished the correction towards 10700.00. Today, the asset may form a new descending structure to break 10400.00 and then continue trading within the downtrend with the short-term target at 9600.00.

BITCOIN
Risk Warning: the result of previous trading operations do not guarantee the same results in the future

S&P 500

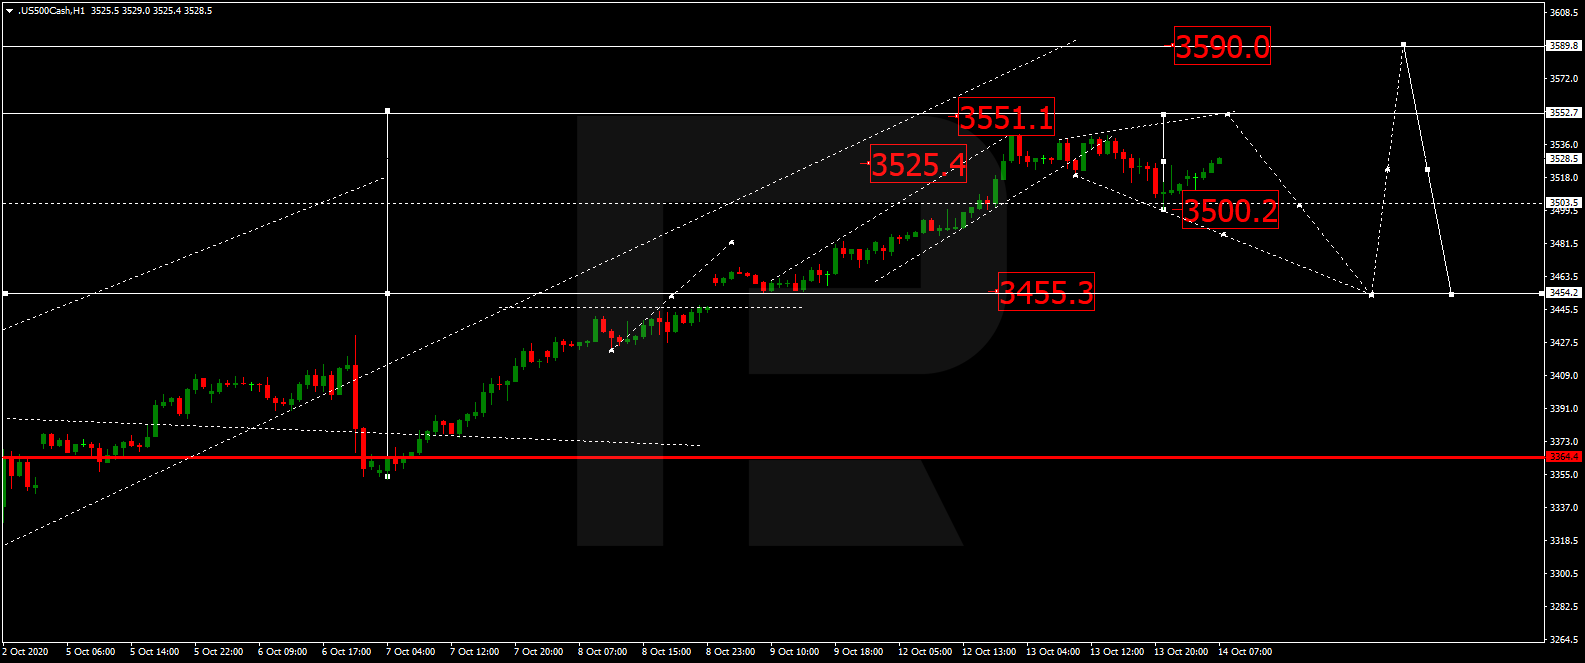
After finishing the descending impulse at 3310.2, the S&P index has completed the correction towards 3372.0; right now, it is consolidating below the latter level. Possibly, the asset may form a new descending structure to break 3300.0 and then resume falling with the short-term target at 3202.5.

S&P 500

Article By RoboForex.com

Attention!
Forecasts presented in this section only reflect the author’s private opinion and should not be considered as guidance for trading. RoboForex LP bears no responsibility for trading results based on trading recommendations described in these analytical reviews.
The Analytical Overview of the Main Currency Pairs on 2020.10.05

by JustForex

The EUR/USD currency pair

Technical indicators of the currency pair:
  • Prev Open: 1.17434
  • Open: 1.17110
  • % chg. over the last day: -0.29
  • Day’s range: 1.17052 – 1.17357
  • 52 wk range: 1.0637 – 1.2012

The technical pattern on the EUR/USD currency pair is still ambiguous. The trading instrument continues to consolidate. On Friday, the US published quite weak report on the labor market for September. At the moment, financial market participants expect up-to-date information on Donald Trump’s health status, who caught the coronavirus. The negotiations in the US Congress on a new stimulus package for the country’s economy are in the spotlight. EUR/USD quotes are consolidating in the range of 1.1700-1.1740. We recommend opening positions from these marks.

The news feed on 2020.10.05:
  • – Data on economic activity in the Eurozone at 11:00 (GMT+3:00);
  • – ISM non-manufacturing PMI at 17:00 (GMT+3:00).
EUR/USD

Indicators do not give accurate signals: the price has crossed the 50 MA and 100 MA.

The MACD histogram is near the 0 mark. There are no signals at the moment.

Stochastic Oscillator is in the neutral zone, the %K line is below the %D line, which gives a signal to sell EUR/USD.

Trading recommendations
  • Support levels: 1.1700, 1.1680, 1.1640
  • Resistance levels: 1.1740, 1.1770, 1.1800

If the price fixes above 1.1740, further growth of EUR/USD quotes is expected. The movement is tending to 1.1770-1.1800.

An alternative could be a decline in the EUR/USD currency pair to 1.1670-1.1650.

The GBP/USD currency pair

Technical indicators of the currency pair:
  • Prev Open: 1.28780
  • Open: 1.29321
  • % chg. over the last day: +0.33
  • Day’s range: 1.28996 – 1.29538
  • 52 wk range: 1.1409 – 1.3516

Trading activity and volatility on the GBP/USD currency pair remain high. At the same time, the British pound is still in a sideways trend. At the moment, the local support and resistance levels are 1.2890 and 1.2950, respectively. Investors expect new information regarding the Brexit talks. Today, financial market participants will assess important economic releases from the UK and the US. Positions should be opened from key levels.

At 11:30 (GMT+3:00), a number of indicators on economic activity in the UK will be published.

GBP/USD

Indicators do not give accurate signals: the price is testing 50 MA and 100 MA.

The MACD histogram is near the 0 mark. There are no signals at the moment.

Stochastic Oscillator is in the neutral zone, the %K line is below the %D line, which gives a signal to sell GBP/USD.

Trading recommendations
  • Support levels: 1.2890, 1.2830, 1.2800
  • Resistance levels: 1.2950, 1.2975, 1.3000

If the price fixes above 1.2950, further growth of the GBP/USD currency pair is expected. The movement is tending to the round level of 1.3000.

An alternative could be a drop in GBP/USD quotes to 1.2840-1.2820.

Open Account

The USD/CAD currency pair

Technical indicators of the currency pair:
  • Prev Open: 1.32883
  • Open: 1.32982
  • % chg. over the last day: +0.15
  • Day’s range: 1.32722 – 1.33031
  • 52 wk range: 1.2949 – 1.4669

Sales prevail on the USD/CAD currency pair. The loonie is testing local lows. At the moment, USD/CAD quotes are consolidating near the 1.3270 mark. The round level of 1.3300 is the nearest resistance. The trading instrument has the potential for further decline. We recommend paying attention to the economic releases from the US, as well as to the dynamics of “black gold” prices. Positions should be opened from key levels.

The news feed on Canada’s economy is calm.

USD/CAD

Indicators signal the power of sellers: the price has fixed below 50 MA and 100 MA.

The MACD histogram is in the negative zone, which indicates the bearish sentiment.

Stochastic Oscillator is in the oversold zone, the %K line has crossed the %D line. There are no signals at the moment.

Trading recommendations
  • Support levels: 1.3270, 1.3240, 1.3200
  • Resistance levels: 1.3300, 1.3330, 1.3355

If the price fixes below 1.3270, a further drop in USD/CAD quotes is expected. The movement is tending to 1.3240-1.3220.

An alternative could be the growth of the USD/CAD currency pair to 1.3330-1.3360.

The USD/JPY currency pair

Technical indicators of the currency pair:
  • Prev Open: 105.530
  • Open: 105.276
  • % chg. over the last day: -0.16
  • Day’s range: 105.232 – 105.637
  • 52 wk range: 101.19 – 112.41

The USD/JPY currency pair has recovered most of its losses after a sharp decline on Friday. At the moment, the trading instrument is consolidating. The key support and resistance levels are 105.40 and 105.65, respectively. Financial market participants expect additional drivers. We recommend paying attention to the dynamics of US government bonds yield. Positions should be opened from key levels.

The news feed on Japan’s economy is quite calm.

USD/JPY

Indicators do not give accurate signals: the price has crossed the 100 MA.

The MACD histogram is in the negative zone, which indicates the bearish sentiment.

Stochastic Oscillator is in the neutral zone, the %K line has crossed the %D line. There are no signals at the moment.

Trading recommendations
  • Support levels: 105.40, 105.25, 104.95
  • Resistance levels: 105.65, 105.80, 106.00

If the price fixes below 105.40, USD/JPY quotes are expected to fall. The movement is tending to 105.00-104.80.

An alternative could be the growth of the USD/JPY currency pair to the round level of 106.00.

by JustForex


This article reflects a personal opinion and should not be interpreted as an investment advice, and/or offer, and/or a persistent request for carrying out financial transactions, and/or a guarantee, and/or a forecast of future events.

Euro Slowly Growing

Author: Dmitriy Gurkovskiy, Chief Analyst at RoboForex

On Monday, October 5th, the major currency pair is gaining in weight and moving at 1.1731.

The market is slowly restoring to its balanced state: the Trumps are sick but not as serious as market players thought, the speed at which COVID-19 is spreading around the world is high but everyone got used to it, and the statistics on the US labor market turned out to be more neutral than expected.

The Unemployment Rate in the USA went down to 7.9% in September after being 8.4% in the previous month, which is better than the expected reading of 8.2%. The Average Hourly Earnings added only 0.1% m/m after expanding by 0.3% m/m the month before, while the Non-Farm Payroll showed 661K and that’s much worse than expected. However, it’s quite clear that the sector is not elastic and can’t expand and create new jobs on a regular basis.

On the other hand, it is apparent that the risks are reducing, thus allowing the major currency pair to get back to more or less strong levels.

In the H4 chart, EUR/USD has completed the ascending wave at 1.1768; right now, it is consolidating around 1.1720. Possibly, the pair may break the range to the downside to reach 1.1680 and then form one more ascending structure to test 1.1720 from below. After that, the instrument may fall to return to 1.1680 and then start a new correction towards 1.1720, which may be followed by another decline to break 1.1680. Later, the market may continue trading inside the downtrend with the target at 1.1584. From the technical point of view, this scenario is confirmed by MACD Oscillator: its signal line is no longer moving inside the histogram area. Later, the line is expected to fall towards 0 and break it. If it happens, the asset may boost its decline on the price chart.

As we can see in the H1 chart, after completing two descending impulses towards 1.1695, EUR/USD is correcting to reach 1.1744. After that, the instrument may continue trading downwards with the first target at 1.1680. From the technical point of view, this scenario is confirmed by Stochastic Oscillator: after breaking 80 to the downside, its signal line is moving downwards steadily. Later, it may continue falling to reach and break 50. After the line break 50, the asset may boost its decline on the price chart.

Disclaimer

Any forecasts contained herein are based on the author’s particular opinion. This analysis may not be treated as trading advice. RoboForex bears no responsibility for trading results based on trading recommendations and reviews contained herein.