Archive for Forex and Currency News – Page 354

The Dollar Index Is Consolidating. Investors Expect Additional Drivers

by JustForex

The greenback continues to show ambiguous results against its main competitors. Yesterday, the dollar index (#DX) closed the trading session with a slight decline (-0.07%). Investors expect additional drivers. Financial market participants continue to monitor the progress of a new stimulus package for the US economy. Donald Trump declined previous comments and said he was ready to approve support for individuals, small businesses and airlines.

The second wave of the coronavirus pandemic has come to the fore again. At the moment, the number of infected in the world has exceeded 36.4 million. Some EU countries have recorded a new anti-record for the number of infected and are planning to introduce new restrictive measures. ECB officials are concerned about the prospects for economic recovery in the Eurozone. The regulator is ready to expand financial incentives if necessary. Today, the UK has released a series of weak statistics on manufacturing output and the country’s GDP. We expect data on the labor market in Canada.

The “black gold” prices have been declining after a sharp rally the day before. At the moment, futures for the WTI crude oil are testing the $40.70 mark per barrel.

Market indicators

Yesterday, there was the bullish sentiment in the US stock market: #SPY (+0.89%), #DIA (+0.48%), #QQQ (+0.53%).

The 10-year US government bonds yield is consolidating. The indicator has reached 0.76-0.77%.

The news feed for 2020.10.09:
  • – Data on the labor market in Canada at 15:30 (GMT+3:00).

by JustForex


This article reflects a personal opinion and should not be interpreted as an investment advice, and/or offer, and/or a persistent request for carrying out financial transactions, and/or a guarantee, and/or a forecast of future events.

EURUSD significantly above 1.1600, despite rising US yields – 1,2000 soon?

By Admiral Markets

Economic Events October 09, 2020Source: Economic Events October 09, 2020 – Admiral Markets’ Forex Calendar

Into the weekly close, the economic calendar is quite thin, even though recent political developments are delivering enough fuel for potential volatility in FX markets and, thus, EURUSD.

Tuesday evening US President Donald Trump tweeted that he told his administration’s negotiators around US Treasury Mnuchin to end their current coronavirus stimulus talks with Democrats until after the US presidential election on the 3rd of November.

Here is what happened, as a result:

  • The US-Dollar saw an initial sharp push higher
  • EURUSD dropped, but the currency pair failed to gain further bearish momentum and stabilized around the short-term important support of 1.1680/1700
  • In less than 24 hours, EURUSD traded slightly below 1.1800 again

This underlines that US-Dollar long engagements should be taken, if at all, very cautiously.

That may be especially true since the US-Dollar hasn’t shown any signs of further strength or an acceleration of its recent short squeeze with 10-year US yields pushing to the highest levels since June.

In fact, we consider the implicit USD weakness over recent days as proof of our overall bullish EURUSD take, expecting it to trade around 1.2500 and even higher 6 to 12 months from now.

While we still foresee a stint to below 1.1600 and the currency pair testing the region around a potential mid-term long-trigger around 1.1450/1500, the US-Dollar could see heavier selling pressure, especially if the FED issues a Corona relief package for further monetary stimulus by significantly ballooning its balance sheet beyond the 7 trillion USD, thus, levelling the path back to 1.2000 in the days to come:

Admiral Markets MT5 with MT5SE Add-on EURUSD Daily chartSource: Admiral Markets MT5 with MT5SE Add-on EURUSD Daily chart (between July 03, 2019, to October 08, 2020). Accessed: October 08, 2020, at 10:00 PM GMT. Please note: Past performance is not a reliable indicator of future results, or future performance.

In 2015, the value of the EURUSD fell by 10.2%, in 2016, it fell by 3.2%, in 2017, it increased by 13.92%, in 2018, it fell by 4.4%, and in 2019, it fell by 2.2%, meaning that in five years, it was down by 7.3%.

Discover the world’s #1 multi-asset platform

Admiral Markets offers professional traders the ability to trade with MetaTrader 5, allowing you to experience trading at a significantly higher, more rewarding level than with MetaTrader 4. Experience benefits such as the addition of the Market Heat Map, so you can compare various currency pairs to see which ones might be lucrative investments, access real-time trading data, and so much more. Click the banner below to start your FREE download of MT5!

Trade With MetaTrader 5

Disclaimer: The given data provides additional information regarding all analysis, estimates, prognosis, forecasts or other similar assessments or information (hereinafter “Analysis”) published on the website of Admiral Markets. Before making any investment decisions please pay close attention to the following:

  1. This is a marketing communication. The analysis is published for informative purposes only and are in no way to be construed as investment advice or recommendation. It has not been prepared in accordance with legal requirements designed to promote the independence of investment research, and that it is not subject to any prohibition on dealing ahead of the dissemination of investment research.
  2. Any investment decision is made by each client alone whereas Admiral Markets shall not be responsible for any loss or damage arising from any such decision, whether or not based on the Analysis.
  3. Each of the Analysis is prepared by an independent analyst (Jens Klatt, Professional Trader and Analyst, hereinafter “Author”) based on the Author’s personal estimations.
  4. To ensure that the interests of the clients would be protected and objectivity of the Analysis would not be damaged Admiral Markets has established relevant internal procedures for prevention and management of conflicts of interest.
  5. Whilst every reasonable effort is taken to ensure that all sources of the Analysis are reliable and that all information is presented, as much as possible, in an understandable, timely, precise and complete manner, Admiral Markets does not guarantee the accuracy or completeness of any information contained within the Analysis. The presented figures that refer to any past performance is not a reliable indicator of future results.
  6. The contents of the Analysis should not be construed as an express or implied promise, guarantee or implication by Admiral Markets that the client shall profit from the strategies therein or that losses in connection therewith may or shall be limited.
  7. Any kind of previous or modelled performance of financial instruments indicated within the Publication should not be construed as an express or implied promise, guarantee or implication by Admiral Markets for any future performance. The value of the financial instrument may both increase and decrease and the preservation of the asset value is not guaranteed.
  8. The projections included in the Analysis may be subject to additional fees, taxes or other charges, depending on the subject of the Publication. The price list applicable to the services provided by Admiral Markets is publicly available from the website of Admiral Markets.
  9. Leveraged products (including contracts for difference) are speculative in nature and may result in losses or profit. Before you start trading, you should make sure that you understand all the risks.

By Admiral Markets

Japanese Candlesticks Analysis 08.10.2020 (EURUSD, USDJPY, EURGBP)

Article By RoboForex.com

EURUSD, “Euro vs. US Dollar”

As we can see in the H4 chart, the asset is finishing the correction within the downtrend. By now, EURUSD has formed several reversal patterns, such as Harami and Shooting Star, close to the channel’s upside border. Possibly, the pair may reverse and resume its decline. In this case, the downside target may be the next support level at 1.1620. At the same time, an alternative scenario says that the instrument may grow to reach 1.1830 before resuming the downtrend.

EURUSD
Risk Warning: the result of previous trading operations do not guarantee the same results in the future

USDJPY, “US Dollar vs. Japanese Yen”

As we can see in the H4 chart, the uptrend continues. After forming several reversal patterns, such as Shooting Star, not far from the resistance level, USDJPY may reverse, form a slight correction, and then resume the ascending tendency. In this case, the upside target is the resistance level at 106.45. Still, there is an opposite scenario, which says that the instrument may correct towards 105.25 before resuming the uptrend.

USDJPY
Risk Warning: the result of previous trading operations do not guarantee the same results in the future

EURGBP, “Euro vs. Great Britain Pound”

As we can see in the H4 chart, the asset is completing the correction within the descending tendency. After forming several reversal patterns, including Shooting Star, close to the resistance level, EURGBP is still reversing. The downside target is the support level at 0.9000. However, there might be another scenario, according to which the asset may return to 0.9155 without reversing.

EURGBP

Article By RoboForex.com

Attention!
Forecasts presented in this section only reflect the author’s private opinion and should not be considered as guidance for trading. RoboForex LP bears no responsibility for trading results based on trading recommendations described in these analytical reviews.

Ichimoku Cloud Analysis 08.10.2020 (EURAUD, USDJPY, AUDUSD)

Article By RoboForex.com

EURAUD, “Euro vs Australian Dollar”

EURAUD is trading at 1.6478; the instrument is moving above Ichimoku Cloud, thus indicating an ascending tendency. The markets could indicate that the price may test the cloud’s upside border at 1.6470 and then resume moving upwards to reach 1.6595. Another signal in favor of further uptrend will be a rebound from the downside border of the Triangle pattern. However, the bullish scenario may be canceled if the price breaks the cloud’s downside border and fixes below 1.6395. In this case, the pair may continue falling towards 1.6305. To confirm further growth, the asset must break the pattern’s upside border and fix above 1.6530. The target of the pattern materialization is at 1.6565.

EURAUD
Risk Warning: the result of previous trading operations do not guarantee the same results in the future

USDJPY, “US Dollar vs Japanese Yen”

USDJPY is trading at 105.95; the instrument is moving above Ichimoku Cloud, thus indicating an ascending tendency. The markets could indicate that the price may test the cloud’s upside border at 105.75 and then resume moving upwards to reach 106.55. Another signal in favor of further uptrend will be a rebound from the rising channel’s downside border. However, the bullish scenario may no longer be valid if the price breaks the cloud’s downside border and fixes below 105.45. In this case, the pair may continue falling towards 104.65.

USDJPY
Risk Warning: the result of previous trading operations do not guarantee the same results in the future

AUDUSD, “Australian Dollar vs US Dollar”

AUDUSD is trading at 0.7138; the instrument is moving inside Ichimoku Cloud, thus indicating a sideways tendency. The markets could indicate that the price may test the cloud’s upside border at 0.7150 and then resume moving downwards to reach 0.7070. Another signal in favor of further downtrend will be a rebound from the resistance level. However, the bearish scenario may no longer be valid if the price breaks the cloud’s upside border and fixes above 0.7175. In this case, the pair may continue growing towards 0.7265.

AUDUSD

Article By RoboForex.com

Attention!
Forecasts presented in this section only reflect the author’s private opinion and should not be considered as guidance for trading. RoboForex LP bears no responsibility for trading results based on trading recommendations described in these analytical reviews.

The Analytical Overview of the Main Currency Pairs on 2020.10.08

by JustForex

The EUR/USD currency pair

Technical indicators of the currency pair:
  • Prev Open: 1.17332
  • Open: 1.17600
  • % chg. over the last day: +0.22
  • Day’s range: 1.17587 – 1.17817
  • 52 wk range: 1.0637 – 1.2012

The greenback shows a variety of trends against its main competitors. At the moment, EUR/USD quotes are consolidating. The euro is testing local support and resistance levels: 1.1760 and 1.1780, respectively. Investors assess the controversial comments by US President Donald Trump concerning the new stimulus package. According to the FOMC minutes, the Fed plans to keep interest rates at current levels for a long time. We recommend opening positions from key levels.

The news feed on 2020.10.08:
  • – ECB monetary policy statement at 14:30 (GMT+3:00);
  • – Initial jobless claims at 15:30 (GMT+3:00).
EUR/USD

Indicators do not give accurate signals: the price has crossed the 50 MA.

The MACD histogram is in the positive zone, which indicates the bullish sentiment.

Stochastic Oscillator is located near the overbought zone, the %K line has crossed the %D line. There are no signals at the moment.

Trading recommendations
  • Support levels: 1.1760, 1.1725, 1.1700
  • Resistance levels: 1.1780, 1.1800, 1.1850

If the price fixes below 1.1760, EUR/USD quotes are expected to fall. The movement is tending to 1.1725-1.1700.

An alternative could be the growth of the EUR/USD currency pair to 1.1800-1.1840.

The GBP/USD currency pair

Technical indicators of the currency pair:
  • Prev Open: 1.28669
  • Open: 1.29107
  • % chg. over the last day: +0.32
  • Day’s range: 1.29060 – 1.29667
  • 52 wk range: 1.1409 – 1.3516

The bullish sentiment prevails on the GBP/USD currency pair. The British pound has updated local highs. At the moment, the trading instrument is consolidating in the range of 1.2930-1.2975. Further growth of GBP/USD quotes is possible. The Brexit talks and a new stimulus package in the US Congress are in the spotlight. Positions should be opened from key levels.

We recommend paying attention to the speech by the Bank of England Governor.

GBP/USD

Indicators do not give accurate signals: the price is testing 50 MA and 100 MA.

The MACD histogram has moved into a positive zone, which indicates the bullish sentiment.

Stochastic Oscillator is located near the overbought zone, the %K line has crossed the %D line. There are no signals at the moment.

Trading recommendations
  • Support levels: 1.2930, 1.2900, 1.2865
  • Resistance levels: 1.2975, 1.3000, 1.3050

If the price fixes above 1.2975, further growth of the GBP/USD currency pair is expected. The movement is tending to 1.3000-1.3030.

An alternative could be a drop in GBP/USD quotes to 1.2880-1.2850.

The USD/CAD currency pair

Technical indicators of the currency pair:
  • Prev Open: 1.33047
  • Open: 1.32596
  • % chg. over the last day: -0.41
  • Day’s range: 1.32369 – 1.32657
  • 52 wk range: 1.2949 – 1.4669

USD/CAD quotes continue to show a negative trend. The trading instrument has updated local lows. At the moment, the loonie is consolidating in the range of 1.3235-1.3265. Further strengthening of the Canadian dollar against the greenback is possible. We recommend paying attention to the dynamics of “black gold” prices. Positions should be opened from key levels.

At 15:30 (GMT+3:00), data on building permits in Canada will be published.

USD/CAD

Indicators signal the power of sellers: the price has fixed below 50 MA and 100 MA.

The MACD histogram is in the negative zone, which indicates the bearish sentiment.

Stochastic Oscillator is in the oversold zone, the %K line has crossed the %D line. There are no signals at the moment.

Trading recommendations
  • Support levels: 1.3235, 1.3200
  • Resistance levels: 1.3265, 1.3285, 1.3310

If the price fixes below 1.3235, USD/CAD quotes are expected to fall further. The movement is tending to 1.3200-1.3180.

An alternative could be the growth of the USD/CAD currency pair to 1.3290-1.3320.

The USD/JPY currency pair

Technical indicators of the currency pair:
  • Prev Open: 105.609
  • Open: 105.967
  • % chg. over the last day: +0.32
  • Day’s range: 105.924 – 106.106
  • 52 wk range: 101.19 – 112.41

The USD/JPY currency pair has become stable after prolonged growth. At the moment, the trading instrument is consolidating. Local support and resistance levels are 105.90 and 106.10, respectively. In the near future, a technical correction of USD/JPY quotes is possible. We recommend paying attention to the dynamics of US government bonds yield. Positions should be opened from key levels.

The news feed on Japan’s economy is calm.

USD/JPY

Indicators signal the power of buyers: the price has fixed above 50 MA and 100 MA.

The MACD histogram is in the positive zone, which gives a signal to buy USD/JPY.

Stochastic Oscillator is in the neutral zone, the %K line has started crossing the %D line. There are no signals at the moment.

Trading recommendations
  • Support levels: 105.90, 105.80, 105.55
  • Resistance levels: 106.10, 106.50

If the price fixes above 106.10, further growth of USD/JPY quotes is expected. The movement is tending to 106.40-106.60.

An alternative could be a decline in the USD/JPY currency pair to 105.70-105.50.

by JustForex


This article reflects a personal opinion and should not be interpreted as an investment advice, and/or offer, and/or a persistent request for carrying out financial transactions, and/or a guarantee, and/or a forecast of future events.

Fibonacci Retracements Analysis 07.10.2020 (GBPUSD, EURJPY)

Article By RoboForex.com

GBPUSD, “Great Britain Pound vs US Dollar”

As we can see in the H4 chart, after a rebound from 38.2% fibo and a local convergence on MACD, GBPUSD is finishing a correction to the upside at 23.6% fibo. If the price forms a new rising impulse and fixes above the latter level, it may be a signal in favor of a new mid-term rising wave to reach the high at 1.3482. However, the most probable scenario implies further decline to reach 50.0% and 61.8% fibo at 1.2446 and 1.2200 respectively.

GBPUSD_H4
Risk Warning: the result of previous trading operations do not guarantee the same results in the future

The H1 chart shows a more detailed structure of the current decline after the divergence on MACD, which has already reached 38.2% fibo. If the pair breaks the high at 1.3007, the price may continue growing towards the mid-term 50.0% fibo at 1.3079. However, considering that the first descending impulse was pretty strong, the market may continue falling to reach 50.0%, 61.8%, and 76.0% fibo at 1.2841, 1.2802, and 1.2755 respectively. The key downside target is the support – the low at 1.2675.

GBPUSD_H1
Risk Warning: the result of previous trading operations do not guarantee the same results in the future

EURJPY, “Euro vs. Japanese Yen”

As we can see in the H4 chart, after a rebound from 38.2% fibo and convergence on MACD, EURJPY is correcting upwards and has returned to 23.6% fibo but failed to fix above it. Possibly, the pair may yet update its local highs but the most probable scenario implies a new descending wave with the targets at 38.2%, 50.0%, and 61.8% fibo at 122.22, 120.75, and 119.25 respectively.

EURJPY_H4
Risk Warning: the result of previous trading operations do not guarantee the same results in the future

In the H1 chart, the instrument is moving downwards after a divergence on MACD. Despite reaching 38.2% fibo, the asset has chances to reach the high at 124.73, break it, and then continue growing towards mid-term 61.8% and 76.0% fibo at 124.90 and 125.48 respectively. However, taking into account the divergence, the instrument may yet resume falling to reach 50.0%, 61.8%, and 76.0% fibo at 123.55, 123.27, and 122.94 respectively. The key downside target is the low at 122.38.

EURJPY_H1

Article By RoboForex.com

Attention!
Forecasts presented in this section only reflect the author’s private opinion and should not be considered as guidance for trading. RoboForex LP bears no responsibility for trading results based on trading recommendations described in these analytical reviews.

Forex Technical Analysis & Forecast 07.10.2020

Article By RoboForex.com

EURUSD, “Euro vs US Dollar”

After reaching 1.1800 and rebounding from it to the downside, EURUSD has reached 1.1744; right now, it is consolidating below this level. If later the price breaks this range to the downside, the market may start a new decline towards 1.1705 or even reach the target at 1.1680; if to the upside – form one more correctional structure towards 1.1766 and then resume trading downwards to reach the above-mentioned target.

EURUSD
Risk Warning: the result of previous trading operations do not guarantee the same results in the future

GBPUSD, “Great Britain Pound vs US Dollar”

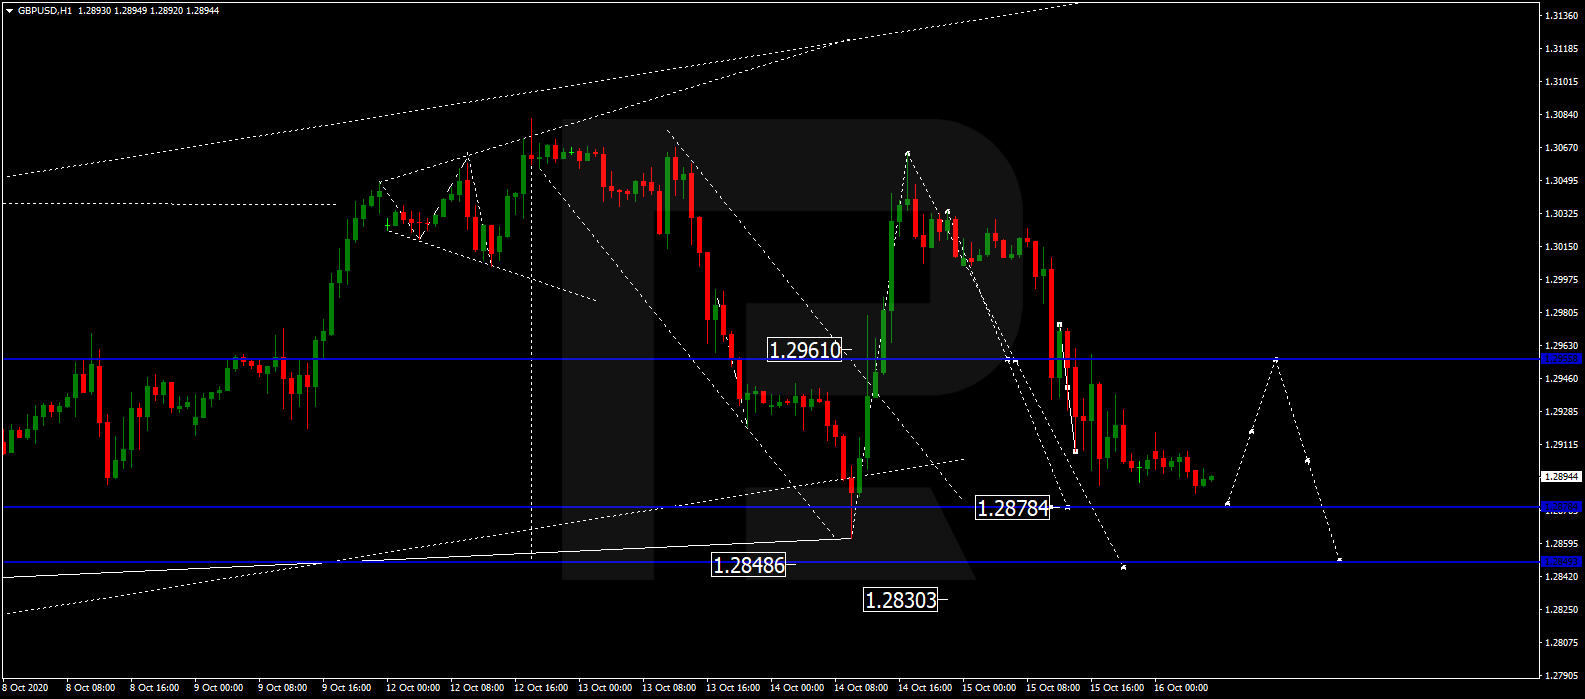
After finishing the descending wave at 1.2899, GBPUSD is consolidating below this level. If later the price breaks this range to the downside, the market may form a new descending structure towards 1.2813 or even reach the target at 1.2790; if to the upside – start another correction towards 1.2950 and then resume trading within the downtrend to reach the above-mentioned target.

GBPUSD
Risk Warning: the result of previous trading operations do not guarantee the same results in the future

USDRUB, “US Dollar vs Russian Ruble”

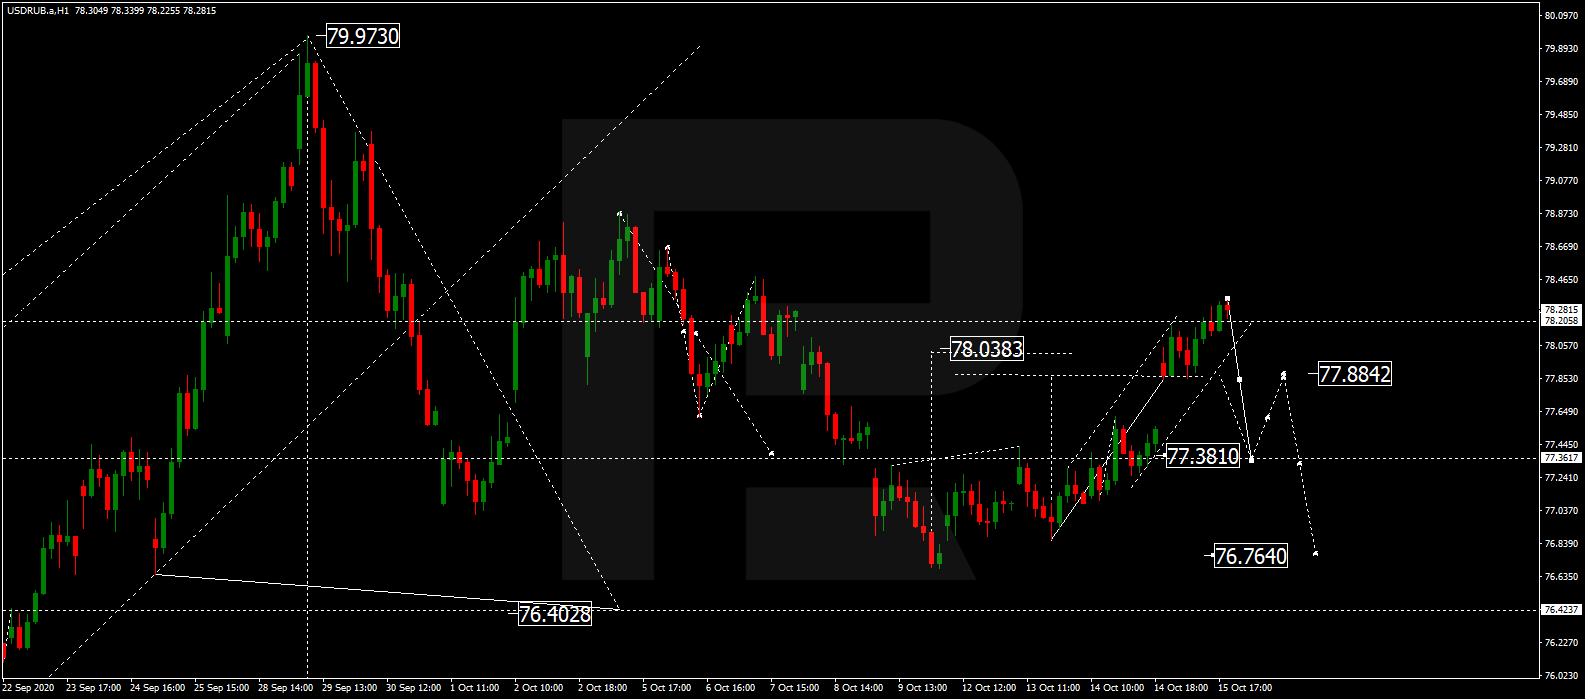
USDRUB is still consolidating around 78.18. Today, the pair may fall towards 77.35 and then start a new correction to return to 78.18. After that, the instrument may resume falling with the first target at 76.40.

USDRUB
Risk Warning: the result of previous trading operations do not guarantee the same results in the future

USDJPY, “US Dollar vs Japanese Yen”

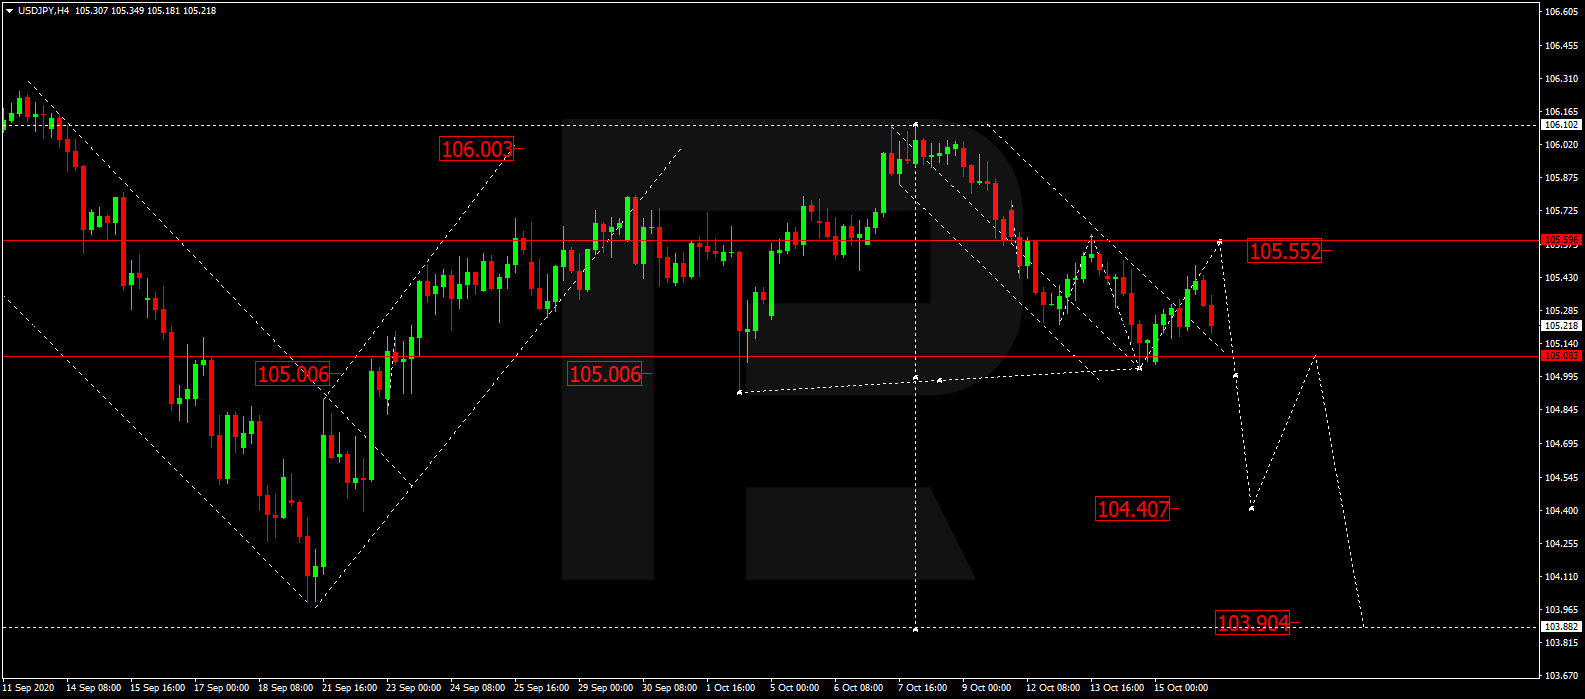
USDJPY is consolidating below 105.50 without any particular direction. Possibly, the pair may reach 106.00. and then form a new descending structure to break 105.00. Later, the market may continue trading downwards with the target at 104.40.

USDJPY
Risk Warning: the result of previous trading operations do not guarantee the same results in the future

USDCHF, “US Dollar vs Swiss Franc”

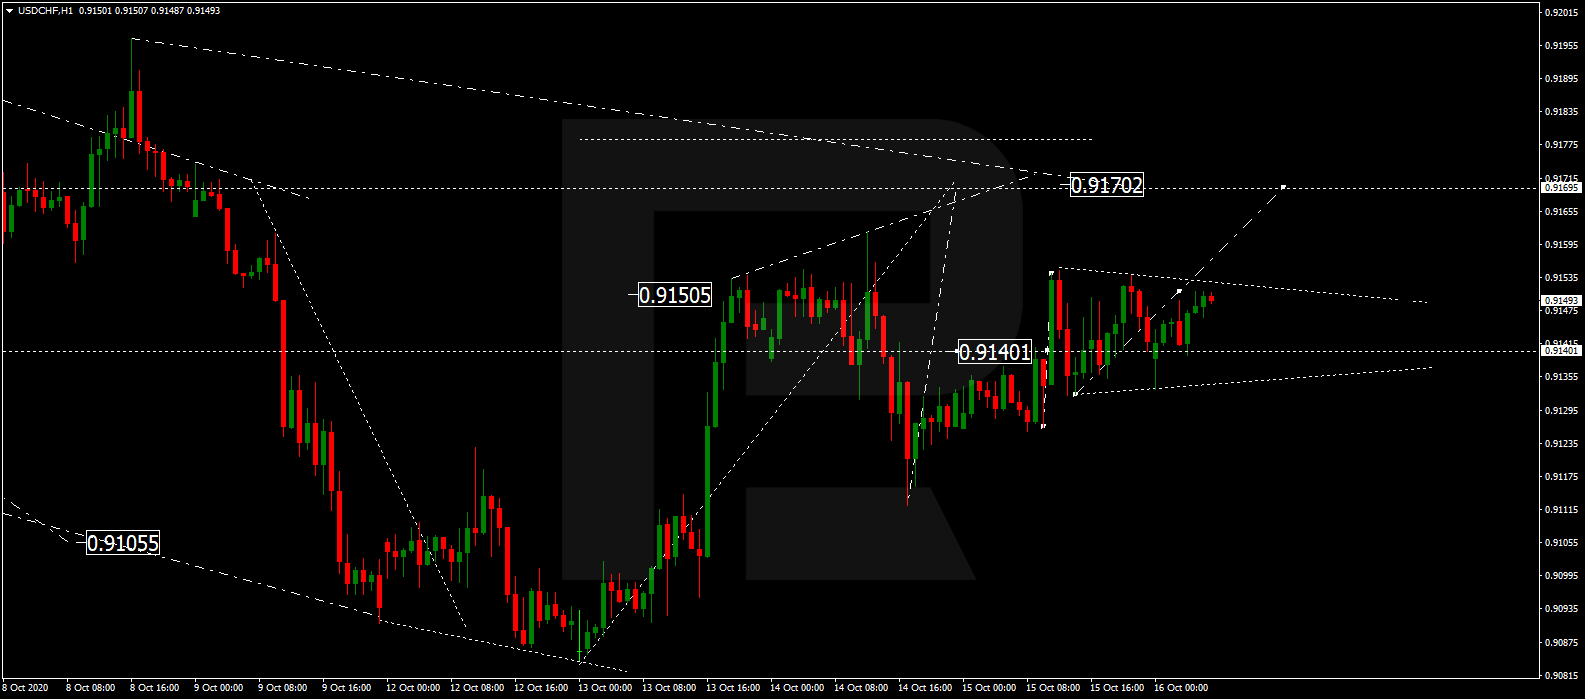
USDCHF has completed the ascending structure at 0.9180; right now, it is consolidating around this level. If later the price breaks this range to the upside, the market may start a new growth with the target at 0.9225; if to the downside – correct towards 0.9155 and then resume trading upwards to reach the above-mentioned target.

USDCHF
Risk Warning: the result of previous trading operations do not guarantee the same results in the future

AUDUSD, “Australian Dollar vs US Dollar”

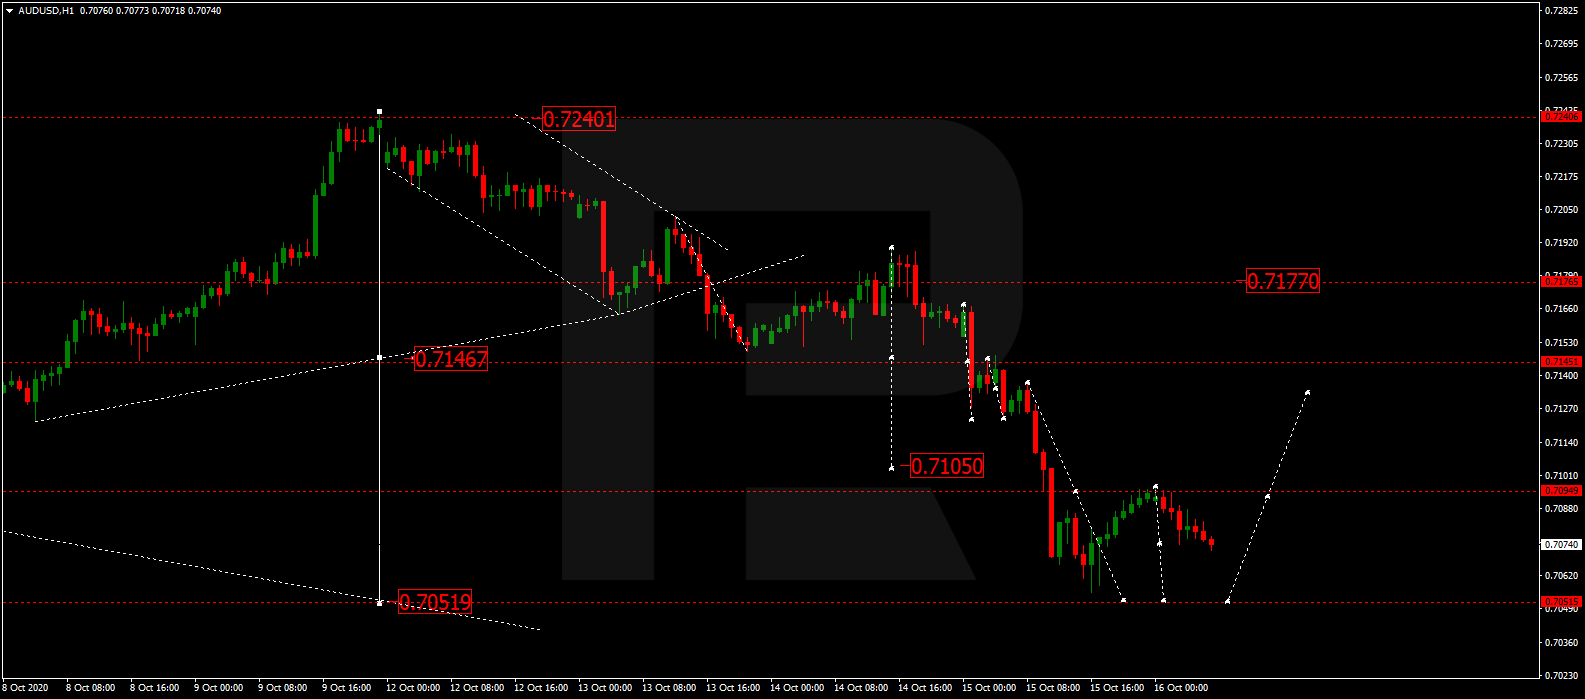
After completing the descending structure at 0.7100, AUDUSD is consolidating above this level. If later the price breaks this range to the downside, the market may start a new decline with the target at 0.7000; if to the upside – form one more correctional structure towards 0.7155 and then resume trading downwards to reach the above-mentioned target.

AUDUSD
Risk Warning: the result of previous trading operations do not guarantee the same results in the future

BRENT

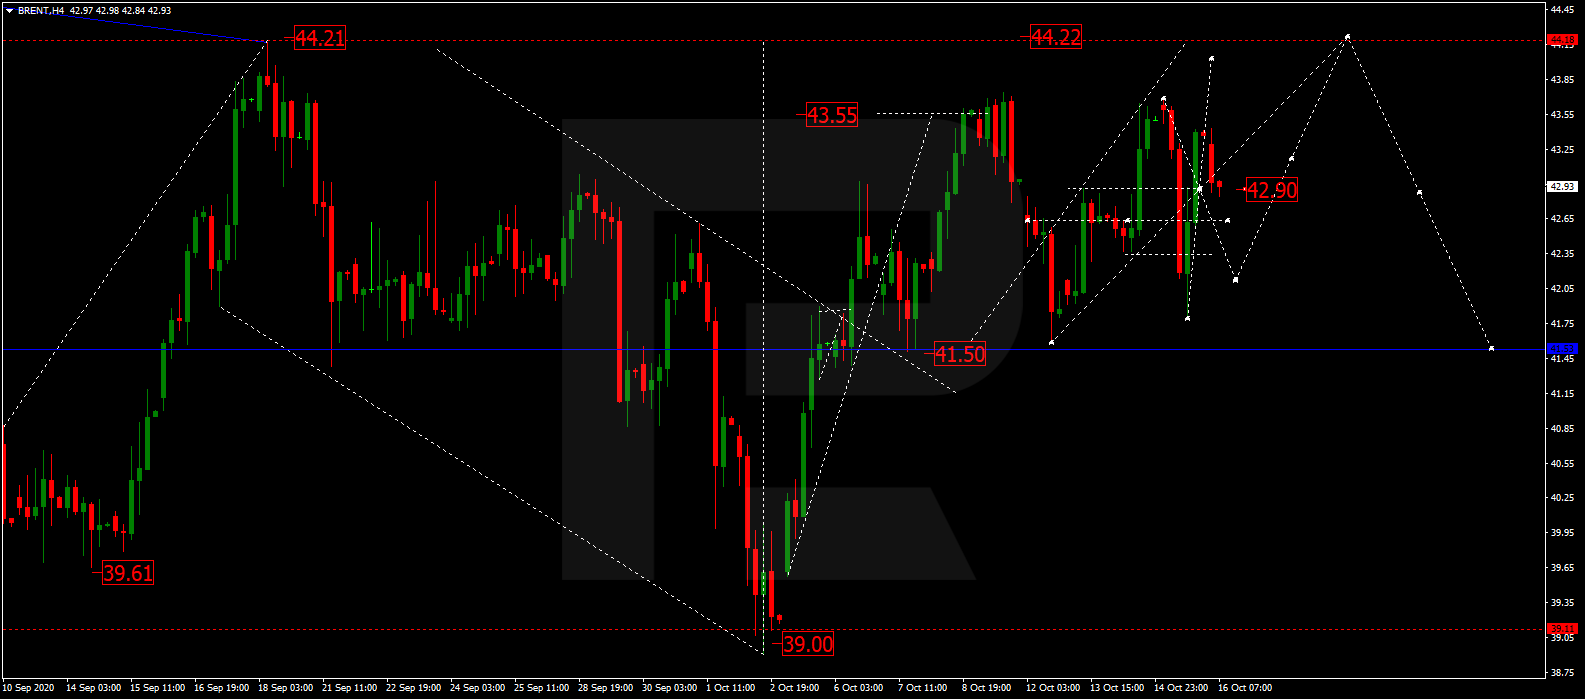
After finishing the ascending structure at 42.97, Brent is consolidating above 41.50. Today, the asset may continue trading within the uptrend with the target at44.22 and then start a new correction to return to 41.50.

BRENT
Risk Warning: the result of previous trading operations do not guarantee the same results in the future

XAUUSD, “Gold vs US Dollar”

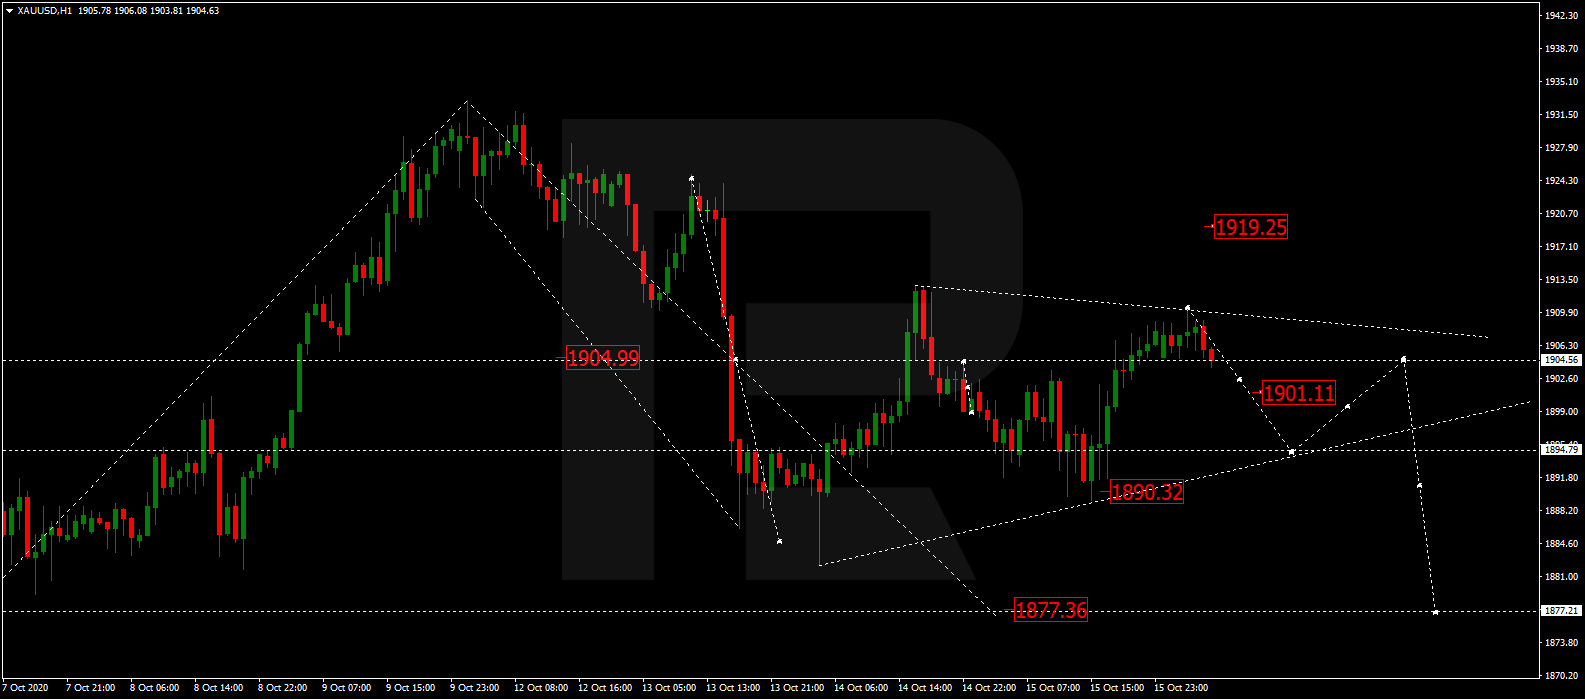
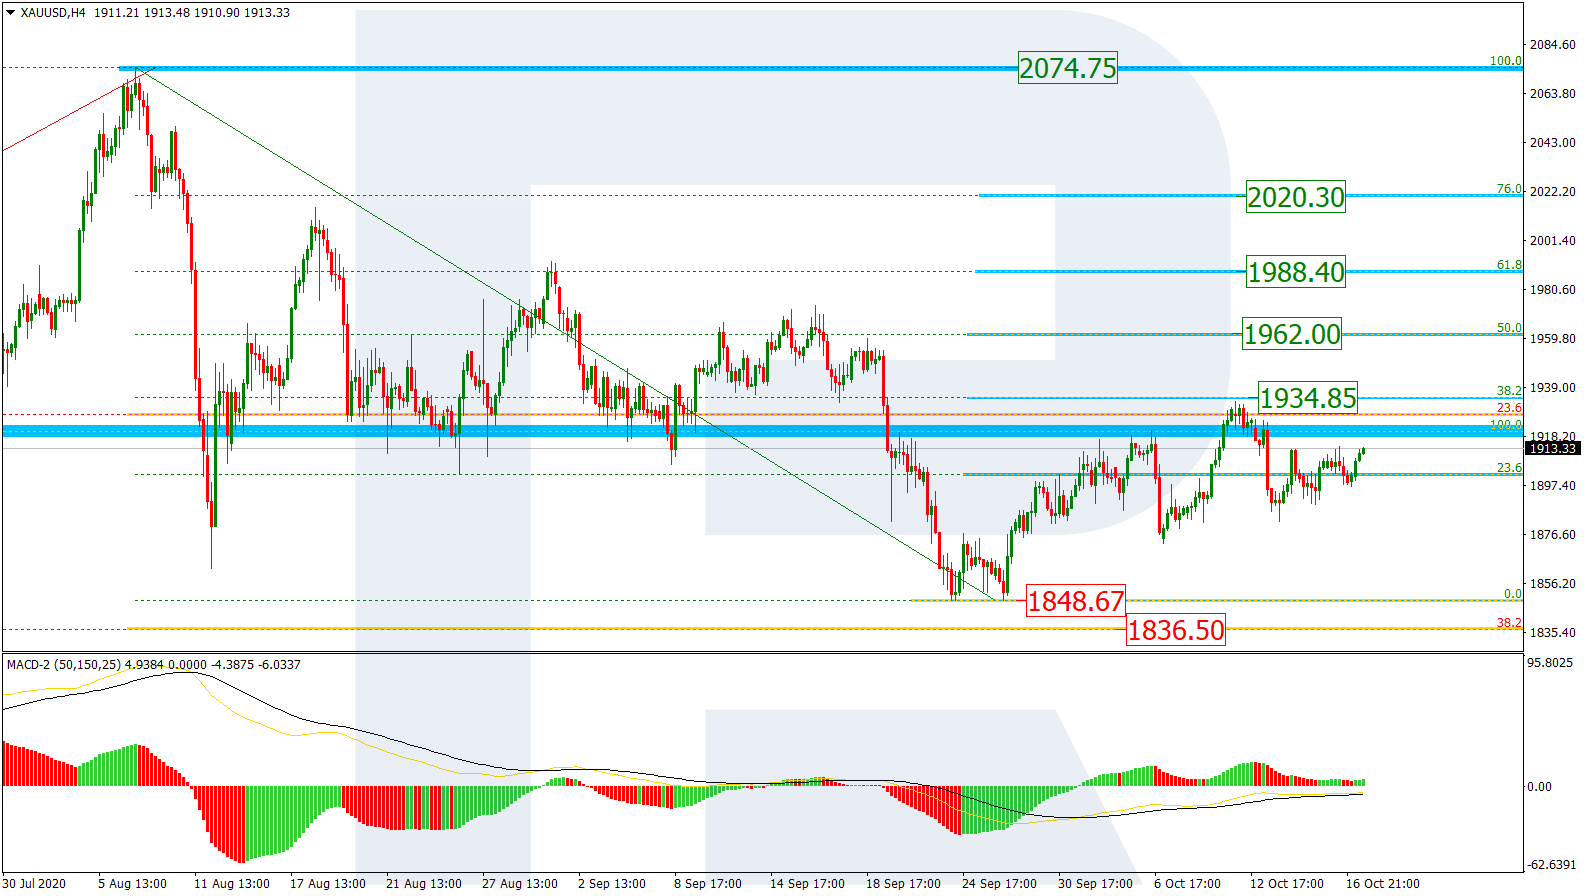
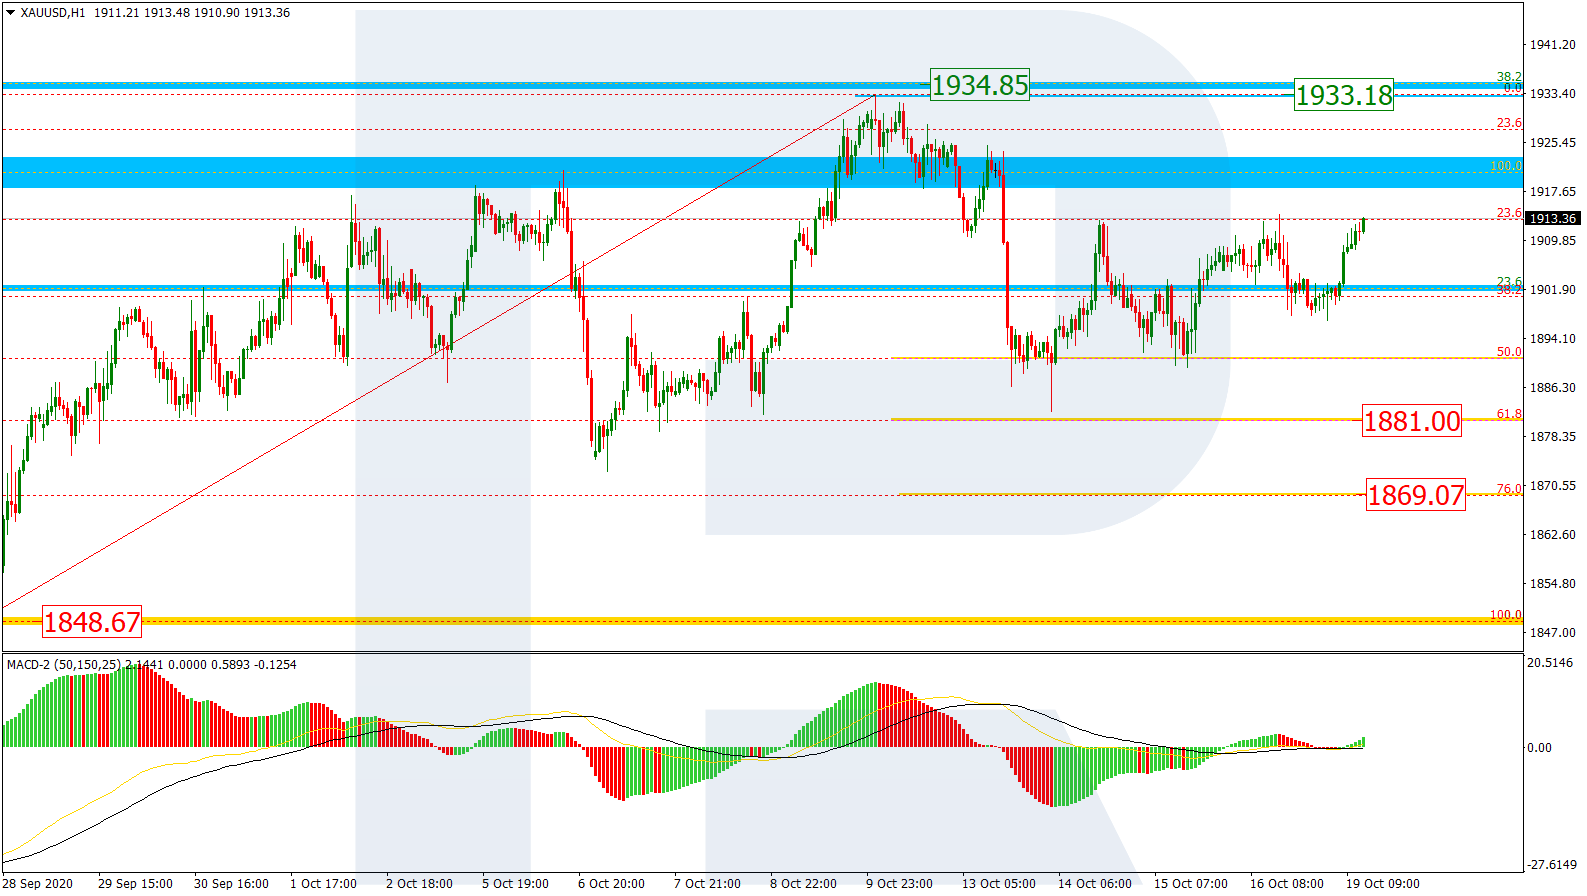
After completing the descending structure at 1882.00, Gold is expected to correct towards 1898.90. Later, the market may start a new decline to break 1875.00 and then continue falling with the target at 1850.00.

GOLD
Risk Warning: the result of previous trading operations do not guarantee the same results in the future

BTCUSD, “Bitcoin vs US Dollar”

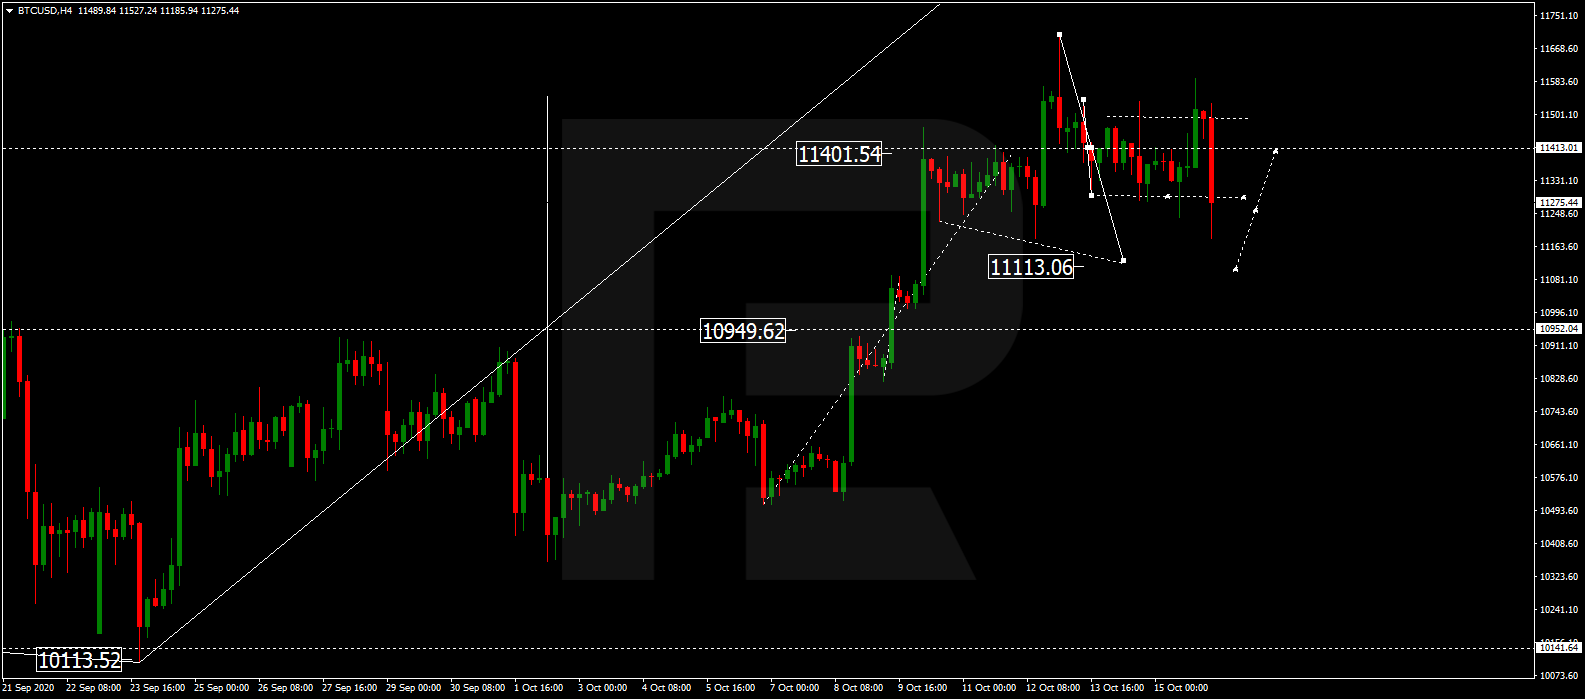
After completing the descending structure at 10600.00 and breaking it to the downside, BTCUSD is still falling with the target at 10330.00. After that, the instrument may form one more ascending structure to return to 10600.00 and then resume trading within the downtrend to break 10300.00. Later, the market may continue falling with the target at 10100.00.

BITCOIN
Risk Warning: the result of previous trading operations do not guarantee the same results in the future

S&P 500

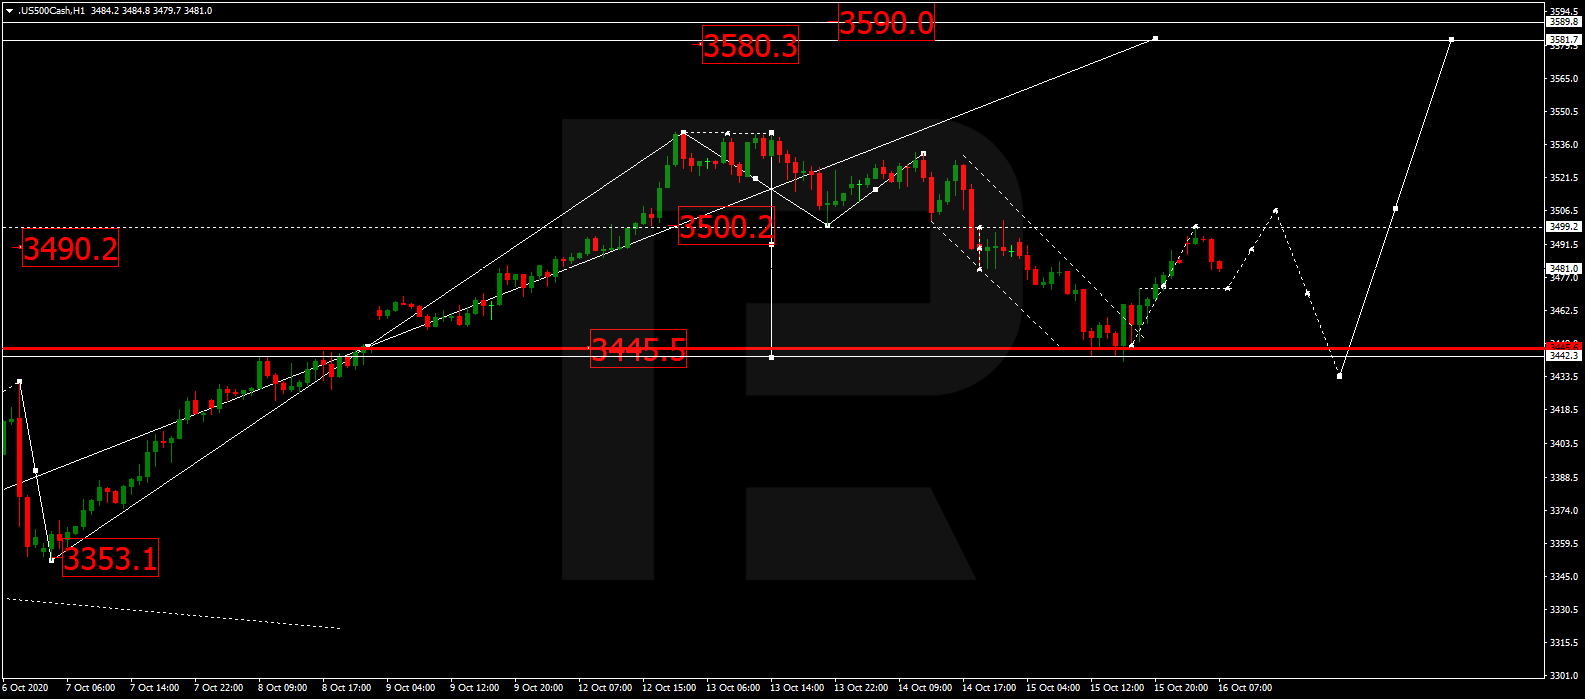
After rebounding from 3430.0 and finishing the descending wave at 3366.0, the S&P index is consolidating near the lows. Possibly, today the asset may break this range to correct towards 3404.0 and then form a new descending structure with the target at 3300.0. However, if the price breaks this range to the downside, the market may resume falling to reach the above-mentioned target without correcting.

S&P 500

Article By RoboForex.com

Attention!
Forecasts presented in this section only reflect the author’s private opinion and should not be considered as guidance for trading. RoboForex LP bears no responsibility for trading results based on trading recommendations described in these analytical reviews.
The Analytical Overview of the Main Currency Pairs on 2020.10.07

by JustForex

The EUR/USD currency pair

Technical indicators of the currency pair:
  • Prev Open: 1.17816
  • Open: 1.17332
  • % chg. over the last day: -0.37
  • Day’s range: 1.17250 – 1.17614
  • 52 wk range: 1.0637 – 1.2012

Yesterday, Donald Trump ordered to end negotiations in the US Congress on a new stimulus package. These events caused a sharp drop in demand for “risky” assets. EUR/USD quotes have updated local lows. The trading instrument found support at the 1.1725 level. The 1.1765 mark is already a “mirror” resistance. A further decline in the EUR/USD currency pair is possible. Today investors will be focused on the FOMC meeting minutes. We recommend paying attention to the comments by the regulator’s representatives. Positions should be opened from key levels.

The news feed on 2020.10.07:
  • – Publication of the FOMC meeting minutes at 21:00 (GMT+3:00).

We also recommend paying attention to the speech by the ECB President.

EUR/USD

Indicators do not give accurate signals: the price has crossed the 50 MA and 100 MA.

The MACD histogram is in the negative zone, but above the signal line, which gives a weak signal to sell EUR/USD.

Stochastic Oscillator has reached the overbought zone, the %K line is above the %D line, which gives a weak signal to buy EUR/USD.

Trading recommendations
  • Support levels: 1.1725, 1.1700, 1.1680
  • Resistance levels: 1.1765, 1.1800, 1.1850

If the price fixes below 1.1725, further correction of EUR/USD quotes is expected. The movement is tending to 1.1690-1.1670.

An alternative could be the growth of the EUR/USD currency pair to 1.1800-1.1830.

The GBP/USD currency pair

Technical indicators of the currency pair:
  • Prev Open: 1.29728
  • Open: 1.28669
  • % chg. over the last day: -0.72
  • Day’s range: 1.28658 – 1.29295
  • 52 wk range: 1.1409 – 1.3516

GBP/USD quotes have been declining. The British pound has updated local lows. At the moment, the key support and resistance levels are 1.2865 and 1.2935, respectively. Financial market participants expect the publication of the FOMC meeting minutes. We recommend following up-to-date information on the Brexit issue. The GBP/USD currency pair has the potential for further correction. Positions should be opened from key levels.

The news feed on the UK economy is calm.

GBP/USD

Indicators do not give accurate signals: the price is testing 50 MA.

The MACD histogram is in the negative zone, but above the signal line, which gives a weak signal to sell GBP/USD.

Stochastic Oscillator is in the overbought zone, the %K line is above the %D line, which gives a weak signal to buy GBP/USD.

Trading recommendations
  • Support levels: 1.2865, 1.2830, 1.2800
  • Resistance levels: 1.2935, 1.3000, 1.3050

If the price fixes below 1.2865, a further fall in the GBP/USD currency pair is expected. The movement is tending to the round level of 1.2800.

An alternative could be the growth of GBP/USD quotes to 1.2980-1.3020.

The USD/CAD currency pair

Technical indicators of the currency pair:
  • Prev Open: 1.32587
  • Open: 1.33047
  • % chg. over the last day: +0.32
  • Day’s range: 1.32872 – 1.33408
  • 52 wk range: 1.2949 – 1.4669

Yesterday, there were aggressive purchases on the USD/CAD currency pair. The growth of quotes exceeded 75 points. The trading instrument has updated local highs. The loonie has recovered most of the losses. USD/CAD quotes are consolidating in the range of 1.3280-1.3310. We recommend paying attention to economic releases from Canada and the US. Positions should be opened from key levels.

At 17:00 (GMT+3:00), Ivey PMI will be published.

USD/CAD

Indicators do not give accurate signals: the price is testing 50 MA.

The MACD histogram is in the positive zone, but below the signal line, which gives a weak signal to buy USD/CAD.

Stochastic Oscillator is in the oversold zone, the %K line has crossed the %D line. There are no signals at the moment.

Trading recommendations
  • Support levels: 1.3280, 1.3245, 1.3200
  • Resistance levels: 1.3310, 1.3340, 1.3355

If the price fixes below 1.3280, USD/CAD quotes are expected to fall. The movement is tending to 1.3250-1.3220.

An alternative could be the growth of the USD/CAD currency pair to 1.3340-1.3360.

The USD/JPY currency pair

Technical indicators of the currency pair:
  • Prev Open: 105.714
  • Open: 105.609
  • % chg. over the last day: -0.09
  • Day’s range: 105.594 – 105.970
  • 52 wk range: 101.19 – 112.41

The USD/JPY currency pair shows a positive trend. The trading instrument has overcome and fixed above the key extremes. The round level of 106.00 is the nearest resistance. The 105.80 mark is already a “mirror” support. Further growth of USD/JPY quotes is possible. Today, we recommend paying attention to the publication of the FOMC meeting minutes. Positions should be opened from key levels.

The news feed on Japan’s economy is quite calm.

USD/JPY

Indicators signal the power of buyers: the price has fixed above 50 MA and 100 MA.

The MACD histogram is in the positive zone, which gives a signal to buy USD/JPY.

Stochastic Oscillator is located near the overbought zone, the %K line has crossed the %D line. There are no signals at the moment.

Trading recommendations
  • Support levels: 105.80, 105.55, 105.40
  • Resistance levels: 106.00, 106.50

If the price fixes above the level of 106.00, further growth of USD/JPY quotes is expected. The movement is tending to 106.30-106.50.

An alternative could be a decline in the USD/JPY currency pair to 105.60-105.40.

by JustForex


This article reflects a personal opinion and should not be interpreted as an investment advice, and/or offer, and/or a persistent request for carrying out financial transactions, and/or a guarantee, and/or a forecast of future events.

Ichimoku Cloud Analysis 06.10.2020 (EURGBP, AUDUSD, GBPCHF)

Article By RoboForex.com

EURGBP, “Euro vs Great Britain Pound”

EURGBP is trading at 0.9070; the instrument is moving below Ichimoku Cloud, thus indicating a descending tendency. The markets could indicate that the price may test the cloud’s downside border at 0.9005 and then resume moving downwards to reach 0.8915. Another signal in favor of further downtrend will be a rebound from the descending channel’s upside border. However, the bearish scenario may be canceled if the price breaks the cloud’s upside border and fixes above 0.9145. In this case, the pair may continue growing towards 0.9235. To confirm further decline, the asset must break the downside border of the Triangle pattern and fix below 0.9020.

EURGBP
Risk Warning: the result of previous trading operations do not guarantee the same results in the future

AUDUSD, “Australian Dollar vs US Dollar”

AUDUSD is trading at 0.7164; the instrument is moving inside Ichimoku Cloud, thus indicating a sideways tendency. The markets could indicate that the price may test the cloud’s upside border at 0.7170 and then resume moving downwards to reach 0.6995. Another signal in favor of further downtrend will be a rebound from the resistance level. However, the bearish scenario may no longer be valid if the price breaks the cloud’s upside border and fixes above 0.7205. In this case, the pair may continue growing towards 0.7295. To confirm further decline, the asset must break the support area and fix below 0.7105, thus completing a Double Top reversal pattern.

AUDUSD
Risk Warning: the result of previous trading operations do not guarantee the same results in the future

GBPCHF, “Great Britain Pound vs Swiss Franc”

GBPCHF is trading at 1.1878; the instrument is moving above Ichimoku Cloud, thus indicating an ascending tendency. The markets could indicate that the price may test the cloud’s upside border at 1.1870 and then resume moving upwards to reach 1.2115. Another signal in favor of further uptrend will be a rebound from the rising channel’s downside border. However, the bullish scenario may no longer be valid if the price breaks the cloud’s downside border and fixes below 1.1765. In this case, the pair may continue falling towards 1.1675.

GBPCHF

Article By RoboForex.com

Attention!
Forecasts presented in this section only reflect the author’s private opinion and should not be considered as guidance for trading. RoboForex LP bears no responsibility for trading results based on trading recommendations described in these analytical reviews.
Japanese Candlesticks Analysis 06.10.2020 (GOLD, NZDUSD, GBPUSD)

Article By RoboForex.com

XAUUSD, “Gold vs US Dollar”

As we can see in the H4 chart, the rising tendency continues. After finishing a Harami pattern close to the resistance level, XAUUSD is reversing. The correctional target may be the support area at 1888.00. At the same time, an opposite scenario implies that the price may form another ascending impulse with the target at 1945.00 without reversing and correcting.

XAUUSD
Risk Warning: the result of previous trading operations do not guarantee the same results in the future

NZDUSD, “New Zealand vs. US Dollar”

As we can see in the H4 chart, the rising impulse continues. After forming several reversal patterns, such as Harami, close to the horizontal support level, NZDUSD may reverse and form a slight correction. After the pullback, the next upside target may be the channel’s upside border at 0.6727. Still, an alternative scenario says that the pair may continue trading downwards to reach the support level at 0.6580.

NZDUSD
Risk Warning: the result of previous trading operations do not guarantee the same results in the future

GBPUSD, “Great Britain Pound vs US Dollar”

As we can see in the H4 chart, the uptrend continues. By now, GBPUSD has formed several reversal patterns, such as Engulfing, not far from the support area. At the moment, the pair is still reversing and may later reach the target at 1.3135. However, there might be another scenario, according to which the price may start a new pullback towards 1.2930 before resuming its growth.

GBPUSD

Article By RoboForex.com

Attention!
Forecasts presented in this section only reflect the author’s private opinion and should not be considered as guidance for trading. RoboForex LP bears no responsibility for trading results based on trading recommendations described in these analytical reviews.