Archive for Forex and Currency News – Page 356

Week in review: US debate disaster, Trump infected, NFP mixed

By Lukman Otunuga, Research Analyst, ForexTime

Words fails to describe the shocking string of events this week!

From global coronavirus cases topping 34 million, to a chaotic presidential debate, EU launching legal actions against the UK and Donald Trump being tested positive for COVID-19. The past few weeks have been wild, surreal and just plain unpredictable with the cocktail of themes placing investors on an emotional rollercoaster ride.

It is just interesting how the risk sentiment pendulum has swung between two extremes this week. On Monday, China’s continued recovery boosted global sentiment and elevated equities across the world!

In the currency markets, the British Pound had 99 problems but negative rates weren’t one after BoE deputy governor Dave Ramsden brushed aside talks of going subzero. After appreciating against every single G10 currency, Sterling was later dragged back to reality after the European Union launched legal action against the United Kingdom over plans to violate last year’s Brexit withdrawal agreement.

Market players hoping for fresh clarity on US policies from President Trump and Democrat rival Joe Biden were disappointed as the debate turned into a fierce verbal cage match. Not only did the debate fail to yield a clear winner but it even ramped up fears over a potentially delayed outcome to the 2020 presidential election.

The mood across markets turned cautious mid-week following the raucous presidential debate with investors redirecting their attention back towards key economic reports.

As the final quarter of 2020 kicked off, we identified a couple of key risk events ranging from the US presidential elections, Brexit related drama and developments surround the global pandemic.

On the fiscal front, optimism returned over the Administration and Democrats bridging the gap between their respective $1.62trn and $2.2trln new stimulus offers.

It was all about the US jobs report on Friday…..until a wave of risk aversion swept through market following reports that US President Donald Trump First Lady Melania Trump have both tested positive for Covid-19. This development adds another element of uncertainty into the equation and questions the likelihood of the next presidential debate in two weeks taking place.

To end the week, the highly anticipated US jobs report was a mixed bag. Nonfarm payrolls rose by 661,00 in September compared to the 800,000 estimates while unemployment rate beat forecast by dropping 7.9%, better than the 8.2% projection. Although the pace of job growth slowed in September, the disappointment was slightly countered by an upward revision of the August reading. Given how this is the final jobs report before the November election, it may set the tone for the next few weeks.

Dollar unfazed by NFP

There is just something about the 94.00 level on the Dollar Index (DXY). Dollar bulls were missing in action this week despite the shocking developments that rocked financial markets. Looking at the technicals, sustained weakness below 94.00 could open the doors towards 92.70 and 92.00.

Japanese Yen boosted by risk-off mood

As risk aversion engulfed financial markets, investors rushed towards the Japanese Yen which appreciated every single G10 currency. Looking at the USDJPY, a weekly close below 105.250 could trigger a decline towards 104.80 and possibly 104.00.

GBPUSD remains in wide range

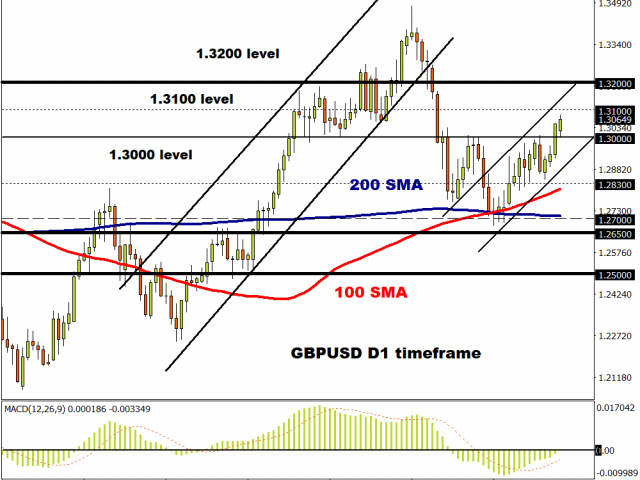
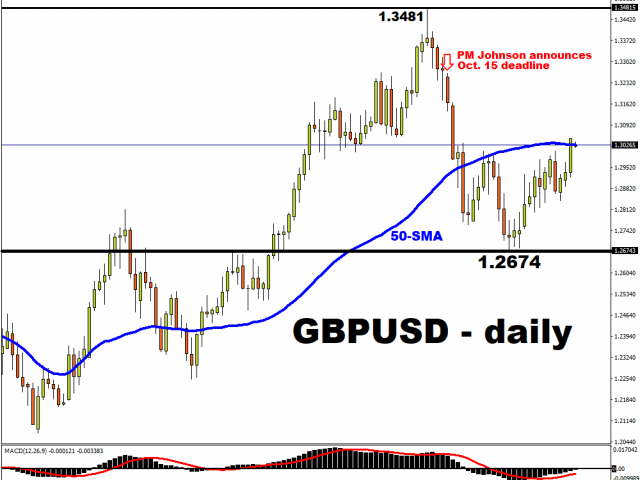
A classic breakout/down setup is in play on the GBPUSD with support around 1.2650 and resistance around 1.3000. If the Brexit uncertainty haunts investor attraction towards Sterling in the week ahead, prices may slip back towards 1.2750. Alternatively, a breakout above 1.3000 could open the doors towards 1.3100 and 1.3200, respectively.

Gold balances above $1900

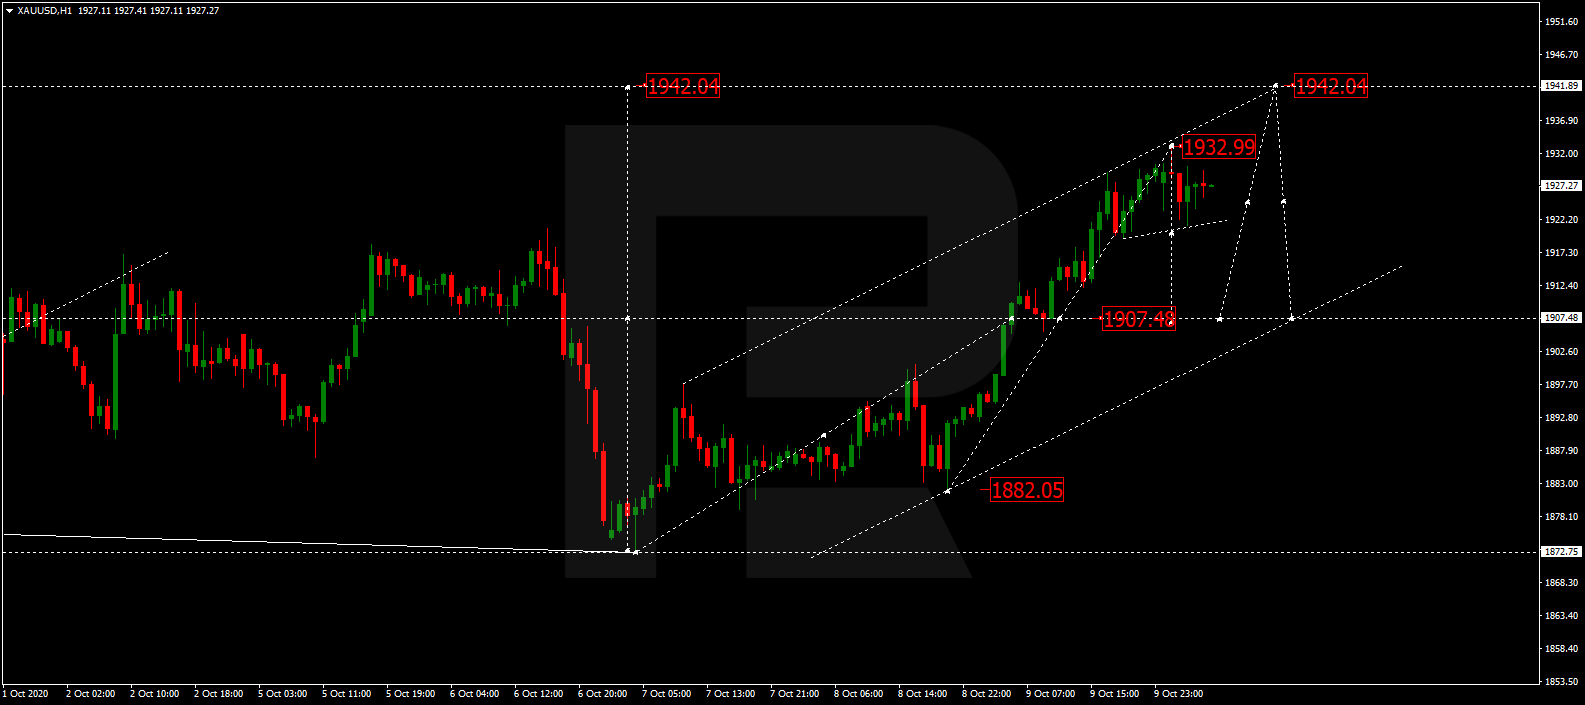
Gold is route to concluding the week slightly higher as risk aversion grips markets. A weekly close above $1900 may open the doors towards $1930 and $1965, respectively. Should $1900 prove to be unreliable support, the next key level of interest will be found around $1865.

Disclaimer: The content in this article comprises personal opinions and should not be construed as containing personal and/or other investment advice and/or an offer of and/or solicitation for any transactions in financial instruments and/or a guarantee and/or prediction of future performance. ForexTime (FXTM), its affiliates, agents, directors, officers or employees do not guarantee the accuracy, validity, timeliness or completeness, of any information or data made available and assume no liability as to any loss arising from any investment based on the same.


Forex-Time-LogoArticle by ForexTime

ForexTime Ltd (FXTM) is an award winning international online forex broker regulated by CySEC 185/12 www.forextime.com

Ichimoku Cloud Analysis 02.10.2020 (AUDUSD, USDCAD, GBPCAD)

Article By RoboForex.com

AUDUSD, “Australian Dollar vs US Dollar”

AUDUSD is trading at 0.7141; the instrument is moving inside Ichimoku Cloud, thus indicating a sideways tendency. The markets could indicate that the price may test the cloud’s upside border at 0.7155 and then resume moving downwards to reach 0.6965. Another signal in favor of further downtrend will be a rebound from the resistance level. However, the bearish scenario may no longer be valid if the price breaks the cloud’s upside border and fixes above 0.7230. In this case, the pair may continue growing towards 0.7325. To confirm further decline, the asset must break the cloud’s downside border and fix below 0.7045.

AUDUSD
Risk Warning: the result of previous trading operations do not guarantee the same results in the future

USDCAD, “US Dollar vs Canadian Dollar”

USDCAD is trading at 1.3324; the instrument is moving inside Ichimoku Cloud, thus indicating a sideways tendency. The markets could indicate that the price may test the cloud’s downside border at 1.3290 and then resume moving upwards to reach 1.3505. Another signal in favor of further uptrend will be a rebound from the rising channel’s downside border. However, the bullish scenario may no longer be valid if the price breaks the cloud’s downside border and fixes below 1.3240. In this case, the pair may continue falling towards 1.3235. To confirm further growth, the asset must break the cloud’s upside border and fix above 1.3405.

USDCAD
Risk Warning: the result of previous trading operations do not guarantee the same results in the future

GBPCAD, “Great Britain Pound vs Canadian Dollar”

GBPCAD is trading at 1.7148; the instrument is moving above Ichimoku Cloud, thus indicating an ascending tendency. The markets could indicate that the price may test the cloud’s downside border at 1.7080 and then resume moving upwards to reach 1.7405. Another signal in favor of further uptrend will be a rebound from the rising channel’s downside border. However, the bullish scenario may no longer be valid if the price breaks the cloud’s downside border and fixes below 1.7010. In this case, the pair may continue falling towards 1.6915.

GBPCAD

Article By RoboForex.com

Attention!
Forecasts presented in this section only reflect the author’s private opinion and should not be considered as guidance for trading. RoboForex LP bears no responsibility for trading results based on trading recommendations described in these analytical reviews.

The Analytical Overview of the Main Currency Pairs on 2020.10.02

by JustForex

The EUR/USD currency pair

Technical indicators of the currency pair:
  • Prev Open: 1.17197
  • Open: 1.17434
  • % chg. over the last day: +0.25
  • Day’s range: 1.16957 – 1.17477
  • 52 wk range: 1.0637 – 1.2012

There is an ambiguous technical pattern on the EUR/USD currency pair. The trading instrument is consolidating. Investors have taken a wait-and-see attitude before the publication of the US labor market report for September. Experts forecast the deterioration of key indicators. We recommend paying attention to the difference between the actual and forecasted values. Positions should be opened from key levels.

The news feed on 2020.10.02:
  • – Consumer price index in the Eurozone at 12:00 (GMT+3:00);
  • – Report on the US labor market at 15:30 (GMT+3:00).
EUR/USD

Indicators do not give accurate signals: the price has crossed the 50 MA.

The MACD histogram is near the 0 mark. There are no signals at the moment.

Stochastic Oscillator is in the neutral zone, the %K line is above the %D line, which gives a signal to buy EUR/USD.

Trading recommendations
  • Support levels: 1.1700, 1.1680, 1.1640
  • Resistance levels: 1.1740, 1.1770, 1.1800

If the price fixes above 1.1740, further growth of EUR/USD quotes is expected. The movement is tending to 1.1770-1.1800.

An alternative could be a decline in the EUR/USD currency pair to 1.1670-1.1650.

The GBP/USD currency pair

Technical indicators of the currency pair:
  • Prev Open: 1.29142
  • Open: 1.28780
  • % chg. over the last day: -0.21
  • Day’s range: 1.28373 – 1.29407
  • 52 wk range: 1.1409 – 1.3516

Trades on the GBP/USD currency pair are still very active. At the same time, there is no defined trend. At the moment, the local support and resistance levels are 1.2870 and 1.2940, respectively. The British pound is tending to grow. Today, financial market participants will be focused on the US labor market report for September. Positions should be opened from key levels.

The news feed on the UK economy is calm.

GBP/USD

Indicators do not give accurate signals: the price is consolidating near 50 MA and 100 MA.

The MACD histogram is near the 0 mark. There are no signals at the moment.

Stochastic Oscillator is in the neutral zone, the %K line is above the %D line, which gives a signal to buy GBP/USD.

Trading recommendations
  • Support levels: 1.2870, 1.2830, 1.2800
  • Resistance levels: 1.2940, 1.2975, 1.3000

If the price fixes above 1.2940, further growth of the GBP/USD currency pair is expected. The movement is tending to the round level of 1.3000.

An alternative could be a drop in GBP/USD quotes to 1.2830-1.2800.

The USD/CAD currency pair

Technical indicators of the currency pair:
  • Prev Open: 1.33177
  • Open: 1.32883
  • % chg. over the last day: -0.24
  • Day’s range: 1.32739 – 1.33289
  • 52 wk range: 1.2949 – 1.4669

USD/CAD quotes have become stable after a sharp drop the day before. At the moment, the loonie is consolidating. Local support and resistance levels are 1.3295 and 1.3330, respectively. The USD/CAD currency pair has the potential for further decline. Today, we recommend paying attention to economic releases from the US, as well as to the dynamics of “black gold” prices. Positions should be opened from key levels.

Today, the news feed on Canada’s economy is calm.

USD/CAD

Indicators do not give accurate signals: the price has crossed the 50 MA.

The MACD histogram is near the 0 mark. There are no signals at the moment.

Stochastic Oscillator is in the neutral zone, the %K line is below the %D line, which gives a signal to sell USD/CAD.

Trading recommendations
  • Support levels: 1.3295, 1.3270, 1.3240
  • Resistance levels: 1.3330, 1.3355, 1.3375

If the price fixes below 1.3295, a further fall in USD/CAD quotes is expected. The movement is tending to 1.3270-1.3240.

An alternative could be the growth of the USD/CAD currency pair to 1.3355-1.3380.

The USD/JPY currency pair

Technical indicators of the currency pair:
  • Prev Open: 105.466
  • Open: 105.530
  • % chg. over the last day: +0.05
  • Day’s range: 104.942 – 105.667
  • 52 wk range: 101.19 – 112.41

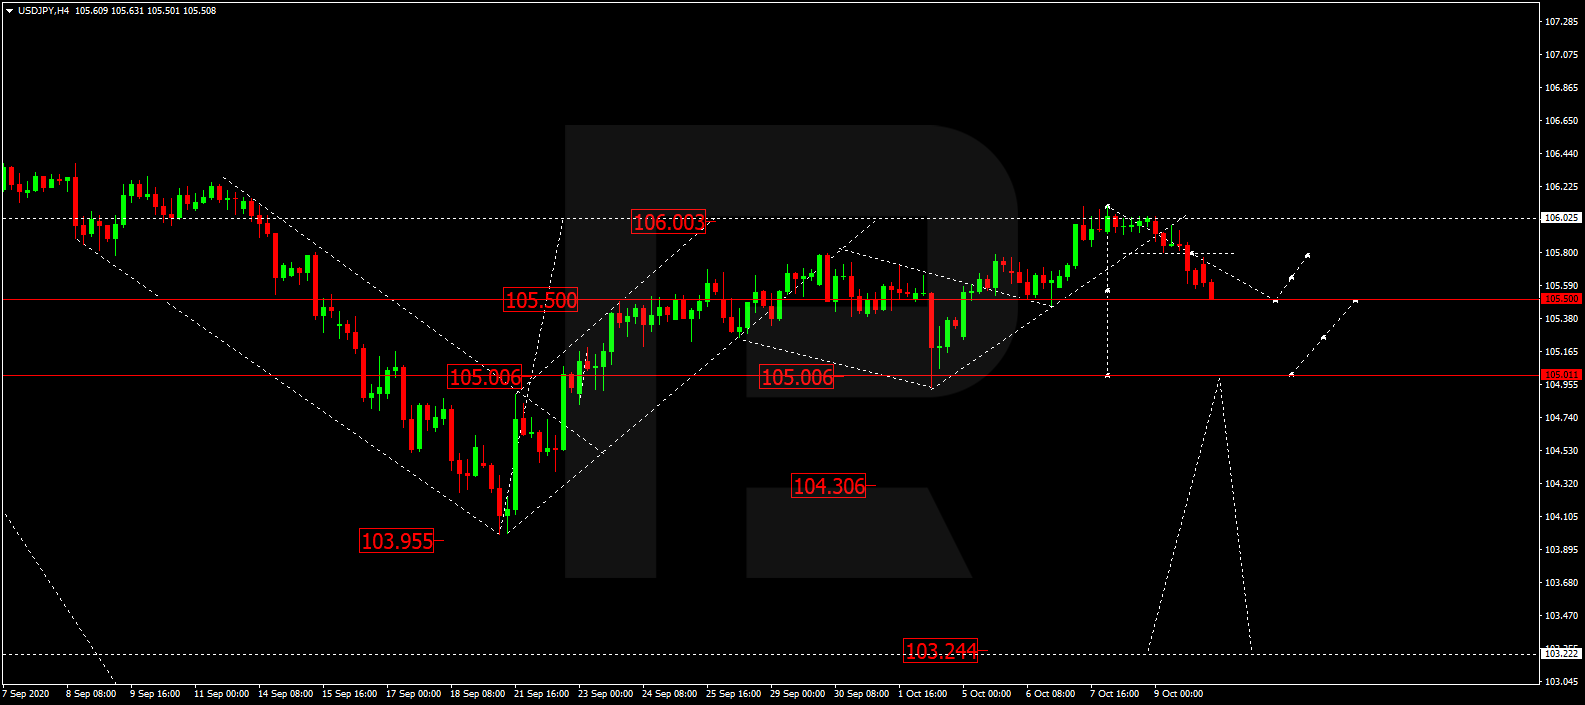
The USD/JPY currency pair has been declining after a prolonged consolidation. During the Asian trading session, the drop in quotes has exceeded 50 points. The trading instrument has updated local lows. At the moment, the “safe haven” currency is consolidating in the range of 104.95-105.25. USD/JPY quotes have the potential for further decline. Today, we recommend paying attention to economic releases, as well as to the dynamics of US government bonds yield. Positions should be opened from key levels.

USD/JPY

Indicators signal the power of sellers: the price has fixed below 50 MA and 100 MA.

The MACD histogram is in the negative zone, which indicates the bearish sentiment.

Stochastic Oscillator is in the neutral zone, the %K line has crossed the %D line. There are no signals at the moment.

Trading recommendations
  • Support levels: 104.95, 104.70, 104.40
  • Resistance levels: 105.25, 105.40, 105.65

If the price fixes below 104.95, a further fall in USD/JPY quotes is expected. The movement is tending to 104.70-104.40.

An alternative could be the growth of the USD/JPY currency pair to 105.50-105.80.

by JustForex


This article reflects a personal opinion and should not be interpreted as an investment advice, and/or offer, and/or a persistent request for carrying out financial transactions, and/or a guarantee, and/or a forecast of future events.

NFPs on Friday in focus: will EURUSD see 1.1800 into the weekly close?

By Admiral Markets

Economic Events October 02, 2020

Source: Economic Events October 02, 2020 – Admiral Markets’ Forex Calendar

Compared to last week, the overall picture in EURUSD hasn’t significantly changed over the last several days.

With a drop below 1.1700 the short-term forecast remains short and this could change only if we see a push to above 1.2000.

We are still favouring a stint to below 1.1600 with the currency pair testing the region around a potential mid-term long-trigger at 1.1450/1500.

However, the US-Dollar could see heavier continued selling pressure into the weekly close, which could help Euro bulls achieve a weekly close substantially above 1.1700. This would serve as one of the first signs that the short-term USD correction might be over.

Here are some key points to consider

  • On Tuesday, inflation data from Germany showed a deflationary tendency coming in at -0.2% (YoY)
  • This has been the largest decline since January 2015 and is below market expectations of -0.1%
  • The ECB finds itself in a dilemma, currently (while the USD is kept under pressure from the FED, the ECB is running out of ammunition to weaken the European currency to help weaker EU economies like Italy and Spain, which has resulted in a relatively strong Euro compared to the US-Dollar).

If today’s US Non-Farm Payrolls disappoint, here is what we are considering:

  • This would force the US central bank FED to balloon its balance sheet again significantly beyond the 7 trillion USD mark
  • This seems more likely when we consider recent comments from FED chairman Powell in front of the US Congress last week when he said the central bank is committed to helping the economy and that the FED will continue to provide support “for as long as it takes”
  • What also seems likely is that the FED will deliver liquidity to smaller-sized corporations, which could take the USD down, thus giving a boost to EURUSD.

With that in mind, we see the target for the upcoming 6 – 12 months remaining untouched at around 1.2500:

Admiral Markets MT5 with MT5SE Add-on EURUSD Daily chart

Source: Admiral Markets MT5 with MT5SE Add-on EURUSD Daily chart (between June 26, 2019, to October 01, 2020). Accessed: October 01, 2020, at 10:00 PM GMT. Please note: Past performance is not a reliable indicator of future results, or future performance.

In 2015, the value of the EURUSD fell by 10.2%, in 2016, it fell by 3.2%, in 2017, it increased by 13.92%, 2018, it fell by 4.4%, 2019, it fell by 2.2%, meaning that in five years, it was down by 7.3%.

Discover the world’s #1 multi-asset platform

Admiral Markets offers professional traders the ability to trade with MetaTrader 5, allowing you to experience trading at a significantly higher, more rewarding level than with MetaTrader 4. Experience benefits such as the addition of the Market Heat Map, so you can compare various currency pairs to see which ones might be lucrative investments, access real-time trading data, and so much more. Click the banner below to start your FREE download of MT5!

Trade With MetaTrader 5

Disclaimer: The given data provides additional information regarding all analysis, estimates, prognosis, forecasts or other similar assessments or information (hereinafter “Analysis”) published on the website of Admiral Markets. Before making any investment decisions please pay close attention to the following:

  1. This is a marketing communication. The analysis is published for informative purposes only and is in no way to be construed as investment advice or recommendation. It has not been prepared in accordance with legal requirements designed to promote the independence of investment research, and that it is not subject to any prohibition on dealing ahead of the dissemination of investment research.
  2. Any investment decision is made by each client alone whereas Admiral Markets shall not be responsible for any loss or damage arising from any such decision, whether or not based on the Analysis.
  3. Each of the Analysis is prepared by an independent analyst (Jens Klatt, Professional Trader and Analyst, hereinafter “Author”) based on the Author’s personal estimations.
  4. To ensure that the interests of the clients would be protected and objectivity of the Analysis would not be damaged Admiral Markets has established relevant internal procedures for prevention and management of conflicts of interest.
  5. Whilst every reasonable effort is taken to ensure that all sources of the Analysis are reliable and that all information is presented, as much as possible, in an understandable, timely, precise and complete manner, Admiral Markets does not guarantee the accuracy or completeness of any information contained within the Analysis. The presented figures that refer to any past performance is not a reliable indicator of future results.
  6. The contents of the Analysis should not be construed as an express or implied promise, guarantee or implication by Admiral Markets that the client shall profit from the strategies therein or that losses in connection therewith may or shall be limited.
  7. Any kind of previous or modelled performance of financial instruments indicated within the Publication should not be construed as an express or implied promise, guarantee or implication by Admiral Markets for any future performance. The value of the financial instrument may both increase and decrease and the preservation of the asset value is not guaranteed.
  8. The projections included in the Analysis may be subject to additional fees, taxes or other charges, depending on the subject of the Publication. The price list applicable to the services provided by Admiral Markets is publicly available from the website of Admiral Markets.
  9. Leveraged products (including contracts for difference) are speculative in nature and may result in losses or profit. Before you start trading, you should make sure that you understand all the risks.

By Admiral Markets

Only $600mn Apart

By Lukman Otunuga, Research Analyst, ForexTime

After yesterday’s day of indecision and the printing of a ‘doji’ candlestick, the S&P500 has opened up strongly and is trying to climb beyond Wednesday’s high. Tech seems to be leading the way with the Nasdaq looking like it might be breaking out from resistance around 11,500.

Key once again is the likelihood on whether the Administration and Democrats can bridge the gap between their respective $1.62trn and $2.2trln new stimulus offers, and then ultimately if any agreement can make its way through Congress. Failure to do so really does mean the US will not receive the fiscal boost it needs until after the November election.

The Dollar is starting the new month modestly on the back foot, with today’s price action reinforcing its broader performance to an extent. Risk mood is generally positive with major bond markets softer and the US 30-year Treasury closing in on 1.5%. US initial jobless claims released before the open drifted lower than expected last week and the continuing claims declined as well. That said, the former is still above the 665,000 peak during the 2008 Great Financial Crisis, even if filings have dropped from the record 6.687mn at the end of March.

Brexit Headline Havoc

It’s been a typical rollercoaster ride of Brexit headlines today with both positive and more downbeat sources on the wires concerning the last two negotiating issues on state aid and fishing rights. The EU said they will begin legal proceedings over the UK’s Internal Market Bill just to rachet up any forgotten tensions! A letter of ‘formal notice’ to UK means they will have a month to respond, though Boris’ informal deadline for negotiations comes before that in mid-October.

Cable’s 3.5% drop last month looks to be continuing today with the 55-day Moving Average again capping the upside. Losses need to make their way past 1.28 to have any chance of pushing further south, otherwise the pair may see range trading in the next few sessions.

Gold toying with $1900

The shiny one has been on the sidelines in recent weeks after all-time highs made back in August. It’s trying its best to conclusively break above the psychological $1900 barrier but like the last two days, it’s finding it a struggle. Where the Dollar goes, so gold normally travels in the other direction, which means the new stimulus package and risk sentiment are key for near-term direction.

The 100-day Moving Average around $1852 supported prices very well last week, while the stubborn $1900 level needs to be beaten before Gold can challenge the 55-Day MA at $1937.

Disclaimer: The content in this article comprises personal opinions and should not be construed as containing personal and/or other investment advice and/or an offer of and/or solicitation for any transactions in financial instruments and/or a guarantee and/or prediction of future performance. ForexTime (FXTM), its affiliates, agents, directors, officers or employees do not guarantee the accuracy, validity, timeliness or completeness, of any information or data made available and assume no liability as to any loss arising from any investment based on the same.


Forex-Time-LogoArticle by ForexTime

ForexTime Ltd (FXTM) is an award winning international online forex broker regulated by CySEC 185/12 www.forextime.com

Japanese Candlesticks Analysis 01.10.2020 (GOLD, NZDUSD, GBPUSD)

Article By RoboForex.com

XAUUSD, “Gold vs US Dollar”

As we can see in the H4 chart, the pair is still rebounding from the channel’s downside border. Right now, after forming an Inverted Hammer pattern, XAUUSD is reversing. The next upside target is at 1930.00. At the same time, an opposite scenario implies that the price may form another descending impulse with the target at 1850.00.

XAUUSD
Risk Warning: the result of previous trading operations do not guarantee the same results in the future

NZDUSD, “New Zealand vs. US Dollar”

As we can see in the H4 chart, the rising impulse continues. After forming several reversal patterns, such as Engulfing, close to the horizontal support level, NZDUSD is reversing. The next upside target may be the channel’s upside border at 0.6725. Still, an alternative scenario says that the pair may continue trading downwards to reach the support level at 0.6516.

NZDUSD
Risk Warning: the result of previous trading operations do not guarantee the same results in the future

GBPUSD, “Great Britain Pound vs US Dollar”

As we can see in the H4 chart, the uptrend continues. By now, GBPUSD has formed several reversal patterns, such as Hammer, not far from the support area. At the moment, the pair is reversing and may later reach the target at 1.3165. However, there might be another scenario, according to which the price may start a new pullback towards 1.2752.

GBPUSD

Article By RoboForex.com

Attention!
Forecasts presented in this section only reflect the author’s private opinion and should not be considered as guidance for trading. RoboForex LP bears no responsibility for trading results based on trading recommendations described in these analytical reviews.

Ichimoku Cloud Analysis 01.10.2020 (XAUUSD, BRENT, GBPUSD)

Article By RoboForex.com

XAUUSD, “Gold vs US Dollar”

XAUUSD is trading at 1893.00; the instrument is moving inside Ichimoku Cloud, thus indicating a sideways tendency. The markets could indicate that the price may test the cloud’s upside border at 1905.00 and then resume moving downwards to reach 1820.00. Another signal in favor of further downtrend will be a rebound from the descending channel’s upside border. However, the bearish scenario may no longer be valid if the price breaks the cloud’s upside border and fixes above 1925.00. In this case, the pair may continue growing towards 1945.00. To confirm further decline, the asset must break the rising channel’s downside border and fix below 1860.00.

XAUUSD
Risk Warning: the result of previous trading operations do not guarantee the same results in the future

BRENT

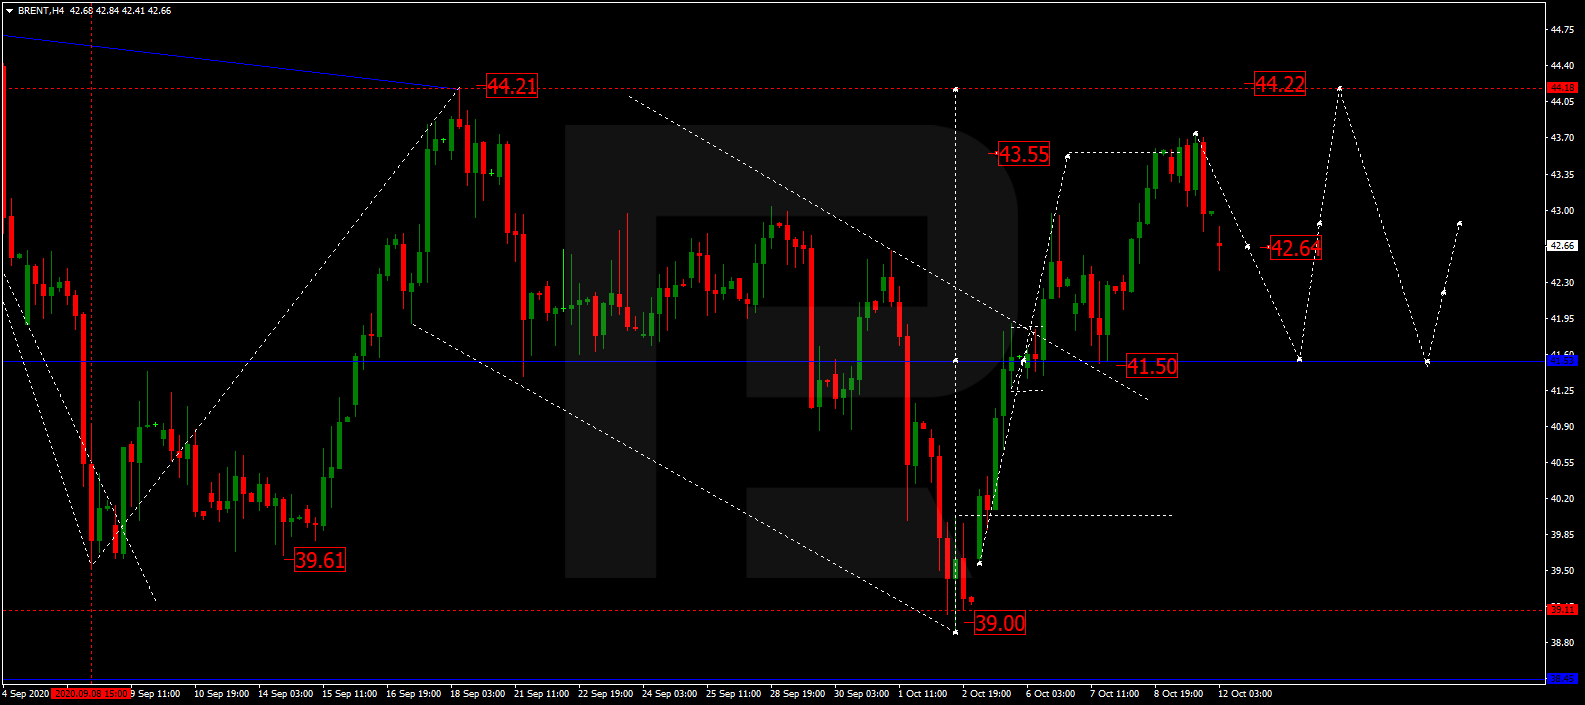
Brent is trading at 42.58; the instrument is moving above Ichimoku Cloud, thus indicating an ascending tendency. The markets could indicate that the price may test at the cloud’s downside border 41.95 and then resume moving upwards to reach 45.65. Another signal in favor of further uptrend will be a rebound from the support level. However, the bullish scenario may no longer be valid if the price breaks the cloud’s downside border and fixes below 40.85. In this case, the pair may continue falling towards 39.05. To confirm further growth, the asset must break the neckline of a Head & Shoulders reversal pattern and fix above 43.55.

BRENT
Risk Warning: the result of previous trading operations do not guarantee the same results in the future

GBPUSD, “Great Britain Pound vs US Dollar”

GBPUSD is trading at 1.2942; the instrument is moving above Ichimoku Cloud, thus indicating an ascending tendency. The markets could indicate that the price may test Tenkan-Sen and Kijun-Sen at 1.2910 and then resume moving upwards to reach 1.3195. Another signal in favor of further uptrend will be a rebound from the descending channel’s upside border. However, the bullish scenario may no longer be valid if the price breaks the cloud’s downside border and fixes below 1.2735. In this case, the pair may continue falling towards 1.2645. To confirm further growth, the asset must break the resistance area and fix above 1.3045, thus completing a Double Bottom reversal pattern.

GBPUSD

Article By RoboForex.com

Attention!
Forecasts presented in this section only reflect the author’s private opinion and should not be considered as guidance for trading. RoboForex LP bears no responsibility for trading results based on trading recommendations described in these analytical reviews.

The Analytical Overview of the Main Currency Pairs on 2020.10.01

by JustForex

The EUR/USD currency pair

Technical indicators of the currency pair:
  • Prev Open: 1.17424
  • Open: 1.17197
  • % chg. over the last day: -0.20
  • Day’s range: 1.17172 – 1.17575
  • 52 wk range: 1.0637 – 1.2012

Trading activity and volatility on currency majors are still high. At the moment, the technical pattern on the EUR/USD currency pair is ambiguous. The trading instrument is consolidating. Local support and resistance levels are 1.1715 and 1.1755, respectively. Investors continue to monitor talks in the US Congress on a new stimulus package. Today, we expect important economic releases. Positions should be opened from key levels.

The news feed on 2020.10.01:
  • – German manufacturing PMI at 10:55 (GMT+3:00);
  • – Initial jobless claims in the US at 15:30 (GMT+3:00);
  • – Personal spending in the US at 15:30 (GMT+3:00);
  • – ISM manufacturing PMI at 17:00 (GMT+3:00).
EUR/USD

Indicators do not give accurate signals: the price is testing 50 MA.

The MACD histogram is in the positive zone, which indicates the bullish sentiment.

Stochastic Oscillator is in the overbought zone, the %K line has crossed the %D line. There are no signals at the moment.

Trading recommendations
  • Support levels: 1.1715, 1.1685, 1.1640
  • Resistance levels: 1.1755, 1.1775, 1.1800

If the price fixes above 1.1755, further growth in EUR/USD quotes is expected. The movement is tending to the round level of 1.1800.

An alternative could be a decrease in the EUR/USD currency pair to 1.1685-1.1660.

The GBP/USD currency pair

Technical indicators of the currency pair:
  • Prev Open: 1.28557
  • Open: 1.29142
  • % chg. over the last day: +0.43
  • Day’s range: 1.28734 – 1.29502
  • 52 wk range: 1.1409 – 1.3516

In the last sessions, trades on the GBP/USD currency pair are very active. At the same time, there is no defined trend. At the moment, the local support and resistance levels are 1.2870 and 1.2920, respectively. The British pound is tending to recover. We recommend following up-to-date information regarding the Brexit negotiations. Positions should be opened from key levels.

At 11:30 (GMT+3:00), the UK Manufacturing PMI will be published.

GBP/USD

Indicators do not give accurate signals: the price is testing 50 MA.

The MACD histogram is in the positive zone, which indicates the development of bullish sentiment.

Stochastic Oscillator is in the neutral zone, the %K line is below the %D line, which gives a signal to sell GBP/USD.

Trading recommendations
  • Support levels: 1.2870, 1.2830, 1.2800
  • Resistance levels: 1.2920, 1.2950, 1.3000

If the price fixes above 1.2920, further growth of the GBP/USD currency pair is expected. The movement is tending to 1.2950-1.3000.

An alternative could be a drop in GBP/USD quotes to 1.2830-1.2800.

The USD/CAD currency pair

Technical indicators of the currency pair:
  • Prev Open: 1.33859
  • Open: 1.33177
  • % chg. over the last day: -0.51
  • Day’s range: 1.32797 – 1.33226
  • 52 wk range: 1.2949 – 1.4669

USD/CAD quotes have been declining. During yesterday’s and today’s trading sessions, Canadian dollar added more than 100 points in price against the greenback. The USD/CAD currency pair has set new local lows. At the moment, the loonie is consolidating in the range of 1.3280-1.3330. USD/CAD quotes have the potential for further decline. We recommend paying attention to the dynamics of “black gold” prices. Positions should be opened from key levels.

Today, the news feed on Canada’s economy is quite calm.

USD/CAD

Indicators signal the power of sellers: the price has fixed below 50 MA and 100 MA.

The MACD histogram is in the negative zone, which indicates the bearish sentiment.

Stochastic Oscillator is in the neutral zone, the %K line is above the %D line, which gives a signal to buy USD/CAD.

Trading recommendations
  • Support levels: 1.3280, 1.3235, 1.3200
  • Resistance levels: 1.3330, 1.3355, 1.3375

If the price fixes below 1.3280, a further drop in USD/CAD quotes is expected. The movement is tending to 1.3240-1.3220.

An alternative could be the growth of the USD/CAD currency pair to 1.3355-1.3380.

The USD/JPY currency pair

Technical indicators of the currency pair:
  • Prev Open: 105.621
  • Open: 105.466
  • % chg. over the last day: -0.18
  • Day’s range: 105.403 – 105.585
  • 52 wk range: 101.19 – 112.41

The USD/JPY currency pair is still being traded in flat. The technical pattern remains ambiguous. The key support and resistance levels are 105.40 and 105.80, respectively. Investors expect additional drivers. Today, we recommend paying attention to economic releases, as well as to the dynamics of US government bonds yield. Positions should be opened from key levels.

USD/JPY

Indicators do not give accurate signals: the price has crossed the 50 MA and 100 MA.

The MACD histogram is near the 0 mark.

Stochastic Oscillator is in the neutral zone, the %K line is above the %D line, which gives a signal to buy USD/JPY.

Trading recommendations
  • Support levels: 105.40, 105.20, 104.85
  • Resistance levels: 105.80, 106.00

If the price fixes above the level of 105.80, further growth of USD/JPY quotes is expected. The movement is tending to 106.10-106.40.

An alternative could be a decline in the USD/JPY currency pair to 105.20-104.90.

by JustForex


This article reflects a personal opinion and should not be interpreted as an investment advice, and/or offer, and/or a persistent request for carrying out financial transactions, and/or a guarantee, and/or a forecast of future events.

USD weaker even as Congress prepares new stimulus bill

By Orbex

EURUSD Challenges 1.1700 Technical Resistance

The euro currency is holding on to the gains made for the second consecutive day.

This comes as prices reversed direction just a few pips shy of the 1.1600 level of support.

At the time of writing, the EURUSD is testing the previously held support level near the 1.1700 – 1.1715 region. If resistance forms here, we could expect prices to head back lower.

Adding to this view is the hidden divergence on the 4-hour chart as well.

A close below the expected resistance level could potentially send the EURUSD down to the 1.1600 handle. This will probably open the way for further declines.

Below the 1.1600 level of support, the 1.1500 level comes in as support next.

GBPUSD Rises To A One-Week High

The British pound sterling is marking a correction to the upside.

This follows prices consolidating near the 1.2750 handle over the past few sessions. The current gains, however, looks to be limited.

To the upside, the 1.3000 handle will surely keep a lid on the gains.

While to the downside, the retest of the 1.2750 level could hold prices from falling further. This could mean that the GBPUSD might trade sideways within the said levels.

The breakout from this level could however be strong. We expect this to come following an announcement in regards to the Brexit talks.

As a result, the bias remains mixed for the moment.

Above 1.3000 level, the next key resistance is near 1.3122, and to the downside, below 1.2750, the next support level is near 1.2516.

Oil Prices Retreat, Down Over 3%

WTI Crude oil prices are trading lower on Tuesday and were down over 3% intraday.

Price action remains steady within the 41.00 and the 38.83 levels of resistance and support respectively.

A breakout from this range to the downside could open up further declines.

Below the 38.83 level of support, oil prices could easily test the 9th September lows of 36.51.

The downside bias gains support as price action has reversed following a lower high formation. This potentially indicates a move to the downside.

However, the weekly bullish candlestick gives hope for an upside move as well.

But a lot of this will depend on how price reacts to the 38.83 level for the moment.

Gold Advances For A Second Day

The precious metal is attempting to pare losses from last week as price action is trading stronger for the second consecutive day.

The recovery although nascent comes after prices fell toward the 1850 handle earlier. In the process, we see the double bottom pattern holding up.

This puts the minimum upside back to the 1900 region. Given that 1900 – 1911.50 held up as a strong support level, we expect prices to reverse gains here.

A reversal off this region could keep prices floating above the 1850 handle in short term, but further gains could come if this 1850 support breaks.

The next main downside target will be the 1817.80 region.

By Orbex

Fibonacci Retracements Analysis 30.09.2020 (GBPUSD, EURJPY)

Article By RoboForex.com

GBPUSD, “Great Britain Pound vs US Dollar”

As we can see in the H4 chart, after a rebound from 38.2% fibo and a local convergence on MACD, GBPUSD is growing towards 23.6% fibo, which may be a signal in favor of a new mid-term rising wave to reach the high at 1.3482. After breaking it, the pair may continue moving towards the long-term 76.0% fibo at 1,3661. However, despite the convergence and the current growth, the asset may yet update the low and reach 50.0% fibo at 1.2445.

GBPUSD_H4
Risk Warning: the result of previous trading operations do not guarantee the same results in the future

The H1 chart shows a more detailed structure of the current pullback after the convergence on MACD. After reaching 23.6% fibo, the pair is consolidating around this level. If later the price breaks this range to the upside, the market may continue growing towards 38.2%, 50.0%, and 61.8% fibo at 1.2983, 1.3078, and 1.3174 respectively. The support is the high at 1.2675.

GBPUSD_H1
Risk Warning: the result of previous trading operations do not guarantee the same results in the future

EURJPY, “Euro vs. Japanese Yen”

As we can see in the H4 chart, after rebounding from the support at 38.2% fibo, EURJPY has returned to 23.6% fibo, which may be a signal in favor of a possible growth. However, as long as the price is moving below the high at 127.08, it’s only an assumption. The asset may reach the long-term 61.8% fibo at 128.65 only after breaking the above-mentioned peak. Despite a quick correctional wave to the upside, the pair may yet start a new decline towards 50.0% fibo at 121.20.

EURJPY_H4
Risk Warning: the result of previous trading operations do not guarantee the same results in the future

In the H1 chart, the instrument has reached 38.2% fibo after the convergence on MACD. In the future, the pair may form a short-term pullback and then resume growing towards 50.0% and 61.8% fibo at 124.73 and 125.28 respectively. The support is the low at 122.38.

EURJPY_H1

Article By RoboForex.com

Attention!
Forecasts presented in this section only reflect the author’s private opinion and should not be considered as guidance for trading. RoboForex LP bears no responsibility for trading results based on trading recommendations described in these analytical reviews.