Archive for Forex and Currency News – Page 347

Crude Oil Looking Weak

Author: Dmitriy Gurkovskiy, Chief Analyst at RoboForex

On Monday morning, November 2nd, Brent remains weak as it is trading not far from $37.45. Market players are in no hurry to risk: the presidential elections in the USA are ahead and investors usually try to escape all possible risks while expecting the results.

In addition to that, expectations of the demand for energies remains rather moderate. Hopes for China didn’t work out – the country’s economy is recovering but not too fast. As for the USA, it obviously needs some additional impulse, for example, a stimulus package, but it won’t happen until a new President is elected. In this light, the price growth potential is extremely limited.

Moreover, the oil market is currently very sensitive to the coronavirus situation in Europe. Starting today, Germany is introducing a “soft” lockdown mode – restrictions are intended to reduce the COVID-19 spread rate. France is the next.

Lockdowns, no matter light or hard, are a very questionable measure for Europe. On one hand, they do provide medical workers and facilities with time and save the population from the fast cross-contamination. On the other hand, they are a disaster for economies and have a negative influence on the demand for energies.

In the H4 chart, there was a gap this morning, which helped Brent break 37.72 to the downside. In the future, the price is expected to continue falling towards 35.10. This entire decline may be considered as an extension of the correctional wave. After reaching the above-mentioned level, the asset may start consolidating. If later the market breaks the range to the upside, the instrument may resume growing with the first target at 40.04. From the technical point of view, this scenario is confirmed by MACD Oscillator: its signal line is moving below close to the lows inside the histogram area. A breakout of the area to the upside implies a new growth towards 0. A breakout of this level, in its turn, will boost the price chart growth.

As we can see in the H1 chart, after completing the descending wave at 37.72 and forming the consolidation range around this level, Brent has broken this range to the downside; right now, it is expected to extend the correctional structure down to 35.46. Later, the market may start another growth to test 37.10 from below and then resume moving within the downtrend to with the target at 35.10. From the technical point of view, this idea is confirmed by Stochastic Oscillator: its signal line is moving below 50 within the “oversold area”. It has already reached 20 and may break the area to the upside towards 50, which suggests a new correction on the price chart.

Disclaimer

Any forecasts contained herein are based on the author’s particular opinion. This analysis may not be treated as trading advice. RoboForex bears no responsibility for trading results based on trading recommendations and reviews contained herein.

Mixed markets as stocks fall

By Han Tan, Market Analyst, ForexTime

A week is a long time…in markets!

It’s been a volatile few sessions for risk assets with disappointing results from the Tech titans adding to the fickle and rather febrile sentiment currently swirling around. Perhaps that’s to be expected with investors now focused more on what could go wrong as election week approaches. Markets have been playing the post-election reflation trade for the global economy into 2021, but there is certainly room for disappointment and especially if it takes a lot longer to figure out the eventual occupant of the Oval Office for the next four years.

King Dollar is mixed on the day and checked by the 94 mark, but the greenback is on track for its strongest weekly performance in five amid the heightened risk aversion. It seems there is now a lot more talk of a closer US election than previously thought, with some of the key swing states like Pennsylvania, Michigan and Wisconsin unable to start counting early votes until Tuesday, meaning it is highly unlikely they will able to make a final announcement on election night.

The gloomy mood has been exacerbated by last night’s Big Tech earnings which beat analyst expectations, but disappointed on various other issues. For example, Apple and Facebook are both down around five percent, the former reflecting disappointment that the company did not release holiday quarter revenue guidance, while Facebook is still scolded by the bruising hearing from both Republicans and Democrats this week.

No support from record Eurozone GDP

The deteriorating situation in Europe concerning the rising infection and hospitalisation rates has overshadowed the (mixed) data released this morning. The region’s economy expanded by 12.7 percent in the third quarter after an 11.8 percent contraction in the previous quarter. But the record rebound still leaves Eurozone growth over four percent below its late-2019 high. A drop in the final quarter of this wretched year is now likely, which of course is prompting the ECB to pre-commit to extra stimulus measures in December. Will a determined Lagarde be pushed into action sooner?

The 100-day moving average in EURUSD is acting as support at the moment with the world’s most heavily traded currency pair bouncing off yesterday’s low. The weekly close will be important to see if prices can hold below 1.1688 and break previous weekly support over the last few weeks. There looks like little support until 1.1615 after this.


Disclaimer: The content in this article comprises personal opinions and should not be construed as containing personal and/or other investment advice and/or an offer of and/or solicitation for any transactions in financial instruments and/or a guarantee and/or prediction of future performance. ForexTime (FXTM), its affiliates, agents, directors, officers or employees do not guarantee the accuracy, validity, timeliness or completeness, of any information or data made available and assume no liability as to any loss arising from any investment based on the same.


Forex-Time-LogoArticle by ForexTime

ForexTime Ltd (FXTM) is an award winning international online forex broker regulated by CySEC 185/12 www.forextime.com

Ichimoku Cloud Analysis 30.10.2020 (BTCUSD, USDCHF, BRENT)

Article By RoboForex.com

BTCUSD, “Bitcoin vs US Dollar”

BTCUSD is trading at 13205.00; the instrument is moving above Ichimoku Cloud, thus indicating an ascending tendency. The markets could indicate that the price may test the cloud’s upside border at 13055.00 and then resume moving upwards to reach 14515.00. Another signal in favor of further uptrend will be a rebound from the downside border of a Triangle pattern. However, the bullish scenario may no longer be valid if the price breaks the cloud’s downside border and fixes below 12145.00. In this case, the pair may continue falling towards 11705.00. To confirm further growth, the asset must break the pattern’s upside border and fix above 13405.00.

BTCUSD
Risk Warning: the result of previous trading operations do not guarantee the same results in the future

USDCHF, “US Dollar vs Swiss Franc”

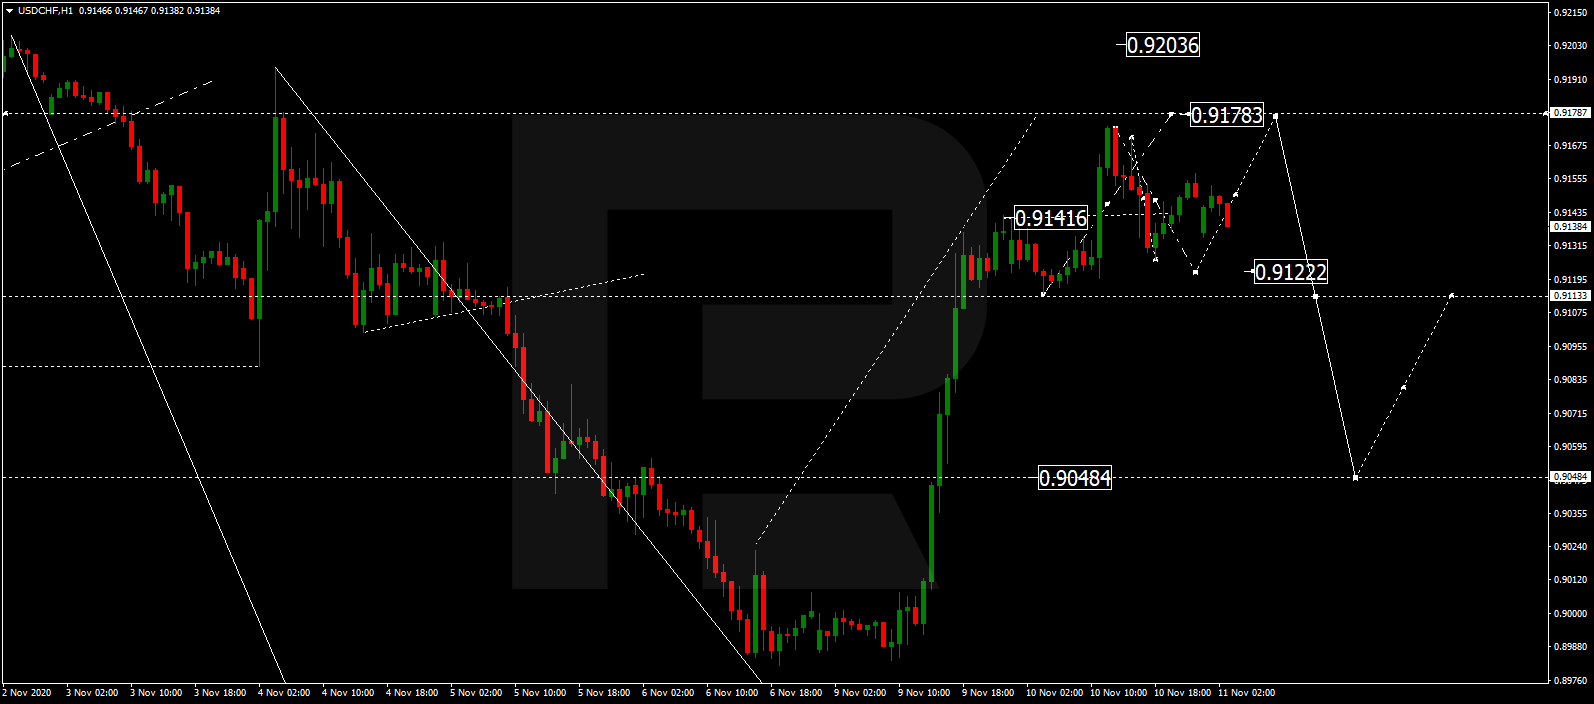
USDCHF is trading at 0.9141; the instrument is moving above Ichimoku Cloud, thus indicating an ascending tendency. The markets could indicate that the price may test Tenkan-Sen and Kijun-Sen at 0.9125 and then resume moving upwards to reach 0.9215. Another signal in favor of further uptrend will be a rebound from the rising channel’s downside border. However, the bullish scenario may no longer be valid if the price breaks the cloud’s downside border and fixes below 0.9075. In this case, the pair may continue falling towards 0.8995.

USDCHF
Risk Warning: the result of previous trading operations do not guarantee the same results in the future

BRENT

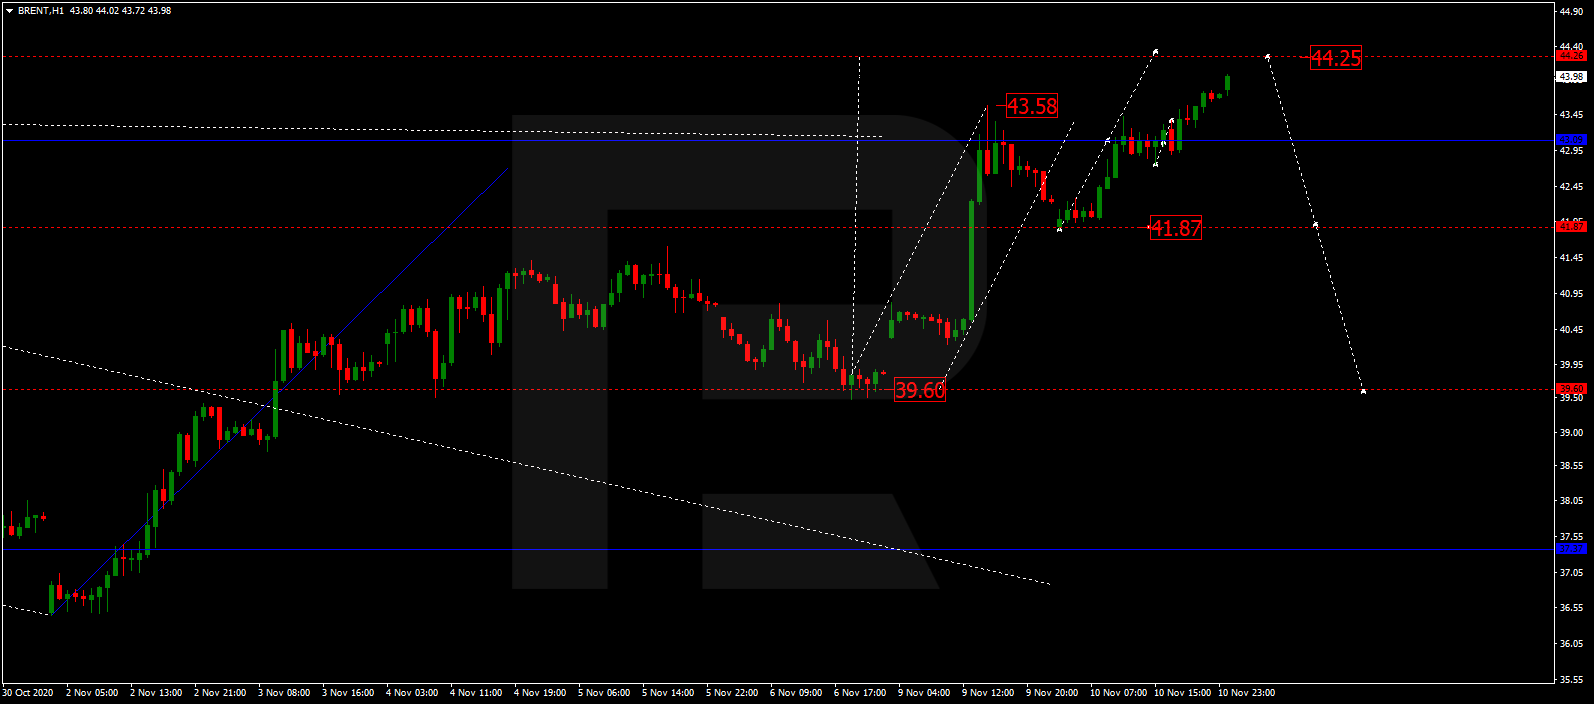
Brent is trading at 37.56; the instrument is moving below Ichimoku Cloud, thus indicating a descending tendency. The markets could indicate that the price may test Tenkan-Sen and Kijun-Sen at 38.30 and then resume moving downwards to reach 34.85. Another signal in favor of further downtrend will be a rebound from the descending channel’s upside border. However, the bearish scenario may no longer be valid if the price breaks the cloud’s upside border and fixes above 40.35. In this case, the pair may continue growing towards 41.55.

BRENT

Article By RoboForex.com

Attention!
Forecasts presented in this section only reflect the author’s private opinion and should not be considered as guidance for trading. RoboForex LP bears no responsibility for trading results based on trading recommendations described in these analytical reviews.

The Analytical Overview of the Main Currency Pairs on 2020.10.30

by JustForex

The EUR/USD currency pair

Technical indicators of the currency pair:
  • Prev Open: 1.17467
  • Open: 1.16717
  • % chg. over the last day: -0.60
  • Day’s range: 1.16649 – 1.16945
  • 52 wk range: 1.0637 – 1.2012

The greenback has continued its growth against the basket of world currencies. EUR/USD quotes have updated local lows. The US currency was supported by an optimistic report on US GDP. The ECB, as expected, kept interest rates at the same level. At the same time, the regulator signaled the introduction of additional financial incentives by the end of the year to combat the impact of COVID-19. At the moment, the EUR/USD currency pair is consolidating in the range of 1.1650-1.1695. We expect economic releases from Germany, the Eurozone and the US. Positions should be opened from key levels.

The news feed on 2020.10.30:
  • – Data on the GDP of Germany at 11:00 (GMT+2:00);
  • – Eurozone consumer price index at 12:00 (GMT+2:00);
  • – Eurozone GDP report at 12:00 (GMT+2:00);
  • – Personal spending in the US at 14:30 (GMT+2:00).
EUR/USD

Indicators signal the power of sellers: the price has fixed below 50 MA and 100 MA.

The MACD histogram is in the negative zone, which indicates the bearish sentiment.

Stochastic Oscillator is in the neutral zone, the %K line is below the %D line, which also gives a signal to sell EUR/USD.

Trading recommendations
  • Support levels: 1.1650, 1.1600
  • Resistance levels: 1.1695, 1.1725, 1.1760

If the price fixes below 1.1650, a further fall in EUR/USD quotes is expected. The movement is tending to the round level of 1.1600.

An alternative could be the growth of the EUR/USD currency pair to 1.1725-1.1760.

The GBP/USD currency pair

Technical indicators of the currency pair:
  • Prev Open: 1.29848
  • Open: 1.29236
  • % chg. over the last day: -0.42
  • Day’s range: 1.28987 – 1.29392
  • 52 wk range: 1.1409 – 1.3516

Sales prevail on the GBP/USD currency pair. The British pound has updated its local lows again. At the moment, GBP/USD quotes are consolidating. The trading instrument is testing the following support and resistance levels: 1.2885 and 1.2960, respectively. A further decline in the GBP/USD currency pair is possible. Positions should be opened from key levels.

The news feed on the UK economy is calm.

GBP/USD

Indicators signal the power of sellers: the price has fixed below 50 MA and 100 MA.

The MACD histogram is in the negative zone, which indicates the bearish sentiment.

Stochastic Oscillator is located near the oversold zone, the %K line has crossed the %D line. There are no signals at the moment.

Trading recommendations
  • Support levels: 1.2885, 1.2850, 1.2800
  • Resistance levels: 1.2960, 1.2995, 1.3025

If the price fixes below 1.2885, a further fall in GBP/USD quotes is expected. The movement is tending to 1.2850-1.2830.

An alternative could be the growth of GBP/USD quotes to 1.3000-1.3020.

The USD/CAD currency pair

Technical indicators of the currency pair:
  • Prev Open: 1.33185
  • Open: 1.33226
  • % chg. over the last day: +0.03
  • Day’s range: 1.32941 – 1.33458
  • 52 wk range: 1.2949 – 1.4669

USD/CAD quotes have become stable after a prolonged rally. At the moment, the loonie is consolidating in the range of 1.3280-1.3345. Traders expect additional drivers. In the near future, a technical correction of the trading instrument is possible. Today, Canada’s GDP report will be the key event. We recommend paying attention to the dynamics of “black gold” prices. Positions should be opened from key levels.

At 14:30 (GMT+2:00), Canada’s GDP data will be published.

USD/CAD

Indicators signal the power of buyers: the price has fixed above 50 MA and 100 MA.

The MACD histogram is in the positive zone, which gives a signal to buy USD/CAD.

Stochastic Oscillator is located near the overbought zone, the %K line has crossed the %D line. There are no signals at the moment.

Trading recommendations
  • Support levels: 1.3280, 1.3250, 1.3220
  • Resistance levels: 1.3345, 1.3390

If the price fixes above 1.3345, further growth in USD/CAD quotes is expected. The movement is tending to 1.3390-1.3420.

An alternative could be a decline in the USD/CAD currency pair to 1.3250-1.3220.

The USD/JPY currency pair

Technical indicators of the currency pair:
  • Prev Open: 104.322
  • Open: 104.605
  • % chg. over the last day: +0.31
  • Day’s range: 104.124 – 104.628
  • 52 wk range: 101.19 – 112.41

There is an ambiguous technical pattern on the USD/JPY currency pair. The trading instrument is in a sideways trend. At the moment, the following key support and resistance levels can be distinguished: 104.05 and 104.45, respectively. The demand for safe assets is still high. We do not exclude a further decline in USD/JPY quotes. We recommend paying attention to the dynamics of US government bonds yield. Positions should be opened from key levels.

Japan published optimistic industrial production data for September.

USD/JPY

Indicators do not give accurate signals: the price has crossed the 50 MA.

The MACD histogram has started declining, which indicated the bearish sentiment.

Stochastic Oscillator is in the neutral zone, the %K line is above the %D line, which gives a signal to buy USD/JPY.

Trading recommendations
  • Support levels: 104.05, 103.70, 103.50
  • Resistance levels: 104.45, 104.70, 104.90

If the price fixes below 104.05, a further drop in USD/JPY quotes is expected. The movement is tending to 103.70-103.50.

An alternative could be the growth of the USD/JPY currency pair to 104.70-104.90.

by JustForex


This article reflects a personal opinion and should not be interpreted as an investment advice, and/or offer, and/or a persistent request for carrying out financial transactions, and/or a guarantee, and/or a forecast of future events.

After the ECB and before the lockdown: where is EURUSD headed?

By Admiral Markets

Economic Events October 30, 2020 Source: Economic Events October 30, 2020 – Admiral Markets’ Forex Calendar

When looking at the EVZ, Euro FX VIX, which measures volatility in the Euro FX-Future, recent developments indicate rising volatility in the Euro and, thus, EURUSD.

There has recently been new lockdowns in Europe as a response to the new wave of Coronavirus infections:

  • France has imposed new restrictions and a lockdown
  • Germany, the biggest European economy, is now also planning a lockdown, even though German Chancellor Merkel calls it a light lockdown, mainly focusing on closing bars and restaurants

Since these new restrictions conflict with the need to revive economies battered by the crisis, the Euro dropped back below 1.1800, most likely due to market participants expecting the ECB to unleash further monetary stimulus at some point in the near future.

In addition:

  • While the ECB didn’t implement a looser monetary policy at its meeting on Thursday, the rhetoric of ECB president Lagarde clearly pointed to an increase of the size of the PEPP envelope from €1.35tn to €2.0tn at the December meeting
  • This, along with further cuts in the ECB deposit rate by the end of 2021

This would usually, under normal circumstances, result in a very bearish outlook for the Euro against the US-Dollar and explains the drop back below 1.1800. However, the expected US-Dollar weakness that will occur once Democrats and Republicans finally reach a deal on an economic relief package financed with freshly printed US-Dollar from the US central bank FED, will limit the downside in the EURUSD.

While another attack on the region around 1.1600 and even a stint to as low as 1.1450/1500 is in the cards, we are still considering any short-term Euro dip to be short-lived with the currency pair likely to see an aggressive attempt to capture 1.2000 over the course of Q4/2020, especially if a break above 1.1900 is seen:

EURUSD Daily chart Source: Admiral Markets MT5 with MT5SE Add-on EURUSD Daily chart (from July 24, 2019, to October 29, 2020). Accessed: October 29, 2020, at 10:00 PM GMT. Please note: Past performance is not a reliable indicator of future results, or future performance.

In 2015, the value of the EURUSD fell by 10.2%, in 2016, it fell by 3.2%, in 2017, it increased by 13.92%, in 2018, it fell by 4.4%, and in 2019, it fell by 2.2%, meaning that in five years, it was down by 7.3%.

Discover the world’s #1 multi-asset platform

Admiral Markets offers professional traders the ability to trade with MetaTrader 5, allowing you to experience trading at a significantly higher, more rewarding level than with MetaTrader 4. Experience benefits such as the addition of the Market Heat Map, so you can compare various currency pairs to see which ones might be lucrative investments, access real-time trading data, and so much more. Click the banner below to start your FREE download of MT5!

Trade With MetaTrader 5

Disclaimer: The given data provides additional information regarding all analysis, estimates, prognosis, forecasts or other similar assessments or information (hereinafter “Analysis”) published on the website of Admiral Markets. Before making any investment decisions please pay close attention to the following:

  1. This is a marketing communication. The analysis is published for informative purposes only and is in no way to be construed as investment advice or recommendation. It has not been prepared in accordance with legal requirements designed to promote the independence of investment research, and that it is not subject to any prohibition on dealing ahead of the dissemination of investment research.
  2. Any investment decision is made by each client alone whereas Admiral Markets shall not be responsible for any loss or damage arising from any such decision, whether or not based on the Analysis.
  3. Each of the Analysis is prepared by an independent analyst (Jens Klatt, Professional Trader and Analyst, hereinafter “Author”) based on the Author’s personal estimations.
  4. To ensure that the interests of the clients would be protected and objectivity of the Analysis would not be damaged Admiral Markets has established relevant internal procedures for prevention and management of conflicts of interest.
  5. Whilst every reasonable effort is taken to ensure that all sources of the Analysis are reliable and that all information is presented, as much as possible, in an understandable, timely, precise and complete manner, Admiral Markets does not guarantee the accuracy or completeness of any information contained within the Analysis. The presented figures that refer to any past performance is not a reliable indicator of future results.
  6. The contents of the Analysis should not be construed as an express or implied promise, guarantee or implication by Admiral Markets that the client shall profit from the strategies therein or that losses in connection therewith may or shall be limited.
  7. Any kind of previous or modeled performance of financial instruments indicated within the Publication should not be construed as an express or implied promise, guarantee or implication by Admiral Markets for any future performance. The value of the financial instrument may both increase and decrease and the preservation of the asset value is not guaranteed.
  8. The projections included in the Analysis may be subject to additional fees, taxes or other charges, depending on the subject of the Publication. The price list applicable to the services provided by Admiral Markets is publicly available from the website of Admiral Markets.
  9. Leveraged products (including contracts for difference) are speculative in nature and may result in losses or profit. Before you start trading, you should make sure that you understand all the risks.

By Admiral Markets

Markets recalibrating risk and the virus

By Lukman Otunuga, Research Analyst, ForexTime

It’s a been a very busy few hours in financial markets with data and the ECB meeting all grabbing the headlines. That’s not even mentioning the rising and deeply worrying pandemic numbers or the matter of electing the next US president.

US GDP smashed all previous annualised records (16.7% from 1950 for those who like their statistics!) This helps offset the historic 31.4% plunge in the second quarter and erases roughly two-thirds of the total decline since the start of the pandemic. However, it is still the second-worst recession in 62 years and economists reckon the economy is still five quarters from completely recovering. We’ve also had the release of the weekly initial jobless claims which fell to their lowest level since 14 March, dropping by 40,000 to 751,000. Downside momentum remains intact but will renewed lockdown measures lead to another spike in claims in the coming weeks?

The ECB left all policies unchanged at its meeting this afternoon, but President Lagarde stated that “there is little doubt the ECB will act in December.” The contrast between previous head, Mario Draghi and his ‘never pre-commit’ phrase to the current President’s ‘we will recalibrate all our instruments’ is particularly stark in these unprecedented and gloomy times. New economic projections arrive in December so there is much work to be done on how much more QE will come, its duration, volume and attractiveness – does the situation in fact worsen to force the ECB to act sooner?

EUR down, Dollar up

It’s pretty much a two-pronged attack on EUR/USD today! The Dollar is firm on elevated volatility as stocks stabilise while the Vix hit highs above 40 earlier in the session. Meanwhile, the single currency has been beaten down by the ECB’s acknowledgement of increasing economic risks and more dovishness than expected. With October sentiment already slowing ahead of more significant lockdown measures, the dreaded ‘double-dip’ scenario appears to be on the horizon in the final quarter of this year.

Things are looking bearish for EUR/USD now with the pair taking out mid-October lows and heading towards the next support at the 100-day Moving Average around 1.1650. Q3 GDP figures for the region are released tomorrow but may be bittersweet at best with a depressing winter to come.

Will the Tech giants save the day?

With ‘Super (FAANGs earnings) Thursday’ nearly upon us, US stocks are trying hard to hold on to support at the 100-day Moving Average. The tech titans, Apple, Amazon, Facebook and Microsoft release their numbers after the US close and may have to do more than beat expectations – as Samsung did earlier today – with all eyes more focused on the outlooks. Any hints of weakness may see the S&P turn red again with September lows at 3209 a major level for bulls to defend.

Disclaimer: The content in this article comprises personal opinions and should not be construed as containing personal and/or other investment advice and/or an offer of and/or solicitation for any transactions in financial instruments and/or a guarantee and/or prediction of future performance. ForexTime (FXTM), its affiliates, agents, directors, officers or employees do not guarantee the accuracy, validity, timeliness or completeness, of any information or data made available and assume no liability as to any loss arising from any investment based on the same.


Forex-Time-LogoArticle by ForexTime

ForexTime Ltd (FXTM) is an award winning international online forex broker regulated by CySEC 185/12 www.forextime.com

Japanese Candlesticks Analysis 29.10.2020 (EURUSD, USDJPY, EURGBP)

Article By RoboForex.com
EURUSD, “Euro vs. US Dollar”

As we can see in the H4 chart, the correction within the uptrend continues. Right now, after forming several reversal patterns, such as Hammer, close to the support area, EURUSD is still reversing and may later resume growing to reach the upside target at the resistance level at 1.1900. At the same time, an alternative scenario says that the instrument may fall to reach 1.1695 without correcting towards the above-mentioned resistance level.

EURUSD
Risk Warning: the result of previous trading operations do not guarantee the same results in the future

USDJPY, “US Dollar vs. Japanese Yen”

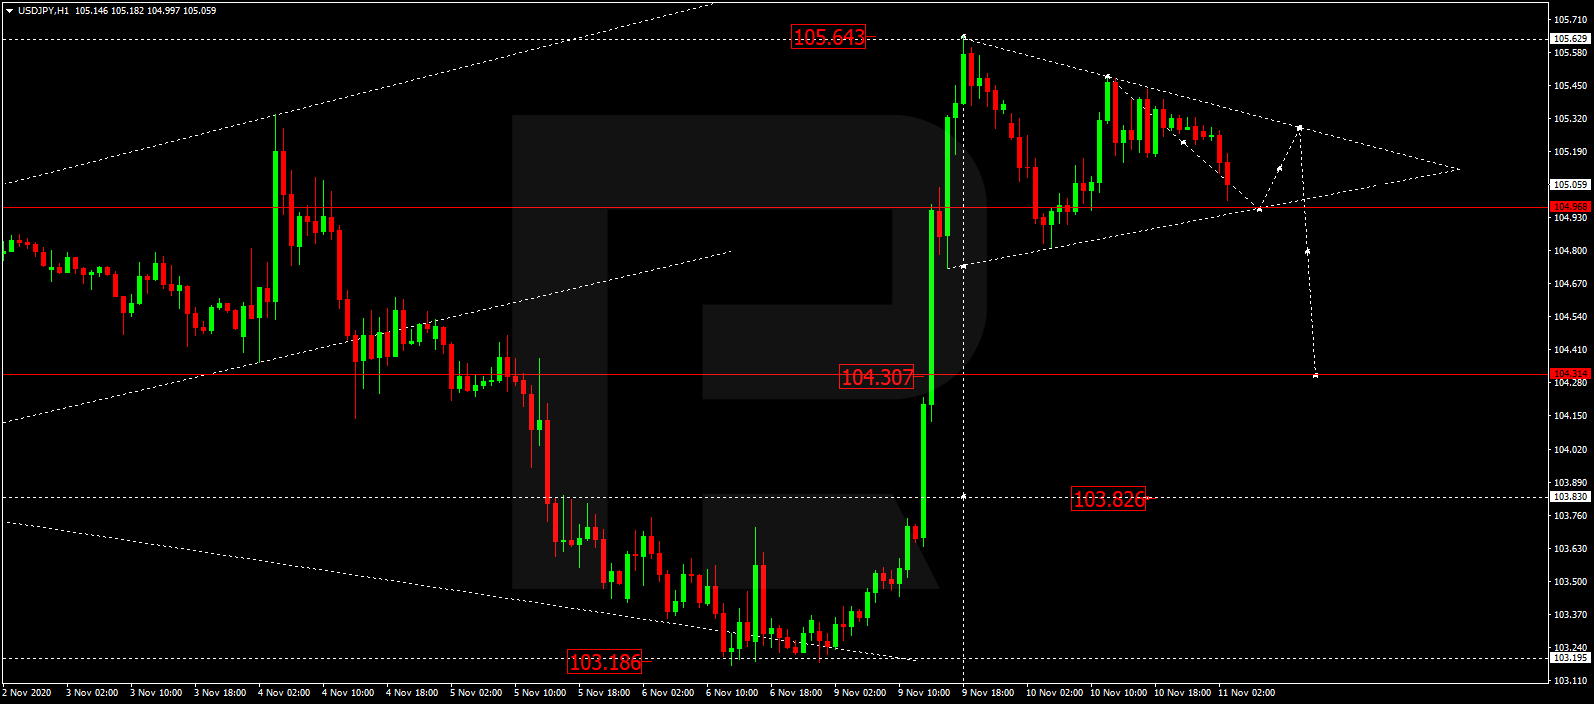
As we can see in the H4 chart, after forming several reversal patterns, such as Inverted Hammer and Engulfing, close to the support area, USDJPY is reversing. In the future, the price may test the resistance area at 105.05, break this level, and then continue the ascending tendency. In this case, the upside target is still the next resistance level at 106.45. Still, there is an opposite scenario, which says that the instrument may continue falling towards 104.00 before resuming its growth.

USDJPY
Risk Warning: the result of previous trading operations do not guarantee the same results in the future

EURGBP, “Euro vs. Great Britain Pound”

As we can see in the H4 chart, the descending tendency continues. In the nearest future, EURGBP may break the horizontal support level and continue falling. In this case, the downside target will be the support area at 0.8975. However, judging by previous movements, the asset may yet rebound from the above-mentioned area once again and resume trading upwards. If it happens, the upside target will be the channel’s upside border at 0.9095.

EURGBP

Article By RoboForex.com
Attention!
Forecasts presented in this section only reflect the author’s private opinion and should not be considered as guidance for trading. RoboForex LP bears no responsibility for trading results based on trading recommendations described in these analytical reviews.

Ichimoku Cloud Analysis 29.10.2020 (EURUSD, XAUUSD, BRENT)

Article By RoboForex.com
EURUSD, “Euro vs US Dollar”

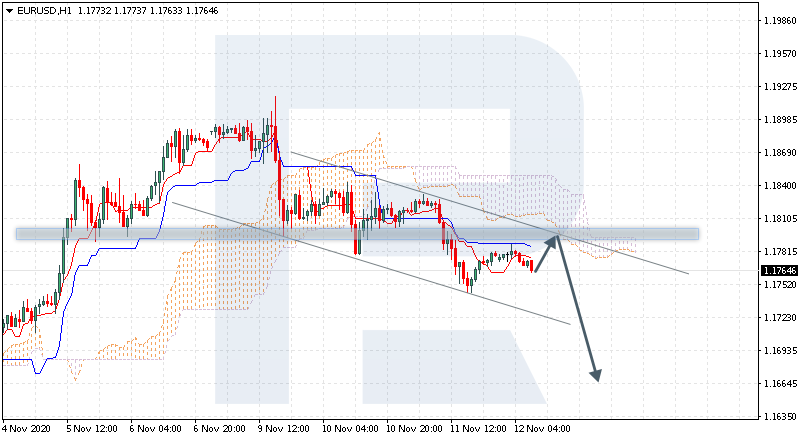
EURUSD is trading at 1.1754; the instrument is moving below Ichimoku Cloud, thus indicating a descending tendency. The markets could indicate that the price may test the cloud’s upside border at 1.1780 and then resume moving downwards to reach 1.1665. Another signal in favor of further downtrend will be a rebound from the descending channel’s upside border. However, the bearish scenario may be canceled if the price breaks the cloud’s upside border and fixes above 1.1810. In this case, the pair may continue growing towards 1.1905.
EURUSD
Risk Warning: the result of previous trading operations do not guarantee the same results in the future

XAUUSD, “Gold vs US Dollar”

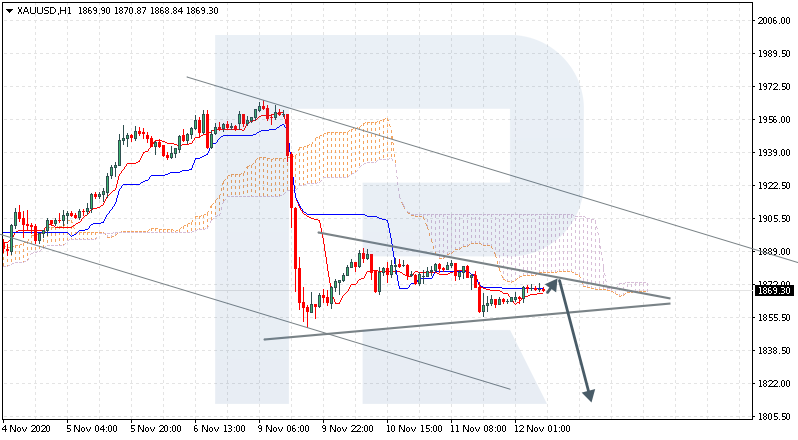
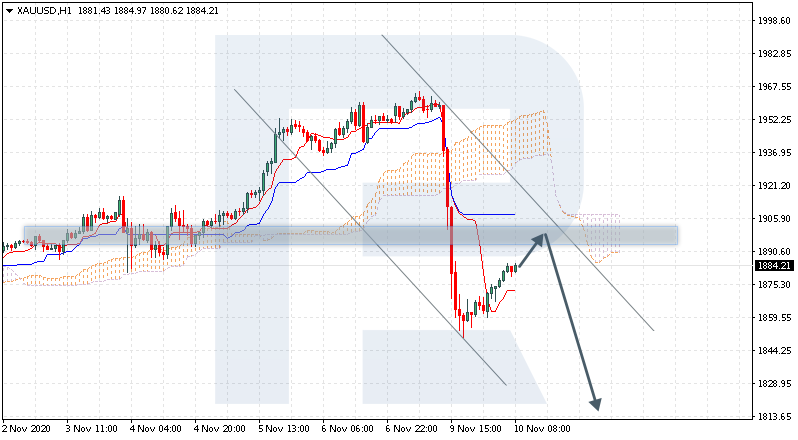
XAUUSD is trading at 1883.00; the instrument is moving below Ichimoku Cloud, thus indicating a descending tendency. The markets could indicate that the price may test Tenkan-Sen and Kijun-Sen at 1890.00 and then resume moving downwards to reach 1850.00. Another signal in favor of further downtrend will be a rebound from a Triangle pattern. However, the bearish scenario may no longer be valid if the price breaks the cloud’s upside border and fixes above 1900.00. In this case, the pair may continue growing towards 1945.00.

XAUUSD
Risk Warning: the result of previous trading operations do not guarantee the same results in the future

BRENT

Brent is trading at 39.77; the instrument is moving below Ichimoku Cloud, thus indicating a descending tendency. The markets could indicate that the price may test the cloud’s upside border at 40.35 and then resume moving downwards to reach 37.75. Another signal in favor of further downtrend will be a rebound from the descending channel’s upside border. However, the bearish scenario may no longer be valid if the price breaks the cloud’s upside border and fixes above 41.05. In this case, the pair may continue growing towards 42.65.

BRENT

Article By RoboForex.com

Attention!
Forecasts presented in this section only reflect the author’s private opinion and should not be considered as guidance for trading. RoboForex LP bears no responsibility for trading results based on trading recommendations described in these analytical reviews.

The Analytical Overview of the Main Currency Pairs on 2020.10.29

by JustForex

The EUR/USD currency pair

Technical indicators of the currency pair:
  • Prev Open: 1.17869
  • Open: 1.17467
  • % chg. over the last day: -0.43
  • Day’s range: 1.17250 – 1.17589
  • 52 wk range: 1.0637 – 1.2012

Demand for risky assets is still low amid the rapid spread of the coronavirus pandemic. The EUR/USD currency pair has set new local lows. At the moment, quotes are consolidating in the range of 1.1720-1.1760. Investors have taken a wait-and-see attitude before today’s ECB meeting. It is expected that the regulator will keep the key marks of monetary policy at the same level. We also recommend paying attention to economic releases from the US. Positions should be opened from key levels.

The news feed on 2020.10.29:
  • – Report on US GDP at 14:30 (GMT+2:00);
  • – Initial jobless claims in the US at 14:30 (GMT+2:00);
  • – ECB interest rate decision at 14:45 (GMT+2:00);
  • – Pending home sales in the US at 16:00 (GMT+2:00).
EUR/USD

Indicators signal the power of sellers: the price has fixed below 50 MA and 100 MA.

The MACD histogram is in the negative zone, which indicates the bearish sentiment.

Stochastic Oscillator is in the neutral zone, the %K line is below the %D line, which also gives a signal to sell EUR/USD.

Trading recommendations
  • Support levels: 1.1720, 1.1700
  • Resistance levels: 1.1760, 1.1785, 1.1800

If the price fixes below 1.1720, EUR/USD quotes are expected to fall further. The movement is tending to 1.1690-1.1670.

An alternative could be the growth of the EUR/USD currency pair to 1.1790-1.1810.

The GBP/USD currency pair

Technical indicators of the currency pair:
  • Prev Open: 1.30421
  • Open: 1.29848
  • % chg. over the last day: -0.48
  • Day’s range: 1.29809 – 1.30250
  • 52 wk range: 1.1409 – 1.3516

The GBP/USD currency pair has become stable. At the moment, the British pound is consolidating. The trading instrument is testing local support and resistance levels: 1.2975 and 1.3025, respectively. Traders are looking for additional drivers. We recommend paying attention to the economic reports from the US. A further decline in the trading instrument is possible. Positions should be opened from key levels.

The publication of important UK economic releases is not planned.

GBP/USD

Indicators do not give accurate signals: the price is testing 50 MA and 100 MA.

The MACD histogram is near the 0 mark. There are no signals at the moment.

Stochastic Oscillator is in the neutral zone, the %K line is below the %D line, which gives a signal to sell GBP/USD.

Trading recommendations
  • Support levels: 1.2975, 1.2920, 1.2870
  • Resistance levels: 1.3025, 1.3055, 1.3080

If the price fixes below 1.2975, a further drop in GBP/USD quotes is expected. The movement is tending to 1.2920-1.2900.

An alternative could be the growth of GBP/USD quotes to 1.3070-1.3100.

The USD/CAD currency pair

Technical indicators of the currency pair:
  • Prev Open: 1.31859
  • Open: 1.33185
  • % chg. over the last day: +1.02
  • Day’s range: 1.32779 – 1.33193
  • 52 wk range: 1.2949 – 1.4669

There are aggressive purchases on the USD/CAD currency pair. During yesterday’s trading session, the Canadian dollar weakened against the US dollar by more than 130 points. The trading instrument has set new local highs. At the moment, the loonie is consolidating in the range of 1.3280-1.3330. The Canadian dollar is under pressure due to the negative dynamics of oil prices. Further growth of the USD/CAD currency pair is possible. Positions should be opened from key levels.

Yesterday, the Bank of Canada, as expected, kept the key marks of monetary policy at the same level.

USD/CAD

Indicators signal the power of buyers: the price has fixed above 50 MA and 100 MA.

The MACD histogram is in the positive zone, which gives a signal to buy USD/CAD.

Stochastic Oscillator is in the neutral zone, the %K line is above the %D line, which also indicates the bullish sentiment.

Trading recommendations
  • Support levels: 1.3280, 1.3250, 1.3220
  • Resistance levels: 1.3330, 1.3370, 1.3400

If the price fixes above 1.3330, further growth in USD/CAD quotes is expected. The movement is tending to 1.3360-1.3390.

An alternative could be a decline in the USD/CAD currency pair to 1.3250-1.3220.

The USD/JPY currency pair

Technical indicators of the currency pair:
  • Prev Open: 104.470
  • Open: 104.322
  • % chg. over the last day: -0.11
  • Day’s range: 104.193 – 104.502
  • 52 wk range: 101.19 – 112.41

The USD/JPY currency pair has become stable after the fall since the beginning of this week. At the moment, the trading instrument is consolidating. Local support and resistance levels are 104.15 and 104.55, respectively. In the near future, a technical correction is possible. We recommend paying attention to the dynamics of US government bonds yield. Positions should be opened from key levels.

The Bank of Japan, as expected, kept the key marks of monetary policy at the same level.

USD/JPY

Indicators signal the power of sellers: the price has fixed below 50 MA and 100 MA.

The MACD histogram is near the 0 mark. There are no signals at the moment.

Stochastic Oscillator is in the neutral zone, the %K line is below the %D line, which indicates the bearish sentiment.

Trading recommendations
  • Support levels: 104.15, 104.00, 103.70
  • Resistance levels: 104.55, 104.75, 104.90

If the price fixes below 104.15, a further fall in USD/JPY quotes is expected. The movement is tending to 103.80-103.60.

An alternative could be the growth of the USD/JPY currency pair to 104.80-105.00.

by JustForex


This article reflects a personal opinion and should not be interpreted as an investment advice, and/or offer, and/or a persistent request for carrying out financial transactions, and/or a guarantee, and/or a forecast of future events.

Fibonacci Retracements Analysis 28.10.2020 (GBPUSD, EURJPY)

Article By RoboForex.com

GBPUSD, “Great Britain Pound vs US Dollar”

As we can see in the H4 chart, after reaching 61.8% fibo, GBPUSD has started moving downwards. This reversal and the decline that followed may be considered as a short-term pullback. After completing it, the asset is highly likely to resume growing to reach 76.0% fibo at 1.3288 and then the high at 1.3482. However, there is another scenario that implies further decline to break the low at 1.2675.

GBPUSD_H4
Risk Warning: the result of previous trading operations do not guarantee the same results in the future

The H1 chart shows a more detailed structure of the current correction. After attempting to test 38.2% fibo at 1.2985, the first descending wave is trying to transform into a sideways channel. If the price breaks this channel to the downside, the instrument may resume falling towards 50.0% and 61.8% fibo at 1.2926 and 1.2867 respectively. However, if the instrument breaks the resistance at 1.3177, the correction will be over.

GBPUSD_H1
Risk Warning: the result of previous trading operations do not guarantee the same results in the future

EURJPY, “Euro vs. Japanese Yen”

As we can see in the H4 chart, the previous rising wave has failed to break the local high and continue the uptrend. At the moment, the asset is trading downwards to break the low at 122.38 and may later continue falling to reach 61.8% and 76.0% fibo at 122.28 and 121.18 respectively.

EURJPY_H4
Risk Warning: the result of previous trading operations do not guarantee the same results in the future

In the H1 chart, the pair has broken 76.0% fibo. In the future, the instrument is expected to break the low at 122.38 and then continue falling towards 61.8% fibo at 122.28.

EURJPY_H1

Article By RoboForex.com

Attention!
Forecasts presented in this section only reflect the author’s private opinion and should not be considered as guidance for trading. RoboForex LP bears no responsibility for trading results based on trading recommendations described in these analytical reviews.