Archive for Forex and Currency News – Page 348

Forex Technical Analysis & Forecast 28.10.2020

Article By RoboForex.com

EURUSD, “Euro vs US Dollar”

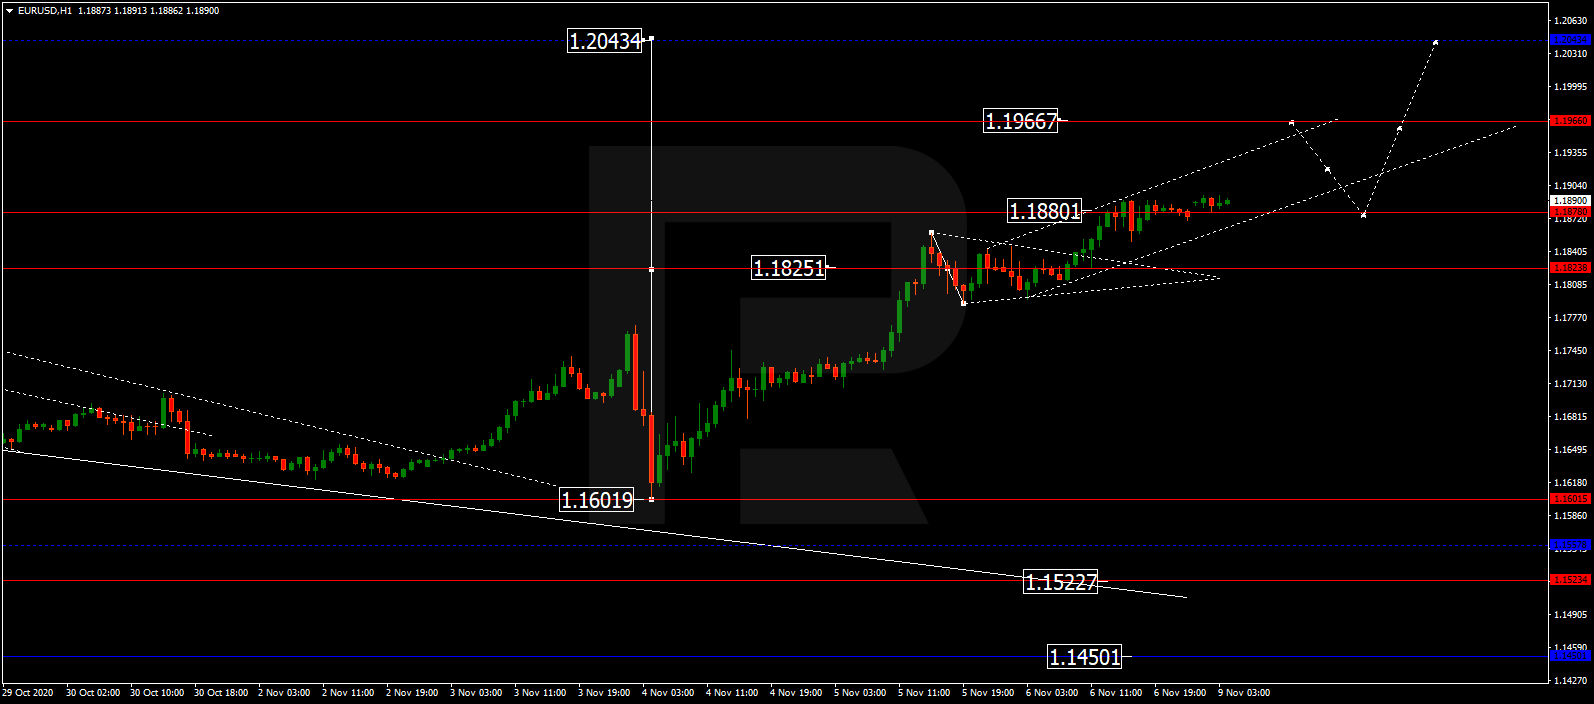
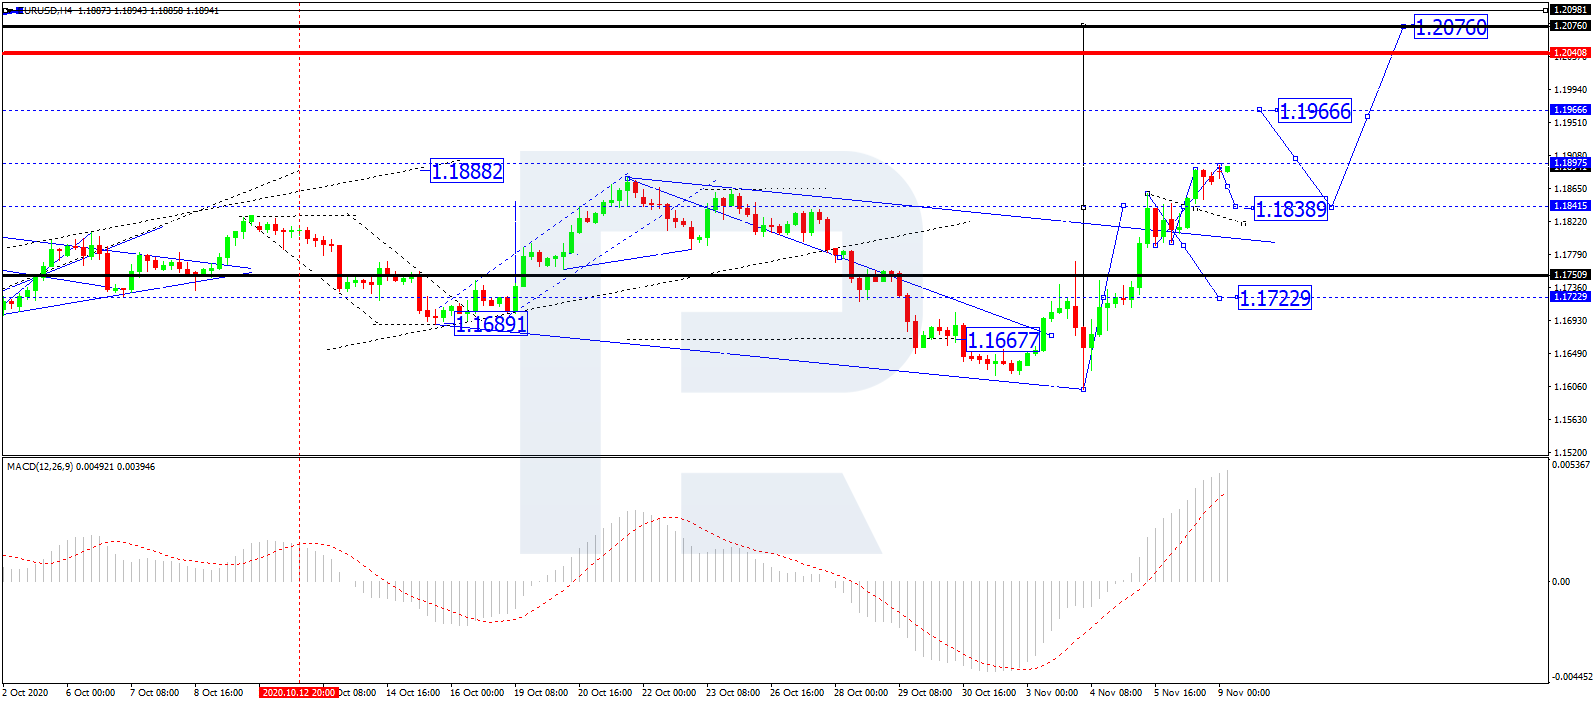
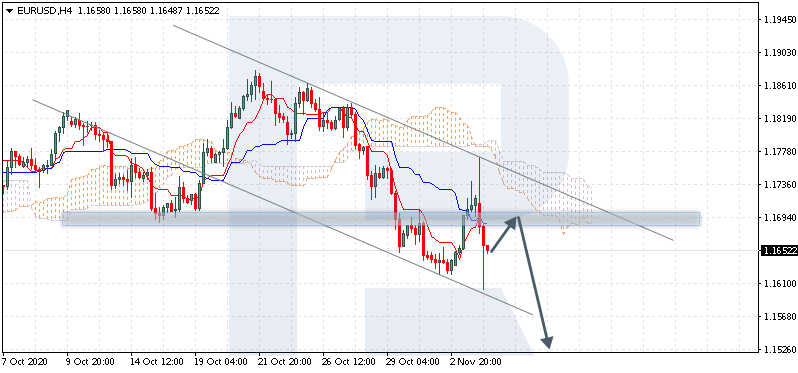
After finishing the correction at 1.1838 along with another descending wave towards 1.1768, EURUSD is expected to consolidate above the latter level. Possibly, the pair may correct to test 1.1820 from below and then resume trading downwards with the short-term target at 1.1682.

EURUSD
Risk Warning: the result of previous trading operations do not guarantee the same results in the future

GBPUSD, “Great Britain Pound vs US Dollar”

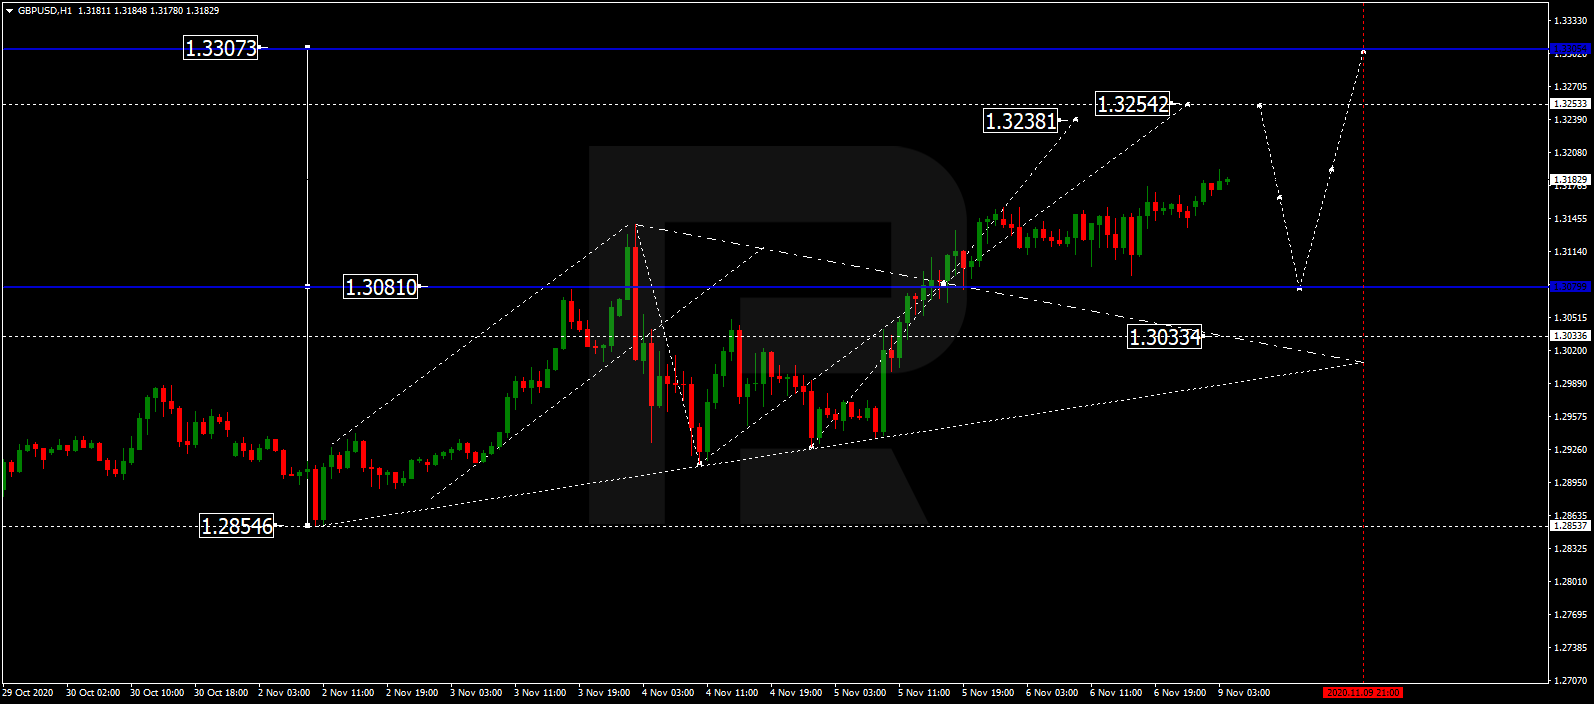
GBPUSD is still consolidating around 1.3040. Possibly, today the pair may fall to reach 1.3003 and then grow towards 1.3080. After that, the instrument may break the range to the downside to resume falling and break 1.2939. Later, the market may continue trading within the downtrend with the short-term target at 1.2777.

GBPUSD
Risk Warning: the result of previous trading operations do not guarantee the same results in the future

USDRUB, “US Dollar vs Russian Ruble”

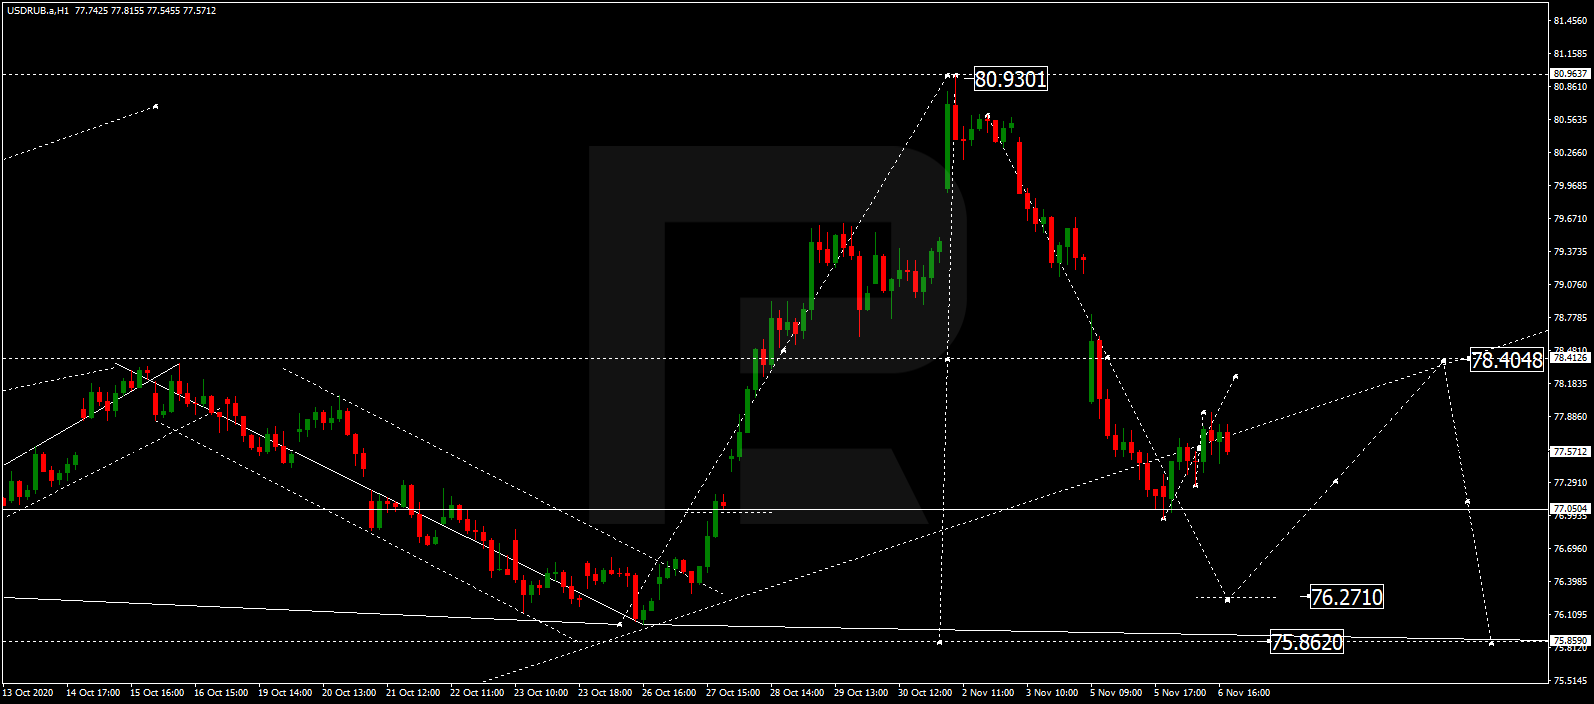
After forming the consolidation range above 76.00 and breaking it to the upside, USDRUB is expected to grow towards 77.44 and may later resume moving inside the downtrend to reach 76.70, thus forming a new consolidation range between the two latter levels.

USDRUB
Risk Warning: the result of previous trading operations do not guarantee the same results in the future

USDJPY, “US Dollar vs Japanese Yen”

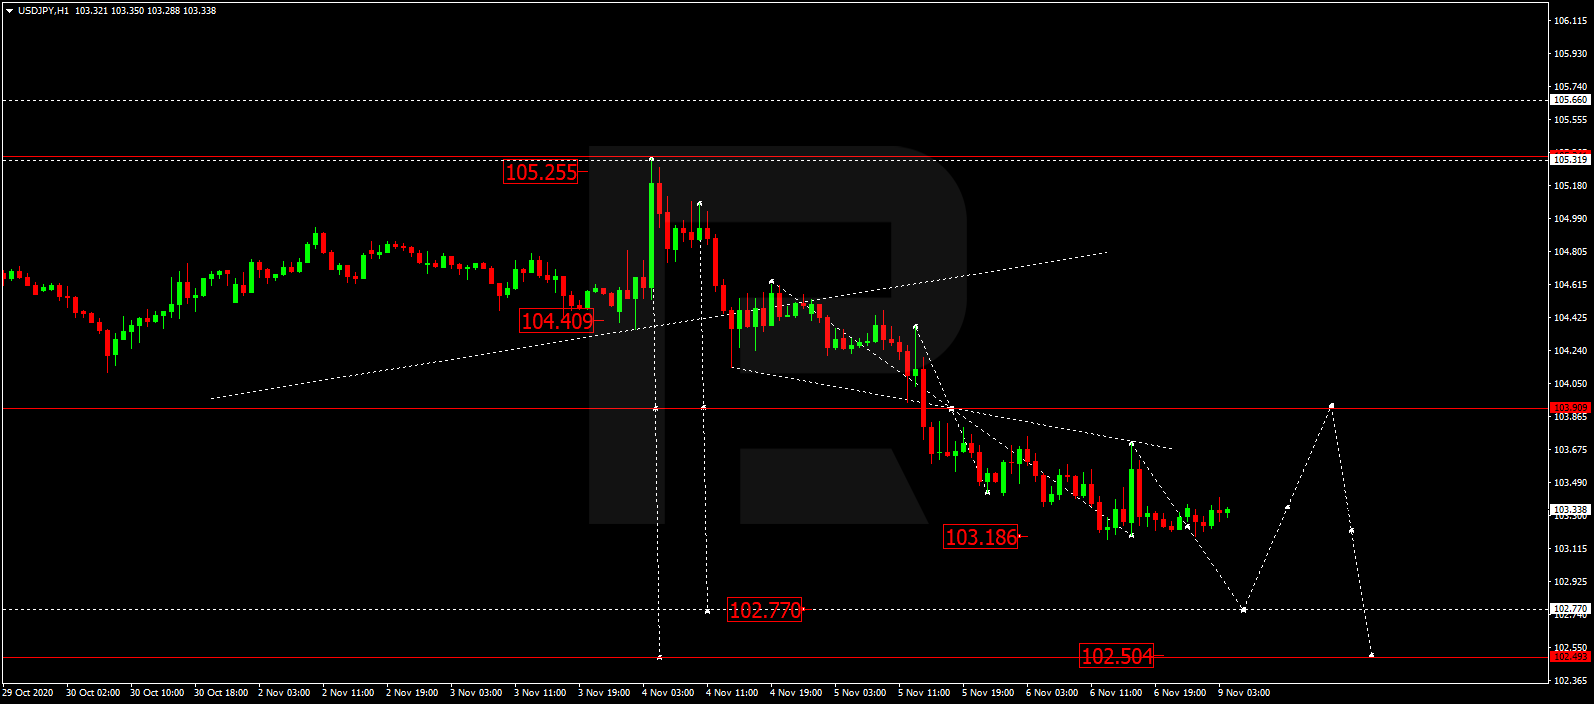
After finishing the descending structure at 104.40 and breaking this level to the downside, USDJPY is expected to continue moving downwards with the short-term target at 103.83. After that, the instrument may correct to return to 104.40 and test it from below.

USDJPY
Risk Warning: the result of previous trading operations do not guarantee the same results in the future

USDCHF, “US Dollar vs Swiss Franc”

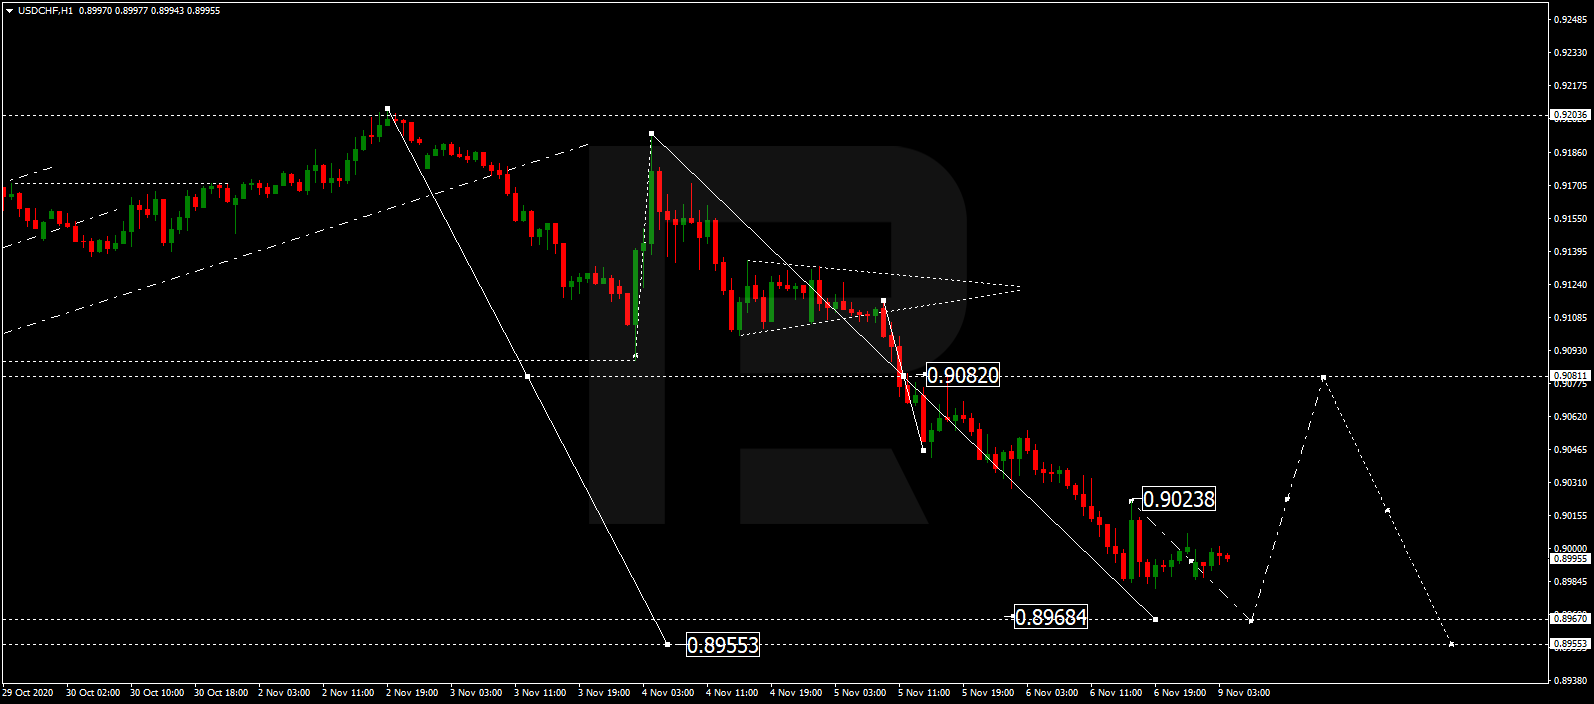
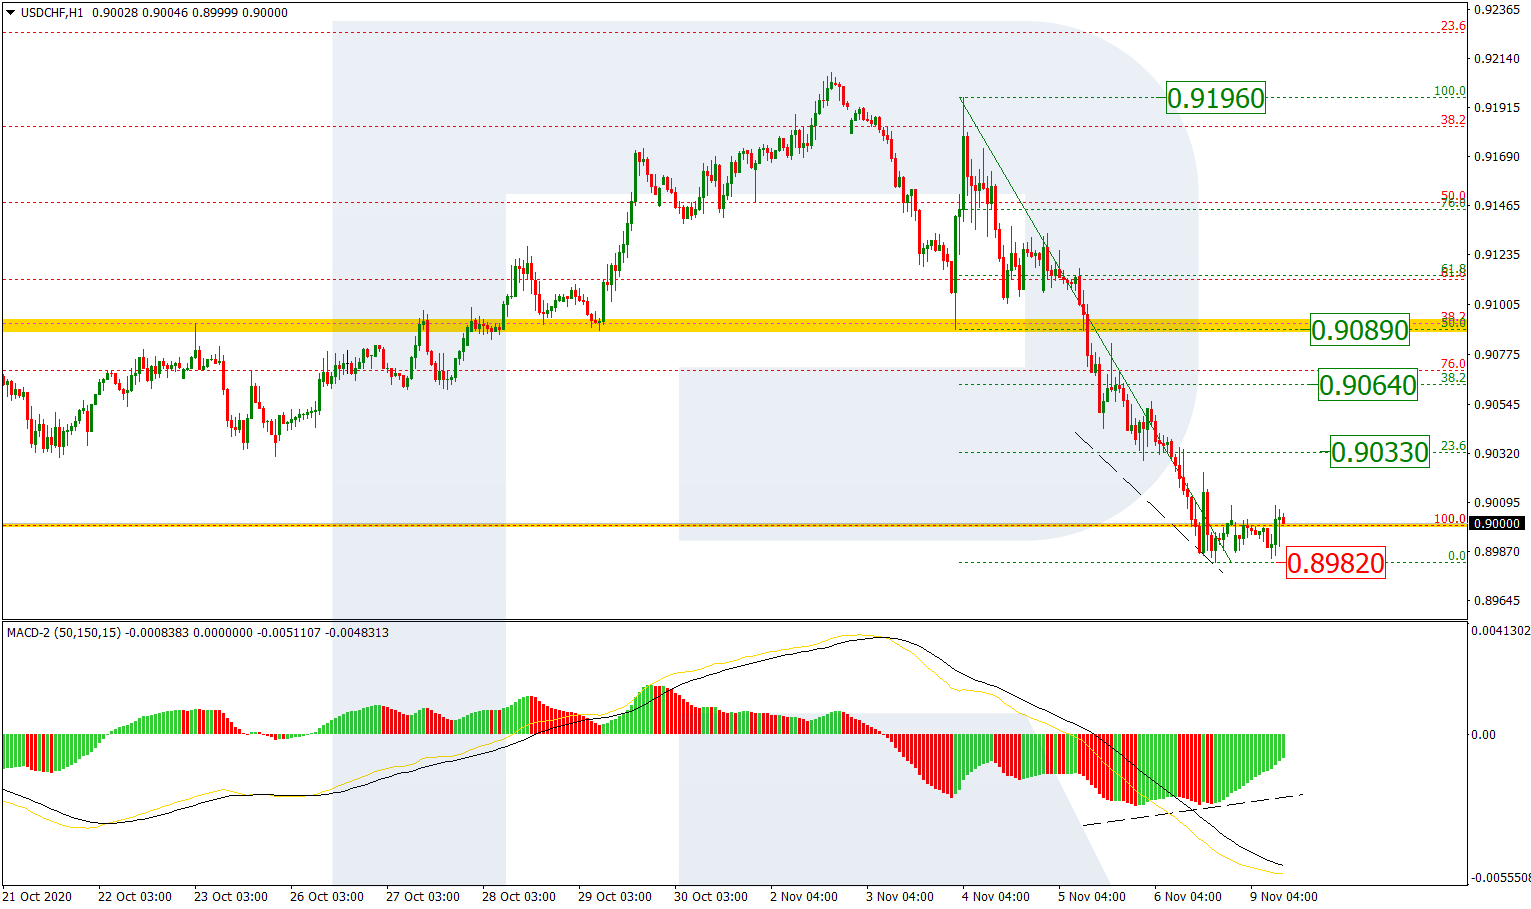
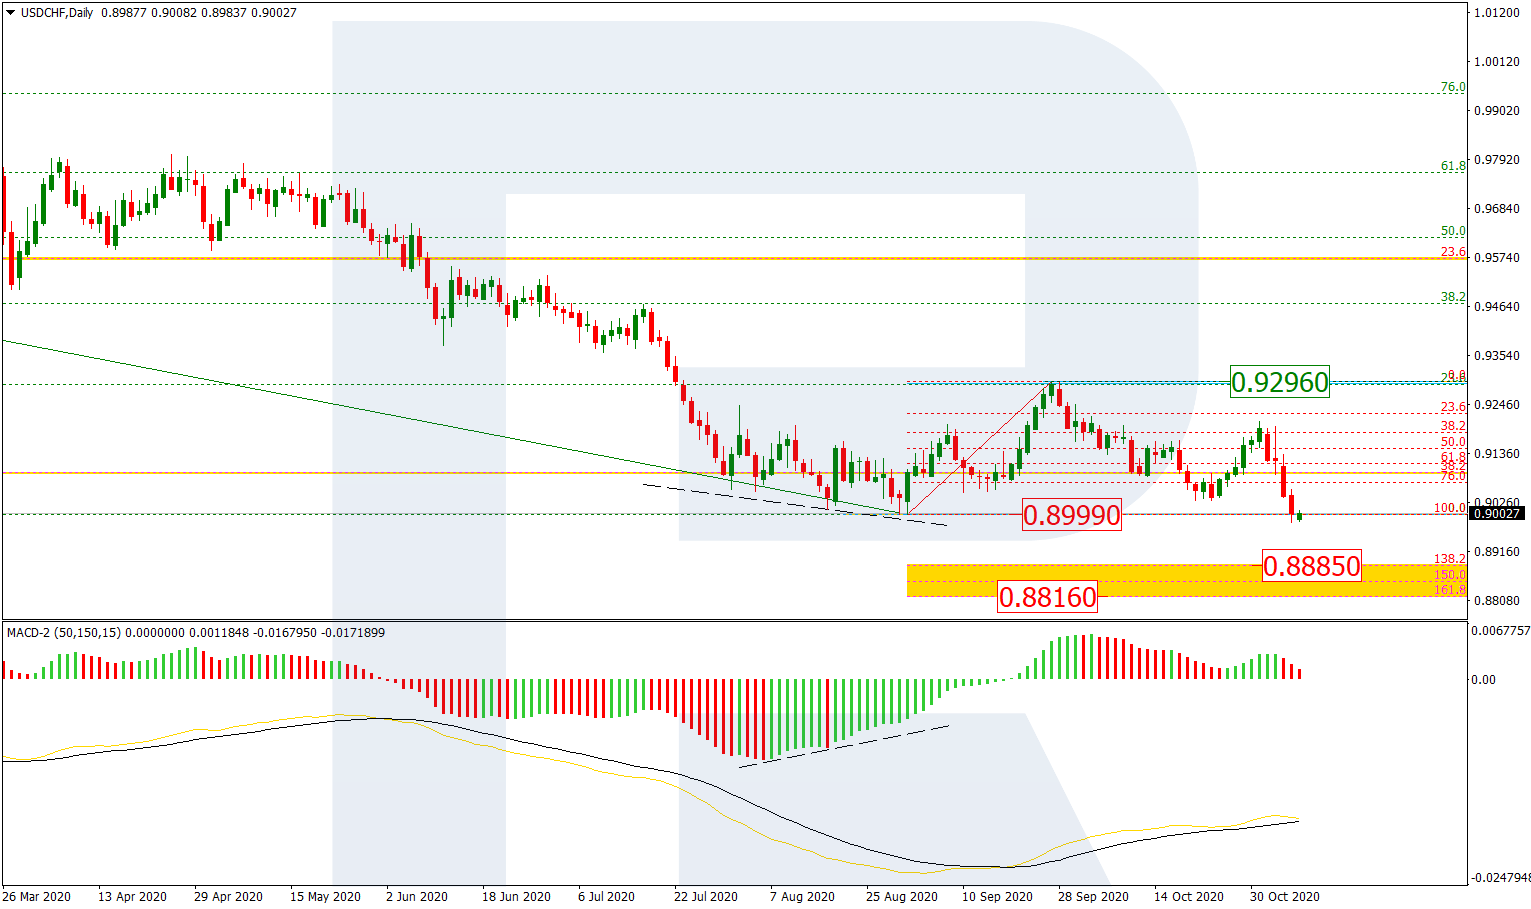
After completing the ascending structure at 0.9098, USDCHF is consolidating below this level. Today, the pair may break the range to the upside and reach the short-term target at 0.9137. Later, the market may start another correction to test 0.9098 from below and then resume trading within the uptrend to reach 0.9166.

USDCHF
Risk Warning: the result of previous trading operations do not guarantee the same results in the future

AUDUSD, “Australian Dollar vs US Dollar”

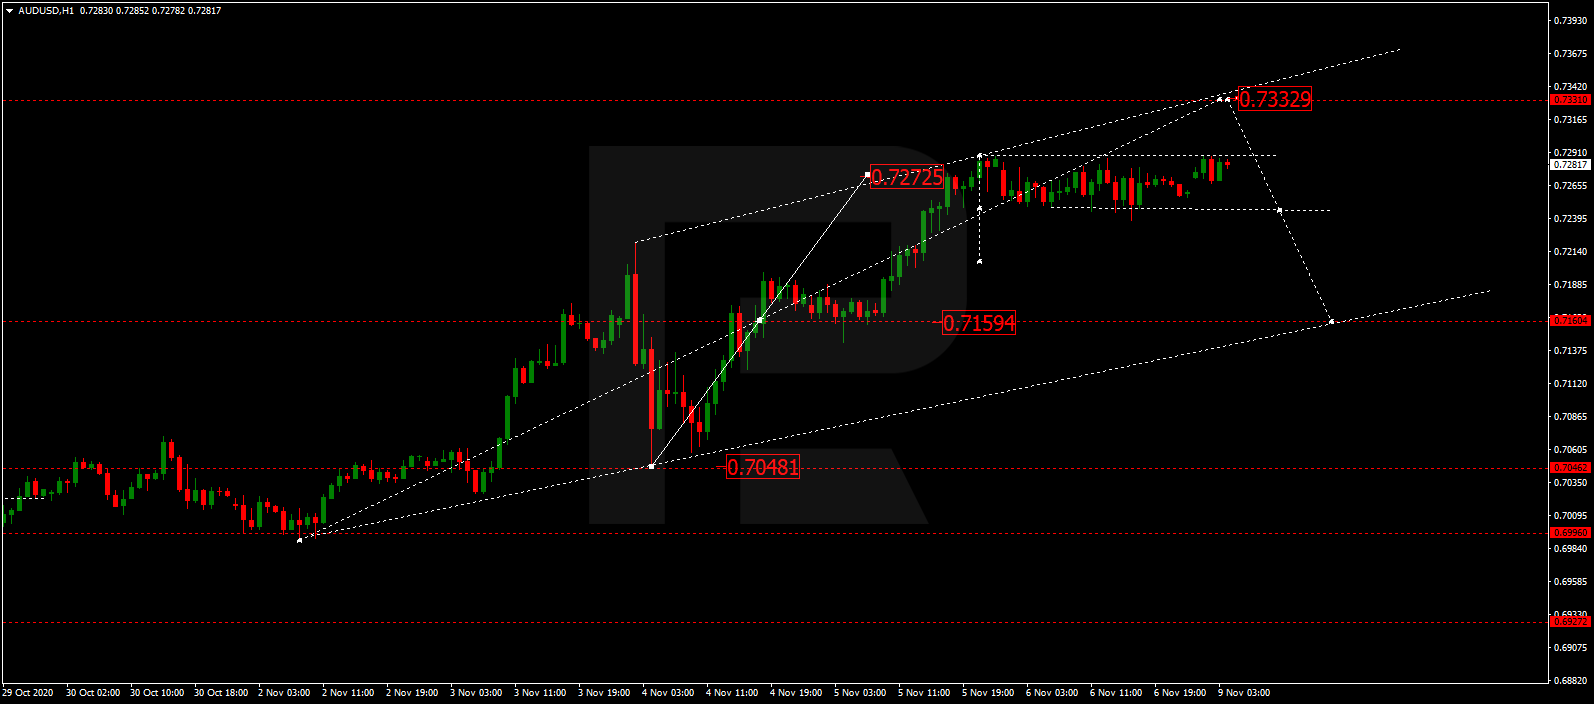
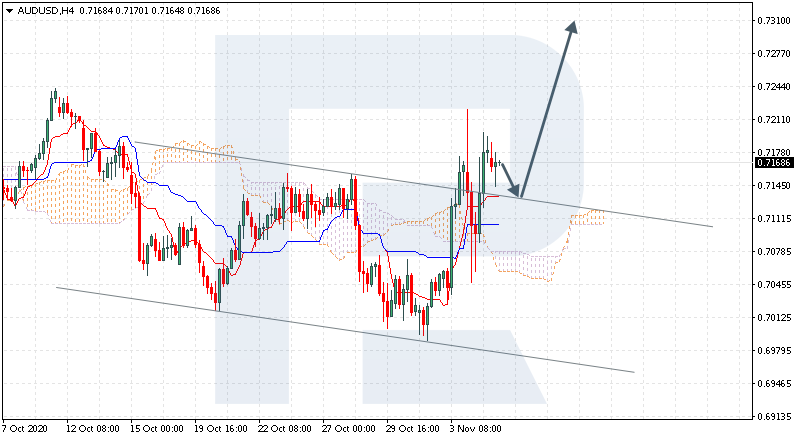
AUDUSD is still consolidating around 0.7124 without any particular direction. Possibly, the pair may expand the range up to 0.7150 and then resume falling to break 0.7094. After that, the instrument may continue moving within the downtrend with the target at 0.7050.

AUDUSD
Risk Warning: the result of previous trading operations do not guarantee the same results in the future

BRENT

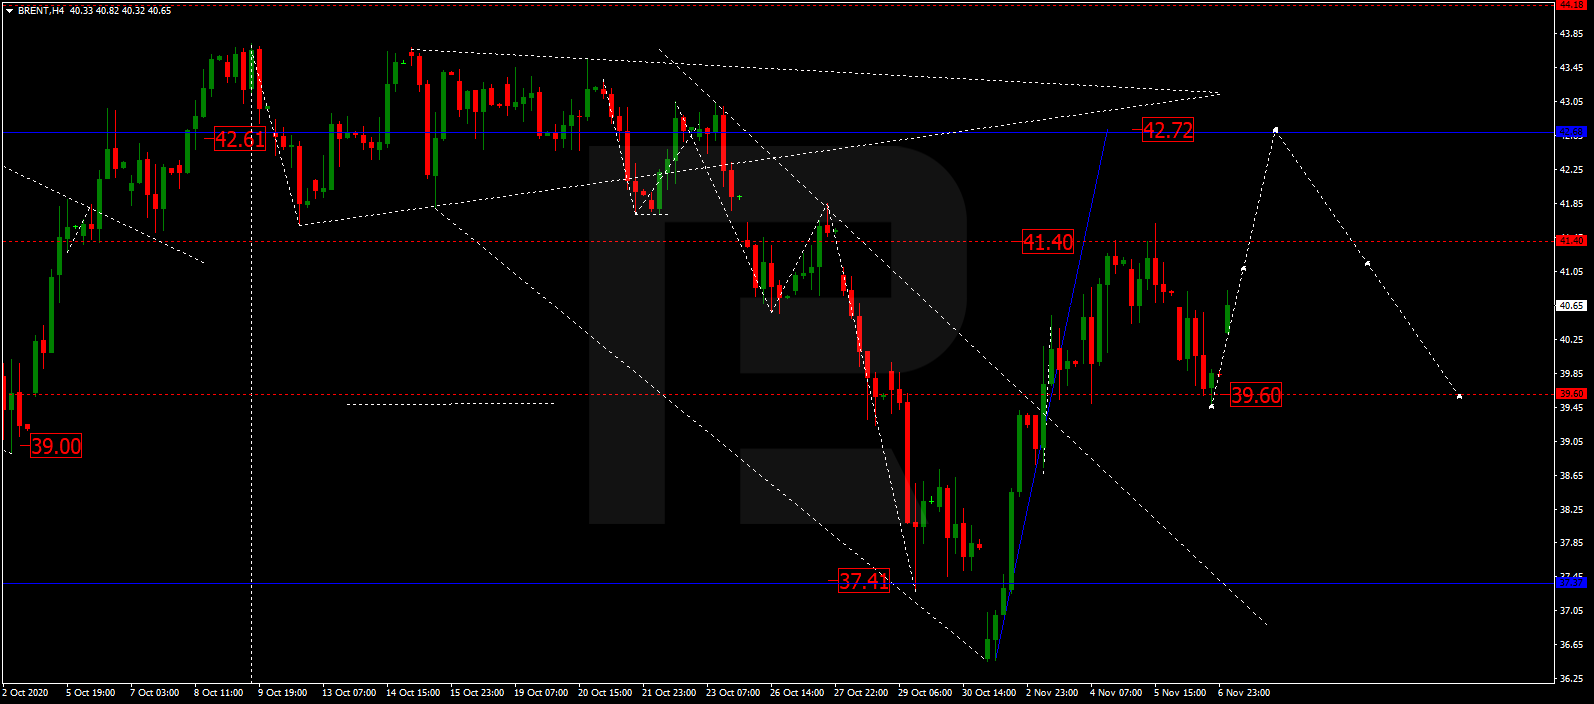
After completing the ascending structure and testing 41.80 from below, Brent is moving downwards to break 40.50. Later, the market may continue falling towards 39.50 and then start a new correction to return to 41.80.

BRENT
Risk Warning: the result of previous trading operations do not guarantee the same results in the future

XAUUSD, “Gold vs US Dollar”

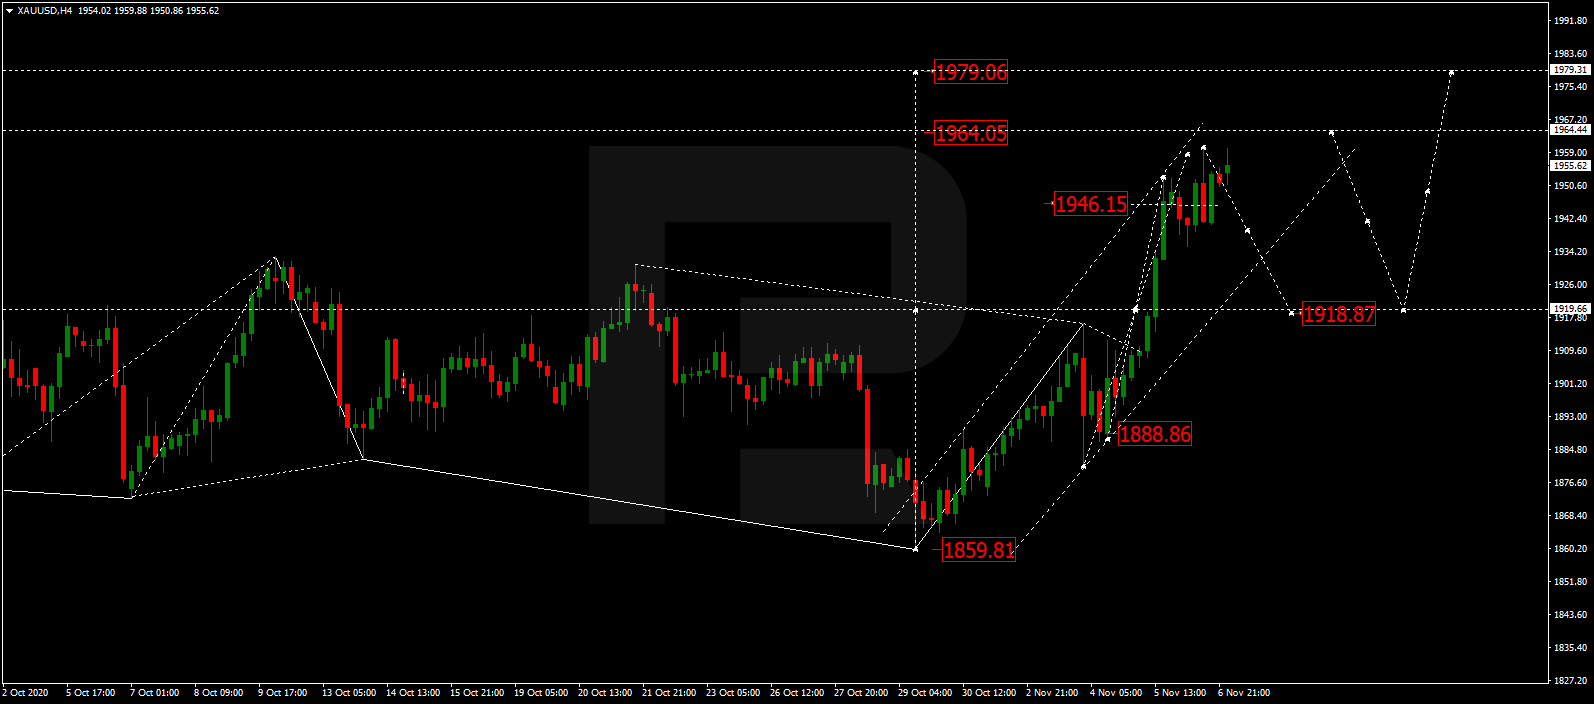
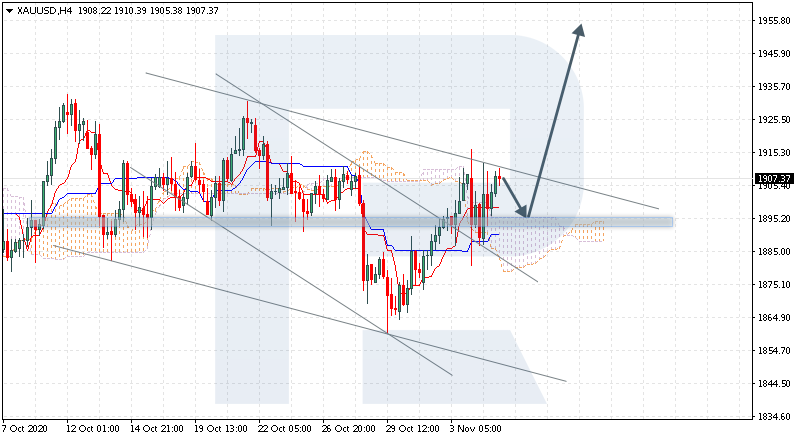
Gold is still consolidating around 1903.00. Possibly, the pair may expand the range up to 1913.50 and then form a new descending structure to break 1897.80, Later, the market may continue trading within the downtrend with the short-term target at 1872.00.

GOLD
Risk Warning: the result of previous trading operations do not guarantee the same results in the future

BTCUSD, “Bitcoin vs US Dollar”

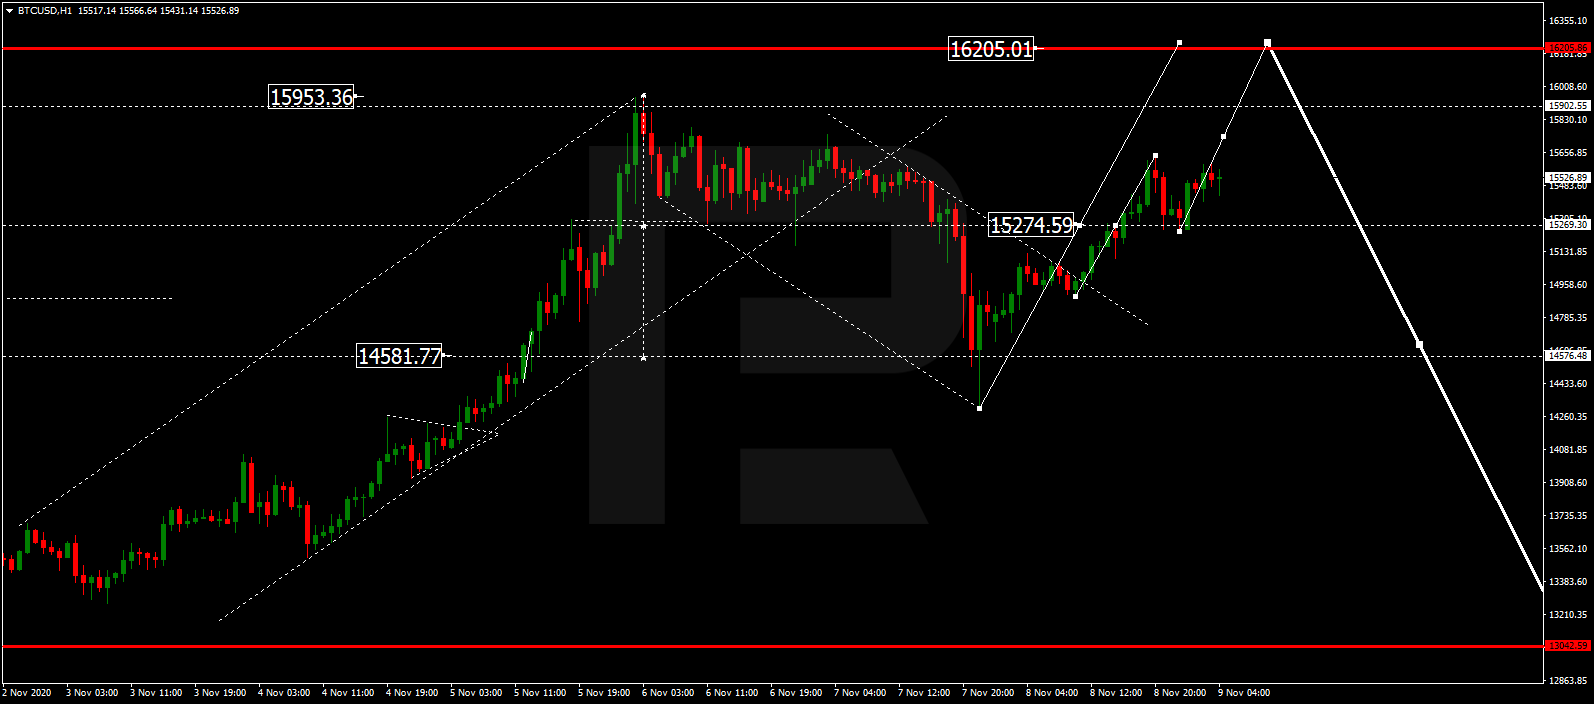
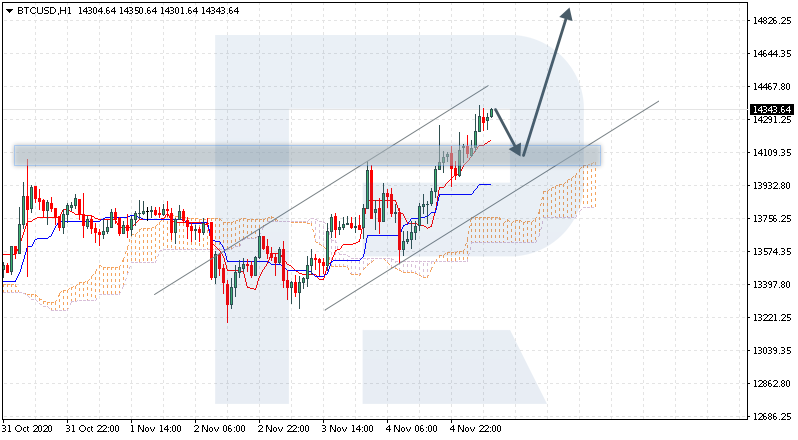
After finishing another ascending structure at 13500.00 and forming the consolidation range above this level, BTCUSD has broken the range to the upside. Possibly, the asset may continue moving upwards to reach 14000.00 or even extend this structure up to 14250.00. After that, the instrument may start another correction with the target at 13000.00.

BITCOIN
Risk Warning: the result of previous trading operations do not guarantee the same results in the future

S&P 500

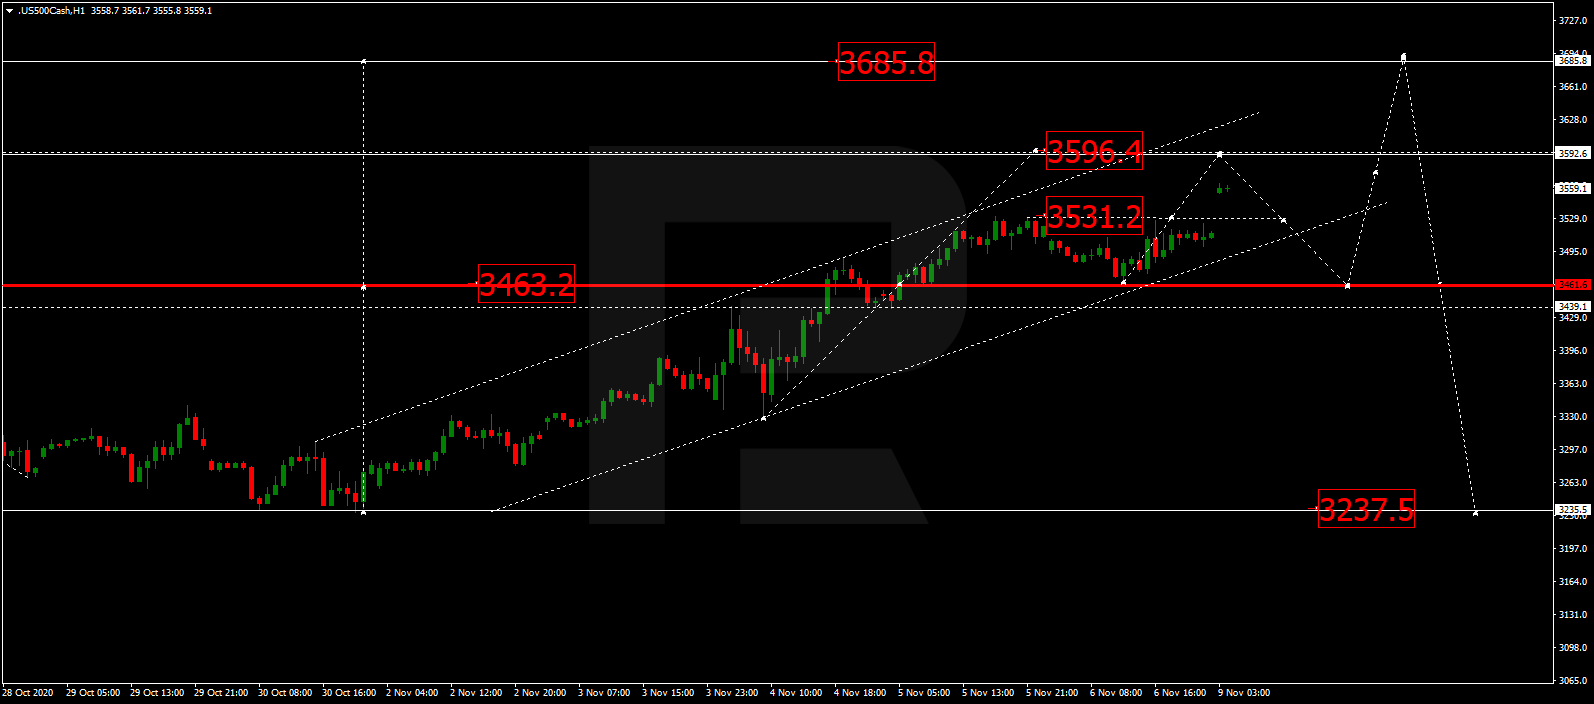
After rebounding from 3418.1 to the downside, the S&P index is expected to resume moving within the downtrend to reach 3335.3. Later, the market may correct towards 3400.0 and then start a new decline with the short-term target at 3275.0.

S&P 500

Article By RoboForex.com

Attention!
Forecasts presented in this section only reflect the author’s private opinion and should not be considered as guidance for trading. RoboForex LP bears no responsibility for trading results based on trading recommendations described in these analytical reviews.

The Analytical Overview of the Main Currency Pairs on 2020.10.28

by JustForex

The EUR/USD currency pair

Technical indicators of the currency pair:
  • Prev Open: 1.18085
  • Open: 1.17869
  • % chg. over the last day: -0.11
  • Day’s range: 1.17431 – 1.17880
  • 52 wk range: 1.0637 – 1.2012

EUR/USD quotes have been declining. The trading instrument has updated local lows. The demand for risky assets has weakened amid the rapid spread of the COVID-19 epidemic and the upcoming US presidential election. Investors expect the ECB meeting on October 29th. At the moment, the EUR/USD currency pair is consolidating in the range of 1.1740-1.1785. The euro has the potential for further decline. We recommend opening positions from key levels.

Today, the news feed is quite calm.

EUR/USD

Indicators signal the power of sellers: the price has fixed below 50 MA and 100 MA.

The MACD histogram is in the negative zone, which indicates the bearish sentiment.

Stochastic Oscillator is in the neutral zone, the %K line has crossed the %D line. There are no signals at the moment.

Trading recommendations
  • Support levels: 1.1740, 1.1700
  • Resistance levels: 1.1785, 1.1800, 1.1840

If the price fixes below 1.1740, a further fall in EUR/USD quotes is expected. The movement is tending to the round level of 1.1700.

An alternative could be the growth of the EUR/USD currency pair to 1.1820-1.1840.

The GBP/USD currency pair

Technical indicators of the currency pair:
  • Prev Open: 1.30192
  • Open: 1.30421
  • % chg. over the last day: +0.15
  • Day’s range: 1.29633 – 1.30634
  • 52 wk range: 1.1409 – 1.3516

Sales prevail on the GBP/USD currency pair. The British pound has updated local lows. At the moment, GBP/USD quotes are testing the level of 1.2965. The 1.3015 mark is already a “mirror” resistance. The demand for greenback has strengthened. The trading instrument has the potential for further decline. Positions should be opened from key levels.

The publication of important UK economic releases is not planned.

GBP/USD

Indicators signal the power of sellers: the price has fixed below 50 MA and 100 MA.

The MACD histogram has started declining, which indicates the bearish sentiment.

Stochastic Oscillator is in the neutral zone, the %K line is below the %D line, which gives a signal to sell GBP/USD.

Trading recommendations
  • Support levels: 1.2965, 1.2920, 1.2870
  • Resistance levels: 1.3015, 1.3055, 1.3080

If the price fixes below 1.2965, a further drop in GBP/USD quotes is expected. The movement is tending to the round level of 1.2900.

An alternative could be the growth of GBP/USD quotes to 1.3050-1.3080.

The USD/CAD currency pair

Technical indicators of the currency pair:
  • Prev Open: 1.32078
  • Open: 1.31859
  • % chg. over the last day: -0.17
  • Day’s range: 1.31792 – 1.32446
  • 52 wk range: 1.2949 – 1.4669

The USD/CAD currency pair has been growing again. Quotes have updated local highs. Currently, the loonie is consolidating in the range of 1.3220-1.3245. The Canadian dollar is under pressure due to the negative dynamics of oil prices. Investors have taken a wait-and-see attitude before today’s Bank of Canada meeting. Experts agree that the regulator will keep the key marks of monetary policy unchanged. Positions should be opened from key levels.

At 16:00 (GMT+2:00), the Bank of Canada will announce its decision on the key interest rate.

USD/CAD

Indicators signal the power of buyers: the price has fixed above 50 MA and 100 MA.

The MACD histogram is in the positive zone, which gives a signal to buy USD/CAD.

Stochastic Oscillator is in the overbought zone, the %K line has crossed the %D line. There are no signals at the moment.

Trading recommendations
  • Support levels: 1.3220, 1.3195, 1.3170
  • Resistance levels: 1.3245, 1.3300

If the price fixed above 1.3245, further growth in USD/CAD quotes is expected. The movement is tending to the round level of 1.3300.

An alternative could be a decline in the USD/CAD currency pair to 1.3190-1.3170.

The USD/JPY currency pair

Technical indicators of the currency pair:
  • Prev Open: 104.840
  • Open: 104.470
  • % chg. over the last day: -0.40
  • Day’s range: 104.158 – 104.556
  • 52 wk range: 101.19 – 112.41

The USD/JPY currency pair continues to show a negative trend. The trading instrument has updated monthly lows. The demand for safe assets has grown significantly. At the moment, USD/JPY quotes are testing the level of 104.15. The level of 104.40 is already a “mirror” resistance. The yen has the potential for further growth against the greenback. We recommend paying attention to the dynamics of US government bonds yield. Positions should be opened from key levels.

The news feed for Japan’s economy is calm.

USD/JPY

Indicators signal the power of sellers: the price has fixed below 50 MA and 100 MA.

The MACD histogram is in the negative zone, which indicates the bearish sentiment.

Stochastic Oscillator is in the neutral zone, the %K line has crossed the %D line. There are no signals at the moment.

Trading recommendations
  • Support levels: 104.15, 104.00, 103.70
  • Resistance levels: 104.40, 104.55, 104.65

If the price fixes below 104.15, a further fall in USD/JPY quotes is expected. The movement is tending to 103.80-103.60.

An alternative could be the growth of the USD/JPY currency pair to 104.60-104.90.

by JustForex


This article reflects a personal opinion and should not be interpreted as an investment advice, and/or offer, and/or a persistent request for carrying out financial transactions, and/or a guarantee, and/or a forecast of future events.

Quiet markets among uncertain backdrop

By Lukman Otunuga, Research Analyst, ForexTime

It’s a rather mixed market in this afternoon’s session which is perhaps to be expected ahead of the huge risk event next week across the pond. After yesterday’s deep selloff in risk assets yesterday, stocks are a touch softer today, bonds are firmer and there’s a bid for JPY, which we looked at this morning.

The Dollar is modestly weaker against its G10 peers while the ‘commodollars’ are better bid. With stimulus talks on the backburner, the incumbent is not seeing any late surge in polling support that propelled him into the Oval Office this time four years ago. A contested outcome nags at the back of many minds but Joe Biden is still out in front in both national polls and more importantly, the swing states which will determine the next commander-in-chief.

More immediately, the pandemic is occupying the market and the tough winter months ahead, especially in Europe. Volatility is creeping higher and the risk environment remains delicate, even if we know the prospects for fiscal relief are very high after the election .We’ve had mixed news on the data front to add to this uncertainty with US consumer confidence disappointing, while durable goods figures continue to show improvements in business investments with the headline figures rising for the fifth straight month.

Gold coiling, waiting for catalyst

The yellow metal continues to struggle for direction, trading in a tight range over the past few weeks. Last weeks move higher was capped by the previous high at $1933 but prices remain well supported by the 100-day Moving Average now just below $1900 and the six-month uptrend support line.

With momentum indicators firmly in neutral mode, we await the trigger for a break. What we know for certain is that the more prices trade in a tight range and contract, the more the breakout will be expansive!

Disclaimer: The content in this article comprises personal opinions and should not be construed as containing personal and/or other investment advice and/or an offer of and/or solicitation for any transactions in financial instruments and/or a guarantee and/or prediction of future performance. ForexTime (FXTM), its affiliates, agents, directors, officers or employees do not guarantee the accuracy, validity, timeliness or completeness, of any information or data made available and assume no liability as to any loss arising from any investment based on the same.


Forex-Time-LogoArticle by ForexTime

ForexTime Ltd (FXTM) is an award winning international online forex broker regulated by CySEC 185/12 www.forextime.com

Bullish Yen through year-end

By Han Tan, Market Analyst, ForexTime

Since the end of August, the Japanese Yen has strengthened against all of its G10 peers, indicating that markets are paring back their risk exposures. And the options market suggests there could be more gains for the JPY as we enter the final stretch of what has certainly been a tumultuous year.

Such expectations are captured in the uptrend evident in the FXTM Japanese Yen index, which reflects the JPY’s performance against a basket of six major currencies, namely the US Dollar, Euro, Pound, Australian Dollar, New Zealand Dollar, and the Swiss Franc, all evenly-weighted. After registering its lowest level since 2019 on August 31st, this index has gained about 3.2 percent and is trading well above its 50-day simple moving average.

Compared to all other G10 currencies, markets appear most bullish on the Japanese Yen for the remainder of the year, judging by the positioning in the 25-delta risk reversals. Investors are well aware that November features major event risks such as the US presidential elections and also the final stretch of post-Brexit trade negotiations, and that both events have the potential to deliver outsized shocks across global markets. Coupled with the troubling resurgence of Covid-19 across the US and Europe, a phenomenon which threatens to derail the global economic recovery, no surprise then that demand for the safe haven Yen has been rising of late.

A rising tide of risk aversion over the coming weeks could see the FXTM JPY index breaking above the 103.317 mark for the first time since June, with a higher high adding further confirmation to its uptrend.

BOJ expected to hold policy rate

Keep in mind that the Bank of Japan is set to announce its latest monetary policy decision on Thursday, although the central bank is expected to leave things unchanged. The second wave of Covid-19 cases in Japan is abating, allowing the country to resume its economic recovery which diminishing the need for more financial support.

Still, any revisions to the BOJ’s GDP and inflation outlooks for fiscal 2020 will be closely monitored to assess the state of the world’s third-largest economy, and any major shift in expectations could be reflected in the JPY’s performance this week.

The downtrend in USDJPY is still very much intact, with the 50-day SMA guiding the currency pair downwards. USDJPY could retest the 104.0 psychological level over the coming days, especially if the US Dollar resumes its weakening bias once there’s more certainty after the US presidential elections.

Disclaimer: The content in this article comprises personal opinions and should not be construed as containing personal and/or other investment advice and/or an offer of and/or solicitation for any transactions in financial instruments and/or a guarantee and/or prediction of future performance. ForexTime (FXTM), its affiliates, agents, directors, officers or employees do not guarantee the accuracy, validity, timeliness or completeness, of any information or data made available and assume no liability as to any loss arising from any investment based on the same.


Forex-Time-LogoArticle by ForexTime

ForexTime Ltd (FXTM) is an award winning international online forex broker regulated by CySEC 185/12 www.forextime.com

Dollar Firms on Rising Coronavirus Cases in the US

By Orbex

EURUSD Dips Closer Back To 1.1800

The common currency is trading weaker on Monday, largely due to a slightly higher greenback.

Price action continues to ease lower with intraday lows trading just a few pips off the 1.1800 handle.

Continued declines could see the 1.1800 level of support being tested once again.

However, the lower high following the recent rebound off 1.1800 signals caution.

A breakdown below 1.1800 could see price action pushing lower and potentially shifting the short term trend.

GBPUSD Holds The Range Between 1.3122 & 1.3000

The British pound sterling drifted lower on Monday as intraday prices briefly tested the 1.3000 handle.

However, price action remains volatile around this level.

The Stochastics oscillator is oversold and could signal a short term move to the upside.

Meanwhile, price action is on track to close bearish for the third consecutive daily session. Still, prices remain well within the range from last Wednesday.

As a result, only a bearish close below 1.2944 could spell further declines.

For the moment, the bias remains mixed.

WTI Crude Oil Loses The 38.83 Floor Again

Oil prices are trading bearish, as the sentiment shifts to the downside.

The rising number of coronavirus cases in the US once again dampens the outlook for demand.

As a result, oil prices slipped below the 38.83 floor that held up previously.

The breakdown below this level is, however, gradual. This could mean that price could once again creep back higher to continue with the sideways trend.

If the current bearish momentum continues, oil prices could be testing the 2nd October lows near 37.

Gold Trades Muted Despite Bearish Market Sentiment

The precious metal is attempting to make some recovery, but price action remains broadly muted.

This comes even as the US equity markets are trading in the red on Monday.

With no clear progress on the stimulus bill and the dollar firming, gold prices are in check.

For the moment, the consolidation near the 1900 – 1911.50 level continues.

To the downside, a soft support is near the 1890 handle.

A close below 1890 could signal a shift for further declines in price action. This could potentially open the way for a move to the 1850 handle next.

By Orbex

Japanese Candlesticks Analysis 27.10.2020 (GOLD, NZDUSD, GBPUSD)

Article By RoboForex.com

XAUUSD, “Gold vs US Dollar”

As we can see in the H4 chart, the pair is finishing the correction within the rising tendency. After forming another Hammer pattern not far from the support area, XAUUSD may reverse and move towards the next upside target at the resistance area at 1945.00. At the same time, an opposite scenario implies that the price may start another decline with the target at 1885.50 before resuming the uptrend.

XAUUSD
Risk Warning: the result of previous trading operations do not guarantee the same results in the future

NZDUSD, “New Zealand vs. US Dollar”

As we can see in the H4 chart, the uptrend continues. After forming several reversal patterns, such as Shooting Star, not far from the channel’s upside border, NZDUSD may reverse and resume moving downwards to reach the channel’s downside border. The next downside target may be the support area at 0.6575. Still, an alternative scenario says that the pair may continue trading upwards to reach 0.6745 without reversing and correcting.

NZDUSD
Risk Warning: the result of previous trading operations do not guarantee the same results in the future

GBPUSD, “Great Britain Pound vs US Dollar”

As we can see in the H4 chart, the ascending tendency continues. By now, GBPUSD has formed several reversal patterns, such as Hammer, not far from the support area. At the moment, the pair is reversing and may later grow with the target at 1.3225. However, despite the current uptrend, there might be another scenario, according to which the price may fall and correct to reach 1.2920 without reversing.

GBPUSD

Article By RoboForex.com

Attention!
Forecasts presented in this section only reflect the author’s private opinion and should not be considered as guidance for trading. RoboForex LP bears no responsibility for trading results based on trading recommendations described in these analytical reviews.
Ichimoku Cloud Analysis 27.10.2020 (NZDCHF, GBPAUD, USDCNH)

Article By RoboForex.com

NZDCHF, “New Zealand Dollar vs Swiss Franc”

NZDCHF is trading at 0.6067; the instrument is moving above Ichimoku Cloud, thus indicating an ascending tendency. The markets could indicate that the price may test Tenkan-Sen and Kijun-Sen at 0.6040 and then resume moving upwards to reach 0.6140. Another signal in favor of further uptrend will be a rebound from the descending channel’s upside border. However, the bullish scenario may no longer be valid if the price breaks the cloud’s downside border and fixes below 0.5975. In this case, the pair may continue falling towards 0.5885.

NZDCHF
Risk Warning: the result of previous trading operations do not guarantee the same results in the future

GBPAUD, “Great Britain Pound vs Australian Dollar”

GBPAUD is trading at 1.8267; the instrument is moving inside Ichimoku Cloud, thus indicating a sideways tendency. The markets could indicate that the price may test the cloud’s downside border at 1.8255 and then resume moving upwards to reach 1.8665. Another signal in favor of further uptrend will be a rebound from the rising channel’s downside border. However, the bullish scenario may no longer be valid if the price breaks the cloud’s downside border and fixes below 1.8170. In this case, the pair may continue falling towards 1.8085. To confirm further growth, the asset must break the cloud’s upside border and fix above 1.8425.

GBPAUD
Risk Warning: the result of previous trading operations do not guarantee the same results in the future

USDCNH, “US Dollar vs Chinese Yuan”

USDCNH is trading at 6.6877; the instrument is moving inside Ichimoku Cloud, thus indicating a sideways tendency. The markets could indicate that the price may test the cloud’s upside border at 6.6885 and then resume moving downwards to reach 6.6205. Another signal in favor of further downtrend will be a rebound from the descending channel’s upside border. However, the bearish scenario may no longer be valid if the price breaks the cloud’s upside border and fixes above 6.7085. In this case, the pair may continue growing towards 6.7175. To confirm further decline, the asset must break the rising channel’s downside border and fix below 6.6625.

USDCNH

Article By RoboForex.com

Attention!
Forecasts presented in this section only reflect the author’s private opinion and should not be considered as guidance for trading. RoboForex LP bears no responsibility for trading results based on trading recommendations described in these analytical reviews.
The Dollar Index Is Consolidating. Investors Expect Additional Drivers

by JustForex

The US dollar shows ambiguous results against a basket of world currencies. The dollar index (#DX) is consolidating in the range of 92.87-93.10. Investors have taken a wait-and-see attitude before the US presidential election, which is scheduled for November 3. The new wave of COVID-19 continues to impact the global economy negatively. At the moment, the number of infected in the world has approached 43.5 million. Some countries have introduced new restrictive measures.

Financial market participants also expect meetings of the Bank of Canada, Bank of Japan and the ECB later this week. Experts agree that regulators will keep the key marks of monetary policy at the same level. We recommend paying attention to the comments by the representatives of the Central Banks. Today, traders will be focused on economic releases from the US.

The “black gold” prices have been growing. At the moment, futures for the WTI crude oil are testing the $39.00 mark per barrel. At 22:30 (GMT+2:00), API weekly US crude oil stock will be published.

Market indicators

Yesterday, there were aggressive sales in the US stock market: #SPY (-1.85%), #DIA (-2.24%), #QQQ (-1.50%).

The 10-year US government bonds yield has become stable after a sharp drop the day before. At the moment, the indicator is at the level of 0.79-0.80%.

The news feed for 2020.10.27:
  • – Durable goods orders in the US at 14:30 (GMT+2:00);
  • – US consumer confidence index at 16:00 (GMT+2:00).

by JustForex


This article reflects a personal opinion and should not be interpreted as an investment advice, and/or offer, and/or a persistent request for carrying out financial transactions, and/or a guarantee, and/or a forecast of future events.

Technical Outlook: Risk-off mood likely to favour Yen

By Lukman Otunuga, Research Analyst, ForexTime

A tidal wave of risk aversion threatens to engulf financial markets as new coronavirus cases surge in the United States and Europe. On top of this, the US stimulus saga and uncertainty it presents continues to drain investor confidence – ultimately fuelling the risk-off vibe.

Our currency spotlight this week shines on the Japanese Yen which has been labelled a trader’s best friend in times of uncertainty. However, Yen bulls seem to be missing in action this morning despite the gloomy mood. Although the currency has weakened against most G10 majors excluding the Dollar, the Yen still has a shot at the throne if risk aversion intensifies ahead of the US election on November 3rd.

Focusing on the technicals, the return of risk aversion may present opportunities on various Yen crosses. Yesterday we covered the USDJPY on the weekly charts and identified key levels of support and resistance.

Our focus today will revolve around the daily timeframes and possible setups ahead of the US election.

USDJPY pressured below 105.00

For as long as the USDJPY is unable to break above the 105.00 resistance level, prices may decline back towards 104.00. Prices are trading below the 20 Simple Moving Average while the MACD trades to the downside. If investors rush towards the Yen’s safe embrace, this may accelerate the decline towards 104.00.

EURJPY on standby

One just can’t help but feel that the EURJPY is waiting for a directional catalyst. Prices are trading within a wide range with support at 123.00 and resistance around 125.00. A breakout/down could be around the corner with the fundamentals potentially sparking the move. Should the Yen gain on risk aversion, this may drag the EURJPY towards 123.00 and 122.40, respectively.

GBPJPY breakout/down setup in play

It’s the same old story on the GBPJPY. Support can be found at 135.70 and resistance may be found around 137.90. A breakout/down from these key levels may set the tone for the GBPJPY in the medium term. Technicals are slowing bending in favour of bears as the MACD trades to the downside while prices are struggling to keep above the 100 Simple Moving Average. If the 135.70 support is conquered, the next key level of interest may be found around 134.40.

AUDJPY finds comfort in lower range

The AUDJPY is rangebound on the daily charts. Sustained weakness below the pivotal 75.50 level may open the doors towards 74.00 and potentially 72.60. Alternatively, a move back above 75.50 could trigger a move towards 77.00 and 78.50.

Disclaimer: The content in this article comprises personal opinions and should not be construed as containing personal and/or other investment advice and/or an offer of and/or solicitation for any transactions in financial instruments and/or a guarantee and/or prediction of future performance. ForexTime (FXTM), its affiliates, agents, directors, officers or employees do not guarantee the accuracy, validity, timeliness or completeness, of any information or data made available and assume no liability as to any loss arising from any investment based on the same.


Forex-Time-LogoArticle by ForexTime

ForexTime Ltd (FXTM) is an award winning international online forex broker regulated by CySEC 185/12 www.forextime.com

The Analytical Overview of the Main Currency Pairs on 2020.10.27

by JustForex

The EUR/USD currency pair

Technical indicators of the currency pair:
  • Prev Open: 1.18574
  • Open: 1.18085
  • % chg. over the last day: -0.36
  • Day’s range: 1.18064 – 1.18359
  • 52 wk range: 1.0637 – 1.2012

There is an ambiguous technical pattern on the EUR/USD currency pair. The trading instrument is consolidating. Financial market participants have taken a wait-and-see attitude before the US presidential elections, which are scheduled for November 3. Investors also expect the ECB meeting later this week. At the moment, the local support and resistance levels are 1.1795 and 1.1840, respectively. We recommend opening positions from these marks.

The news feed on 2020.10.27:
  • – Durable goods orders in the US at 14:30 (GMT+2:00);
  • – US consumer confidence index at 16:00 (GMT+2:00).
EUR/USD

Indicators do not give accurate signals: 50 MA has crossed 100 MA.

The MACD histogram is near the 0 mark. There are no signals at the moment.

Stochastic Oscillator is in the overbought zone, the %K line has crossed the %D line. There are no signals at the moment.

Trading recommendations
  • Support levels: 1.1795, 1.1760, 1.1730
  • Resistance levels: 1.1840, 1.1865, 1.1880

If the price fixes below 1.1795, EUR/USD quotes are expected to fall. The movement is tending to 1.1760-1.1730.

An alternative could be the growth of the EUR/USD currency pair to 1.1870-1.1900.

The GBP/USD currency pair

Technical indicators of the currency pair:
  • Prev Open: 1.30540
  • Open: 1.30192
  • % chg. over the last day: -0.35
  • Day’s range: 1.30133 – 1.30445
  • 52 wk range: 1.1409 – 1.3516

The GBP/USD currency pair is in a sideways trend. There is no defined trend. At the moment, the British pound is consolidating near the round level of 1.3000. The 1.3065 mark is the key resistance. Investors expect additional catalysts to set the tone for trading in the foreign exchange market in the coming days. We recommend paying attention to the news feed from the US. Positions should be opened from key levels.

The publication of important UK economic releases is not planned.

GBP/USD

Indicators do not give accurate signals: 50 MA has crossed 100 MA.

The MACD histogram is near the 0 mark. There are no signals at the moment.

Stochastic Oscillator is in the neutral zone, the %K line is below the %D line, which gives a signal to sell GBP/USD.

Trading recommendations
  • Support levels: 1.3000, 1.2970, 1.2920
  • Resistance levels: 1.3065, 1.3110, 1.3150

If the price fixes below the round level of 1.3000, further correction of the GBP/USD currency pair is expected. The movement is tending to 1.2960-1.2940.

An alternative could be the growth of GBP/USD quotes to 1.3100-1.3120.

The USD/CAD currency pair

Technical indicators of the currency pair:
  • Prev Open: 1.31255
  • Open: 1.32078
  • % chg. over the last day: +0.47
  • Day’s range: 1.31713 – 1.32123
  • 52 wk range: 1.2949 – 1.4669

Purchases prevail on the USD/CAD currency pair. The trading instrument has updated local highs. Currently, the loonie is testing the “mirror” support at 1.3175. The 1.3210 mark is the nearest resistance. The trading instrument has the potential for further growth. Today, we recommend paying attention to economic releases from the US, as well as the dynamics of “black gold” prices. Positions should be opened from key levels.

The news feed on Canada’s economy is calm.

USD/CAD

Indicators signal the power of buyers: the price has fixed above 50 MA and 100 MA.

The MACD histogram is in the positive zone, but below the signal line, which gives a weak signal to buy USD/CAD.

Stochastic Oscillator is in the oversold zone, the %K line has crossed the %D line. There are no signals at the moment.

Trading recommendations
  • Support levels: 1.3175, 1.3155, 1.3125
  • Resistance levels: 1.3210, 1.3235, 1.3255

If the price fixes above 1.3210, further growth in USD/CAD quotes is expected. The movement is tending to 1.3235-1.3260.

An alternative could be a decline in the USD/CAD currency pair to 1.3150-1.3125.

The USD/JPY currency pair

Technical indicators of the currency pair:
  • Prev Open: 104.656
  • Open: 104.840
  • % chg. over the last day: +0.12
  • Day’s range: 104.668 – 104.891
  • 52 wk range: 101.19 – 112.41

The technical pattern on the USD/JPY currency pair is still ambiguous. The trading instrument is consolidating. There is no defined trend. At the moment, the local support and resistance levels are 104.65 and 104.90, respectively. Financial market participants expect additional drivers. We recommend paying attention to the dynamics of US government bonds yield. Positions should be opened from key levels.

The news feed for Japan’s economy is calm.

USD/JPY

Indicators do not give accurate signals: the price has crossed the 50 MA and 100 MA.

The MACD histogram is near the 0 mark. There are no signals at the moment.

Stochastic Oscillator is in the neutral zone, the %K line is above the %D line, which indicates the bullish sentiment.

Trading recommendations
  • Support levels: 104.65, 104.55, 104.40
  • Resistance levels: 104.90, 105.05, 105.30

If the price fixes below 104.65, USD/JPY quotes are expected to fall. The movement is tending to 104.40-104.10.

An alternative could be the growth of the USD/JPY currency pair to 105.20-105.40.

by JustForex


This article reflects a personal opinion and should not be interpreted as an investment advice, and/or offer, and/or a persistent request for carrying out financial transactions, and/or a guarantee, and/or a forecast of future events.