Archive for Forex and Currency News – Page 346

The Week Ahead: Take It Or Leave It

By Orbex

GBPCHF Consolidates as Brexit Deadline Looms
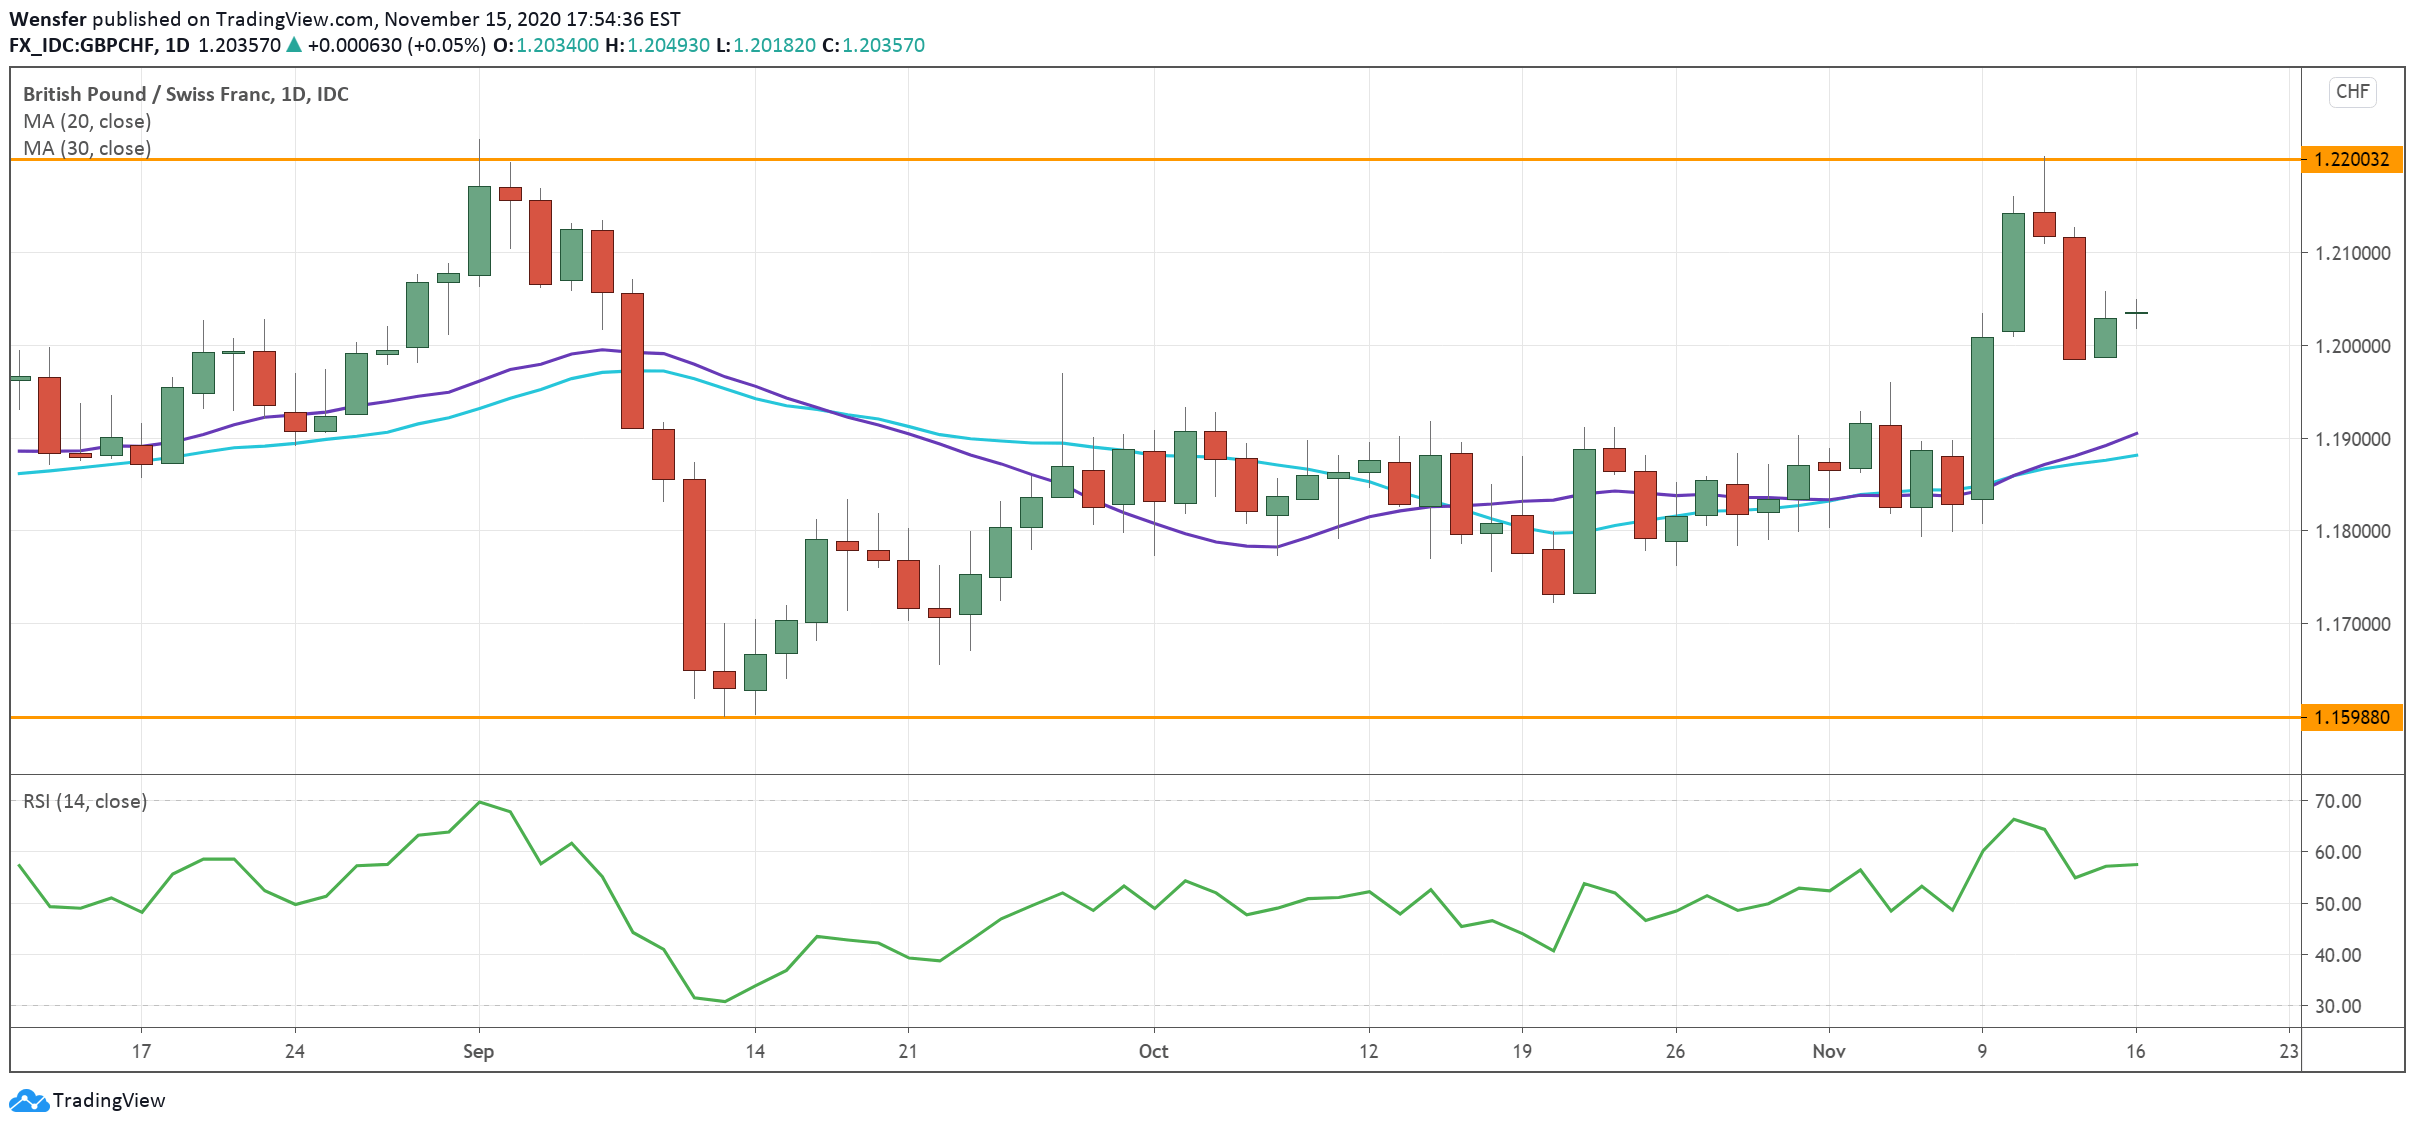
Pressure mounts as Brexit negotiations go into its crucial week. A deal must be reached by the end of November so the EU could pass it into legislation before the end of the transition period in January.

The European Council is scheduled to discuss the divorce on Thursday, and an agreement, or the lack of it, could turn the market upside down. There is still a risk of another breakdown and it would not be surprising to see an extension to the deadline.

In this case, the Sterling could give back its recent gains. The pound has fallen back from the previous high of 1.2200. 1.1600 is the lower band of the consolidation range.

USDCAD Recovers on Profit-Taking
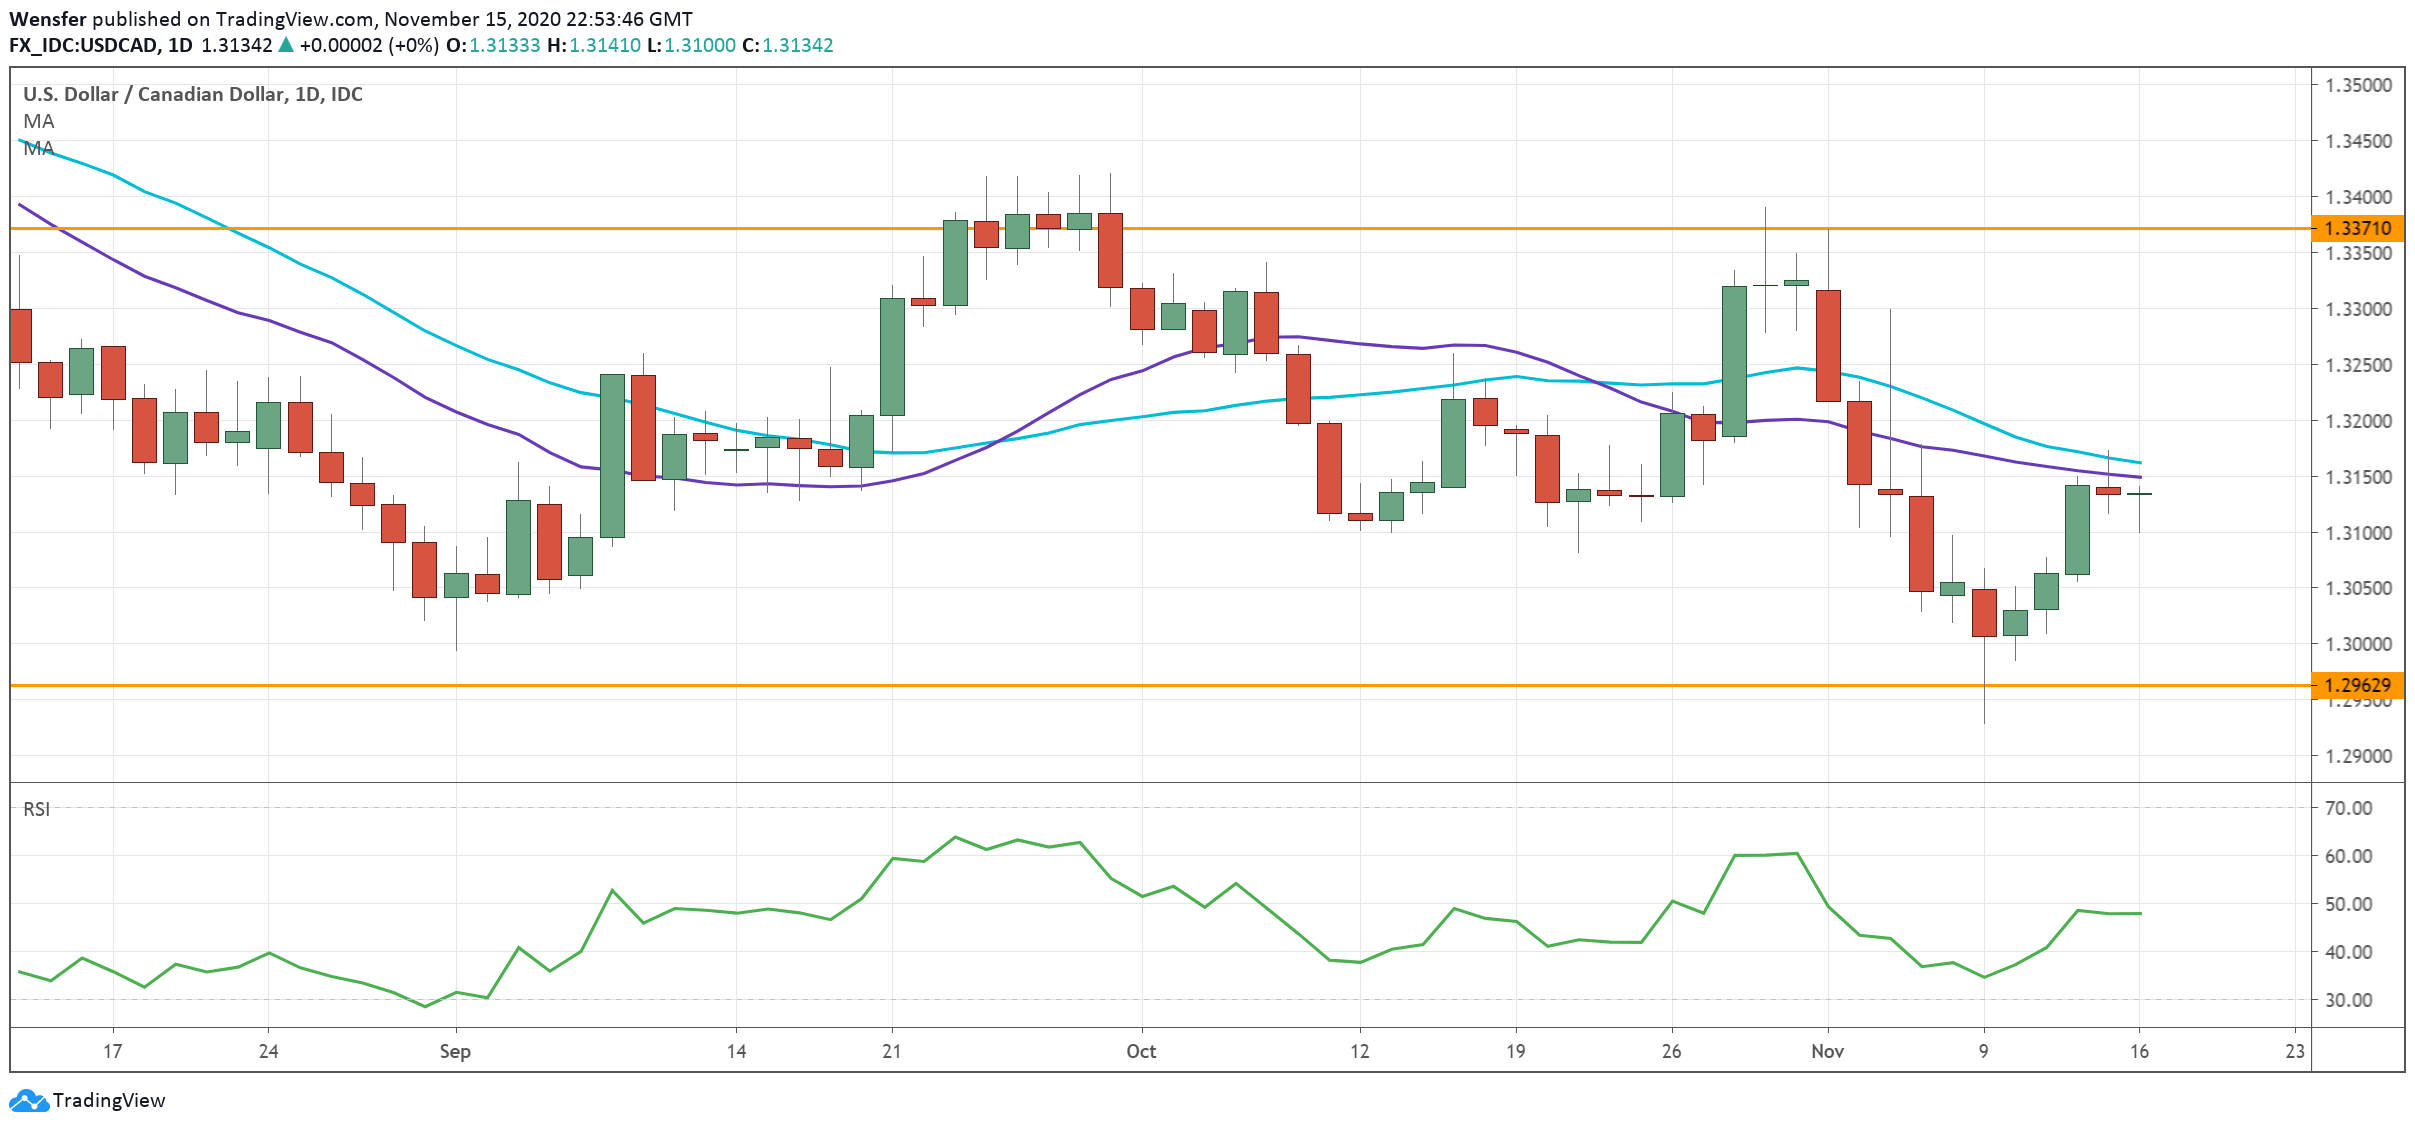
The US dollar has bounced back from its 10-month low as sellers took some chips off the table. The election-themed USD trade might be over as Biden cemented his victory with a flip in Arizona.

Investors have shifted their attention to the readiness of the vaccine after a preliminary surge of enthusiasm. More positive headlines would mean global trade could resume sooner which would favour the commodity-linked loonie.

In the meantime, this week’s inflation and retail sales may offer intraday volatility. The US dollar is rallying towards the resistance of 1.3370, while ast January’s low of 1.2960 is a critical support to monitor.

EURNZD Tanks as RBNZ Downplays Negative Rates
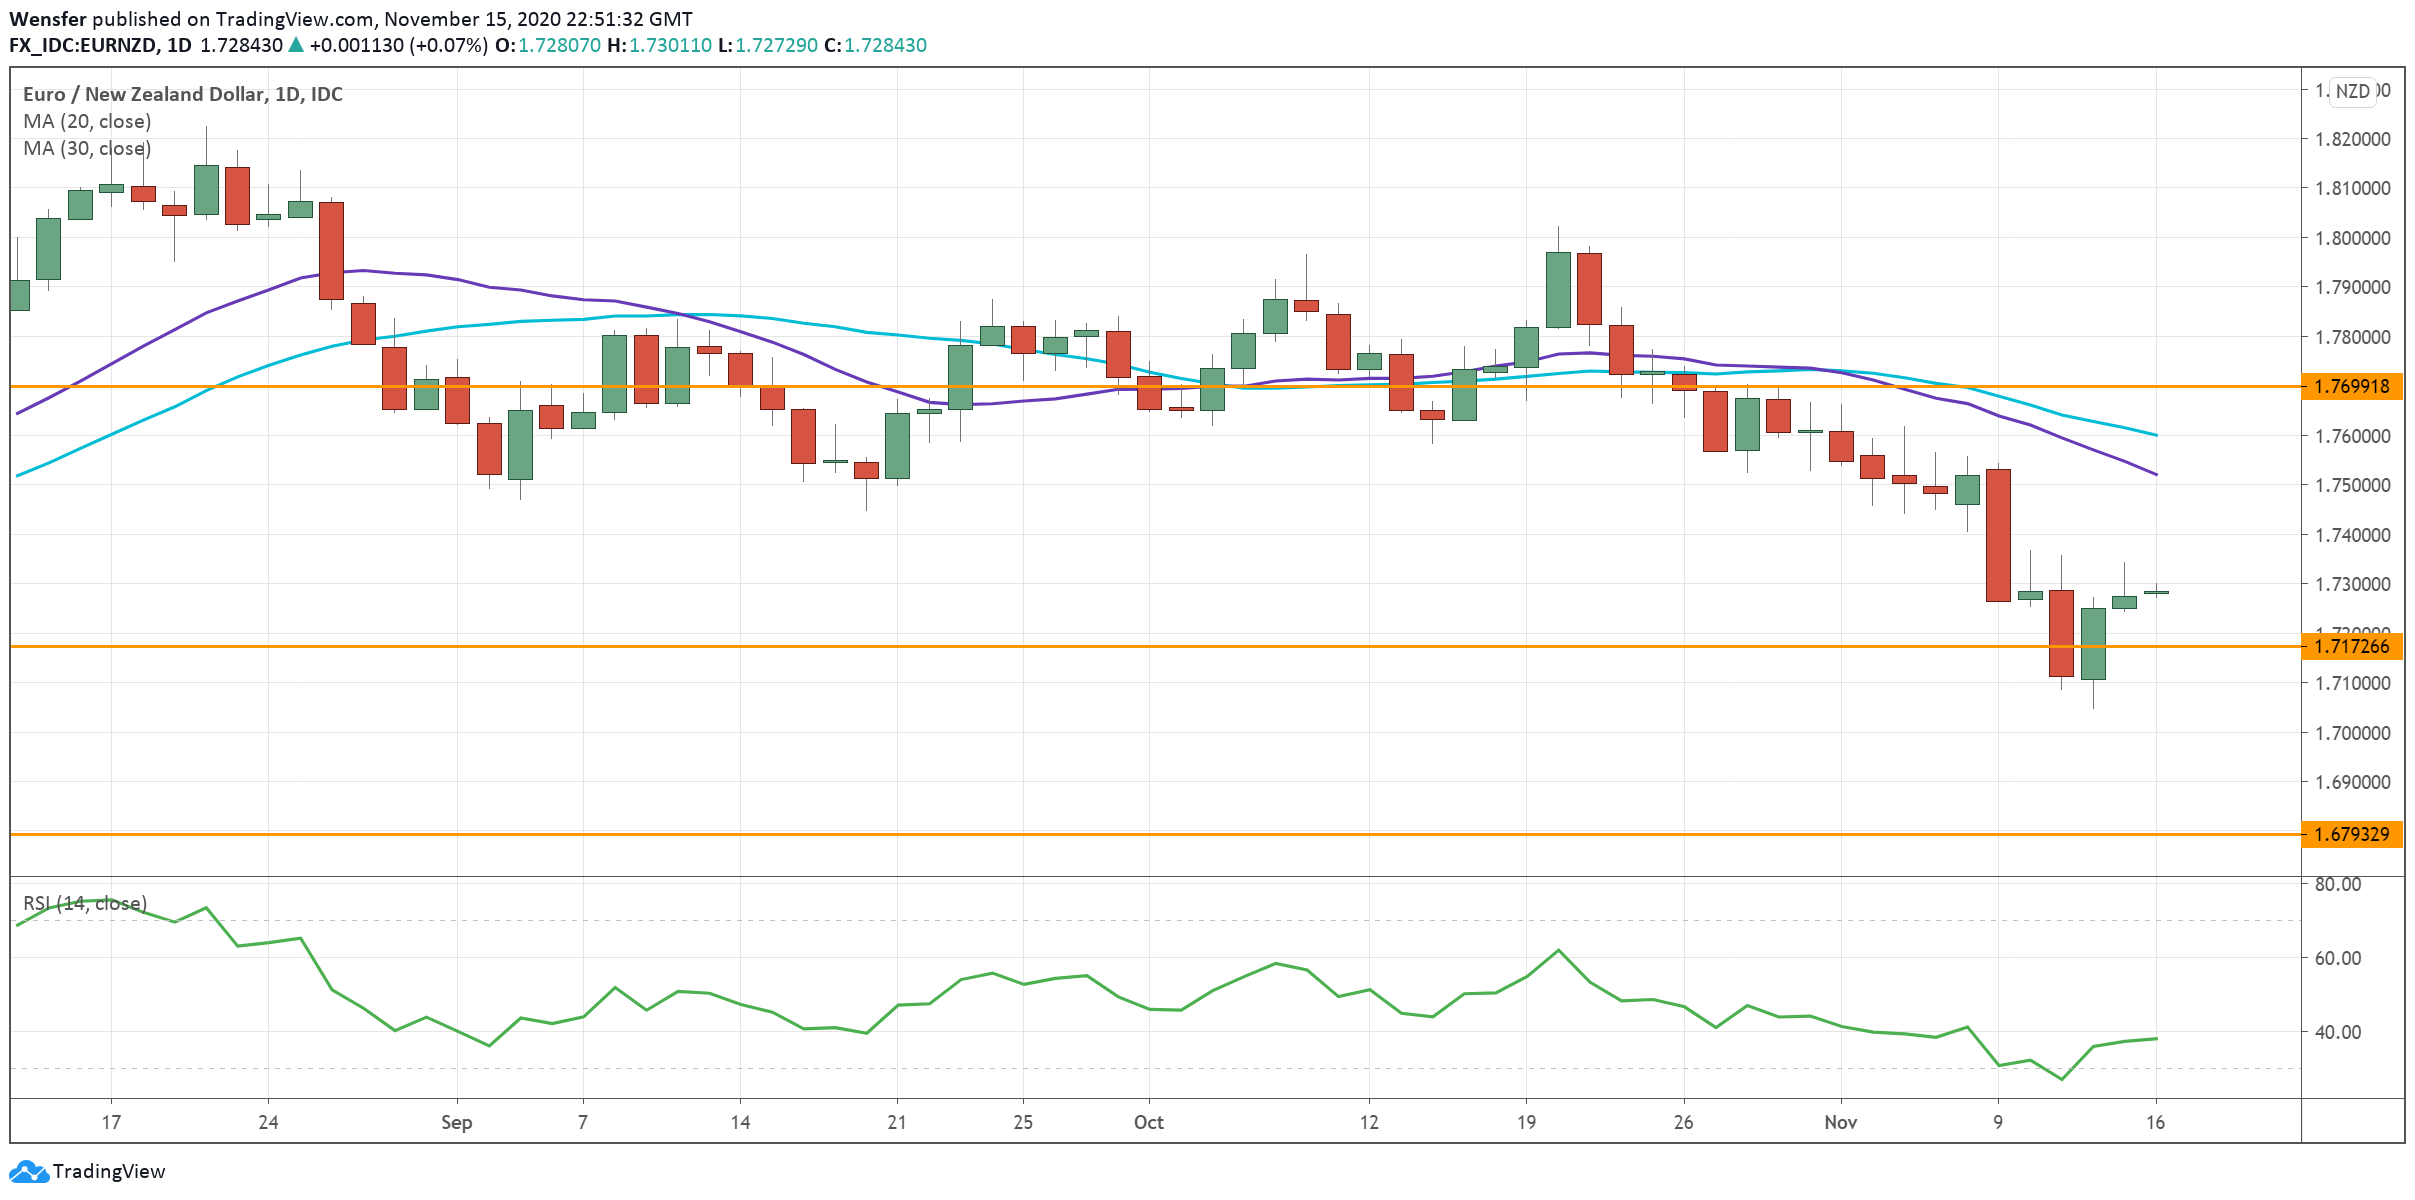
The New Zealand dollar saw a surge in buying interest after a rather hawkish outlook from RBNZ’s meeting last week.

Recognising latest positive development in the economy, the central bank has lifted its interest rate forecast from its statement back in August. This revision means that policymakers would most likely steer away from the much-anticipated negative rates.

As markets price in the bullish U-turn, the kiwi may continue to gain traction as short sides cover their positions. The euro has broken below July’s low of 1.7170, and the sell-off may extend towards 1.67. On the upside, 1.7700 is the immediate resistance level.

AUDJPY Rises as Sentiment Improves

Following the announcement of progress in the Covid-19 vaccine, market optimism has propelled the Australian dollar to recent highs across the board.

As risk-on sentiment brews, the contrast cannot be sharper between a growth-sensitive aussie and a safe haven Japanese yen. The former may not suffer from Reserve Bank’s expanded QE programme since loose monetary policy has become the norm elsewhere.

Its proximity to China’s recovery, however, may help it stand out as demand in commodities picks up again. The pair has rallied above the resistance of 76.50 with the September high of 78.40 as the next target.

By Orbex

Ichimoku Cloud Analysis 16.11.2020 (EURJPY, NZDUSD, BTCUSD)

Article By RoboForex.com

EURJPY, “Euro vs Japanese Yen”

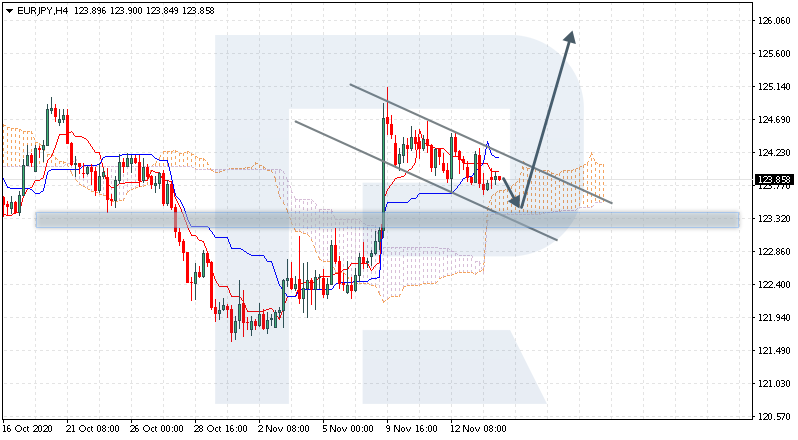
EURJPY is trading at 123.85; the instrument is moving above Ichimoku Cloud, thus indicating an ascending tendency. The markets could indicate that the price may test the cloud’s downside border at 123.45 and then resume moving upwards to reach 125.65. Another signal in favor of further uptrend will be a rebound from the support level. However, the bullish scenario may no longer be valid if the price breaks the cloud’s downside border and fixes below 122.95. In this case, the pair may continue falling towards 121.95. To confirm further growth, the asset must break the upside border of a Flag pattern and fix above 124.55.

EURJPY
Risk Warning: the result of previous trading operations do not guarantee the same results in the future

NZDUSD, “New Zealand Dollar vs US Dollar”

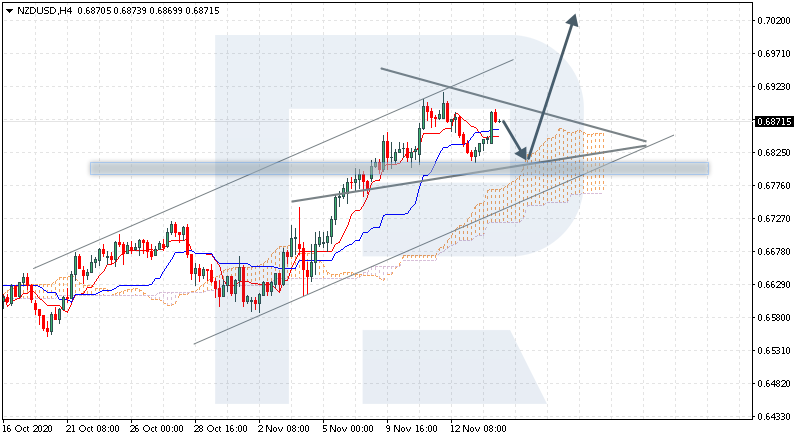
NZDUSD is trading at 0.6871; the instrument is moving above Ichimoku Cloud, thus indicating an ascending tendency. The markets could indicate that the price may test the cloud’s upside border at 0.6820 and then resume moving upwards to reach 0.7025. Another signal in favor of further uptrend will be a rebound from the downside border of the Triangle pattern. However, the bullish scenario may be canceled if the price breaks the cloud’s downside border and fixes below 0.6705. In this case, the pair may continue falling towards 0.6615. To confirm further growth, the asset must break the pattern’s upside border and fix above 0.6920.

NZDUSD
Risk Warning: the result of previous trading operations do not guarantee the same results in the future

BTCUSD, “Bitcoin vs US Dollar”

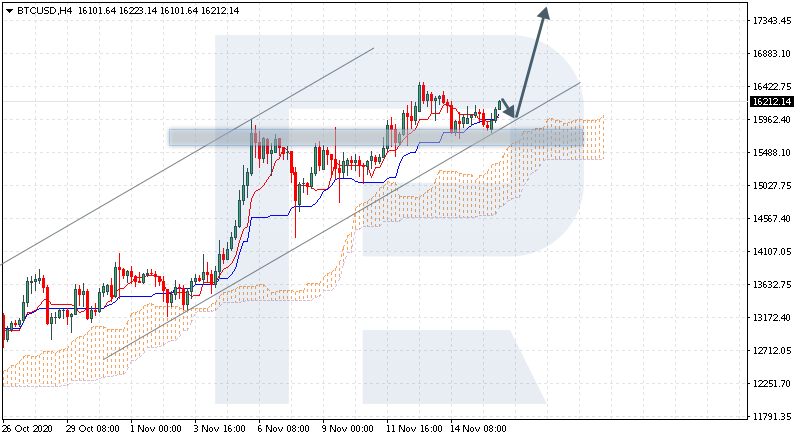
BTCUSD is trading at 16212.00; the instrument is moving above Ichimoku Cloud, thus indicating an ascending tendency. The markets could indicate that the price may test Tenkan-Sen and Kijun-Sen at 15965.00 and then resume moving upwards to reach 17345.00. Another signal in favor of further uptrend will be a rebound from the rising channel’s downside border. However, the bullish scenario may no longer be valid if the price breaks the cloud’s downside border and fixes below 14550.00. In this case, the pair may continue falling towards 13605.00.

BTCUSD

Article By RoboForex.com

Attention!
Forecasts presented in this section only reflect the author’s private opinion and should not be considered as guidance for trading. RoboForex LP bears no responsibility for trading results based on trading recommendations described in these analytical reviews.

Forex Technical Analysis & Forecast 16.11.2020

Article By RoboForex.com

EURUSD, “Euro vs US Dollar”

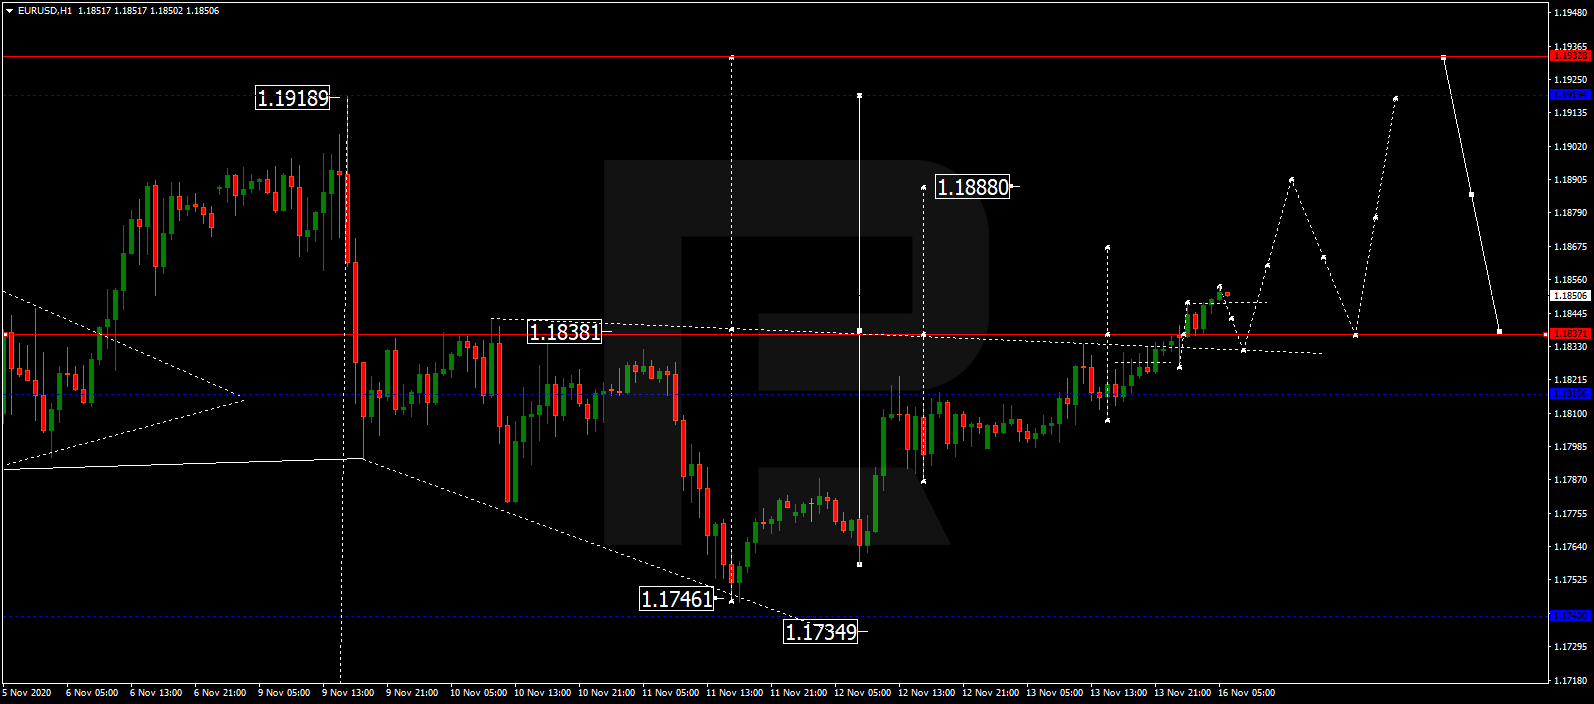
After completing the ascending wave at 1.1830 and then forming another consolidation range around this level, EURUSD has broken the range upwards and may later continue growing to reach 1.1880. After that, the instrument may correct towards 1.1840 and then start a new growth with the target at 1.1917 or even reach 1.1930.

EURUSD
Risk Warning: the result of previous trading operations do not guarantee the same results in the future

GBPUSD, “Great Britain Pound vs US Dollar”

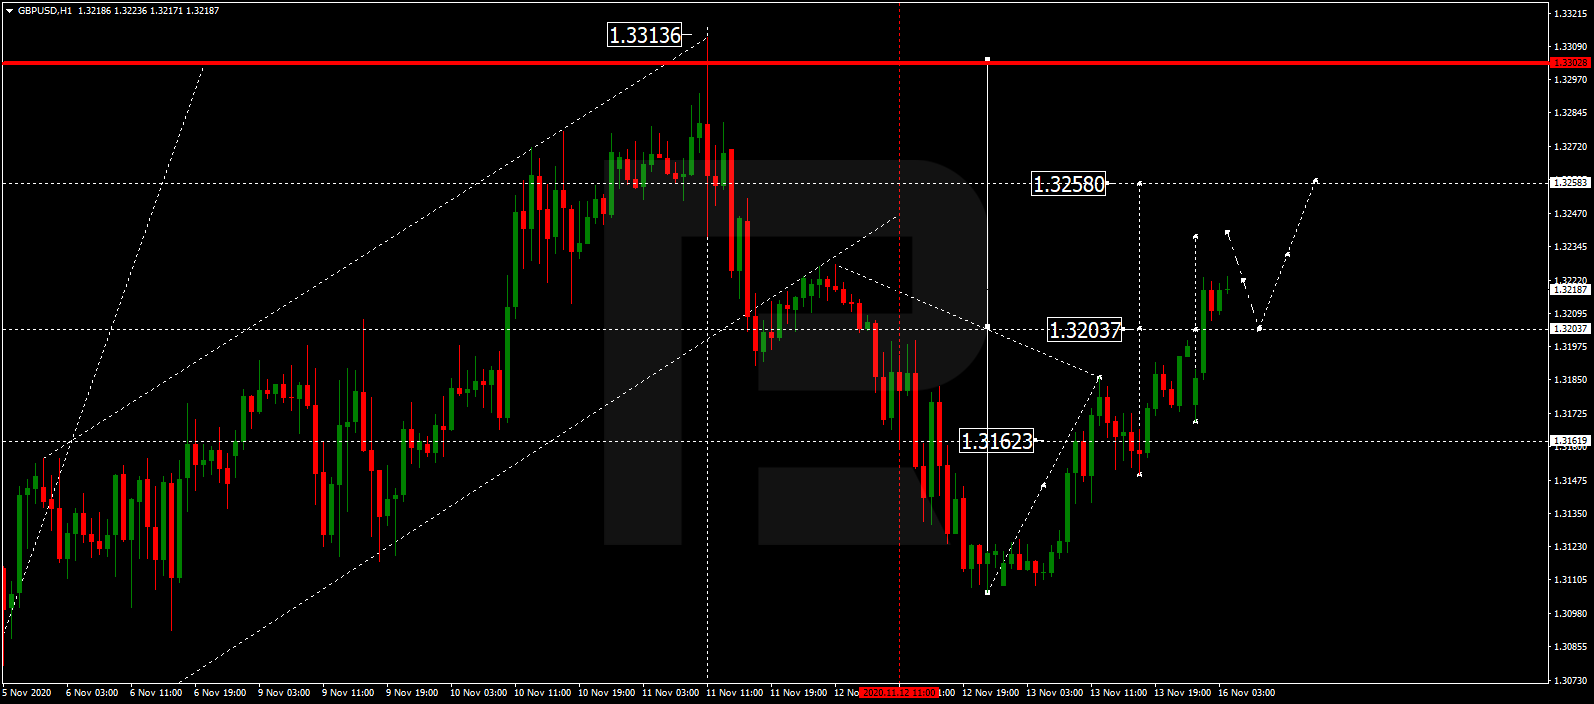
After finishing the ascending wave at 1.3203 and then forming a new consolidation range around this level, GBPUSD has broken the range upwards and may later continue growing to reach 1.3258. After that, the instrument may correct to return to 1.3203 and then resume trading upwards with the target at 1.3300.

GBPUSD
Risk Warning: the result of previous trading operations do not guarantee the same results in the future

USDRUB, “US Dollar vs Russian Ruble”

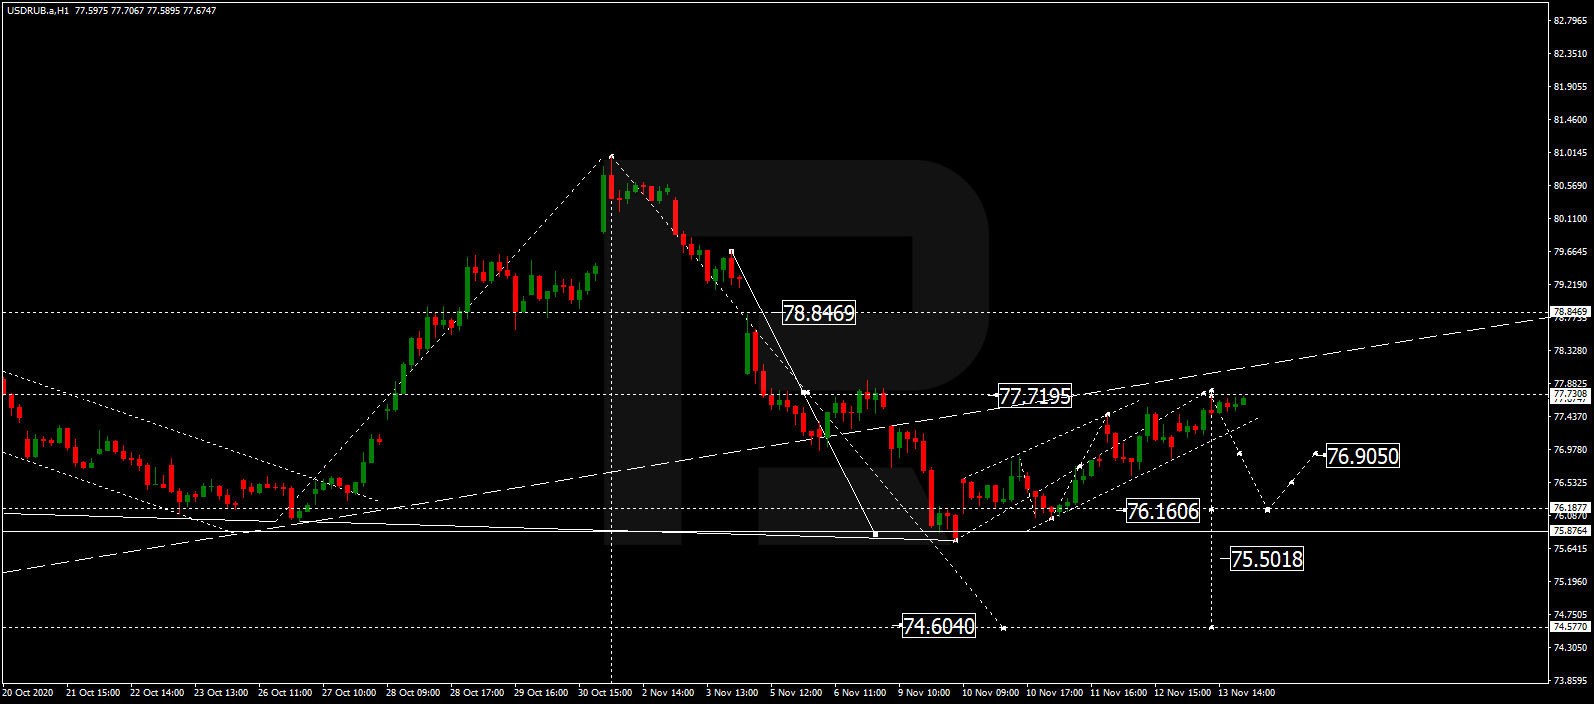
USDRUB has finished the ascending wave at 77.66. Possibly, today the pair may fall to reach 76.16 and then grow towards 76.90, thus forming a new consolidation range around the latter level. If later the price breaks this range to the downside, the market may start another decline with the target at 75.00 or even reach 74.60.

USDRUB
Risk Warning: the result of previous trading operations do not guarantee the same results in the future

USDJPY, “US Dollar vs Japanese Yen”

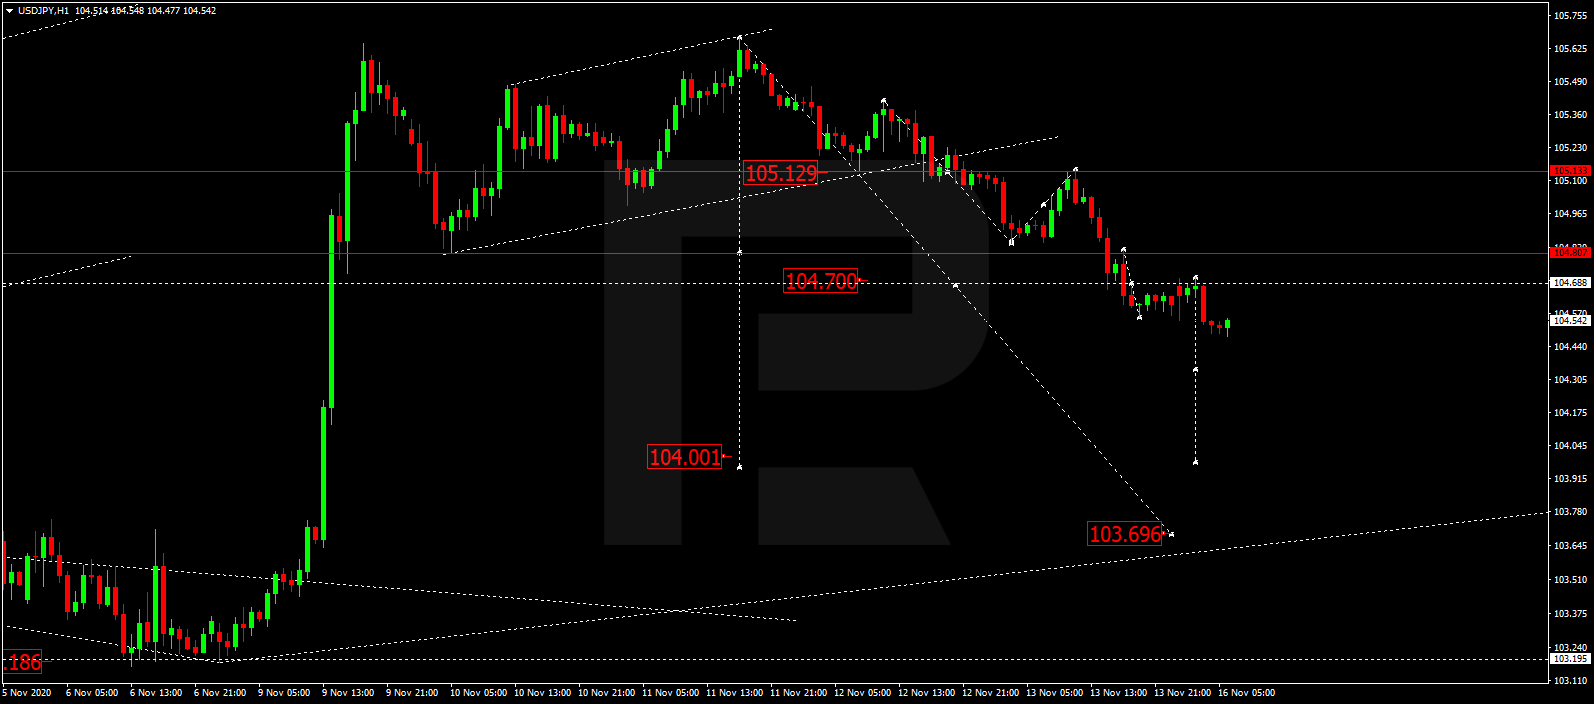
After rebounding from 105.12 and then reaching 104.70, USDJPY has formed a new consolidation range around the latter level just to break it to the downside. Possibly, the pair may continue moving downwards towards 103.70. Later, the market may start another correction to return to 104.70 and then form a new descending structure with the target at 102.50.

USDJPY
Risk Warning: the result of previous trading operations do not guarantee the same results in the future

USDCHF, “US Dollar vs Swiss Franc”

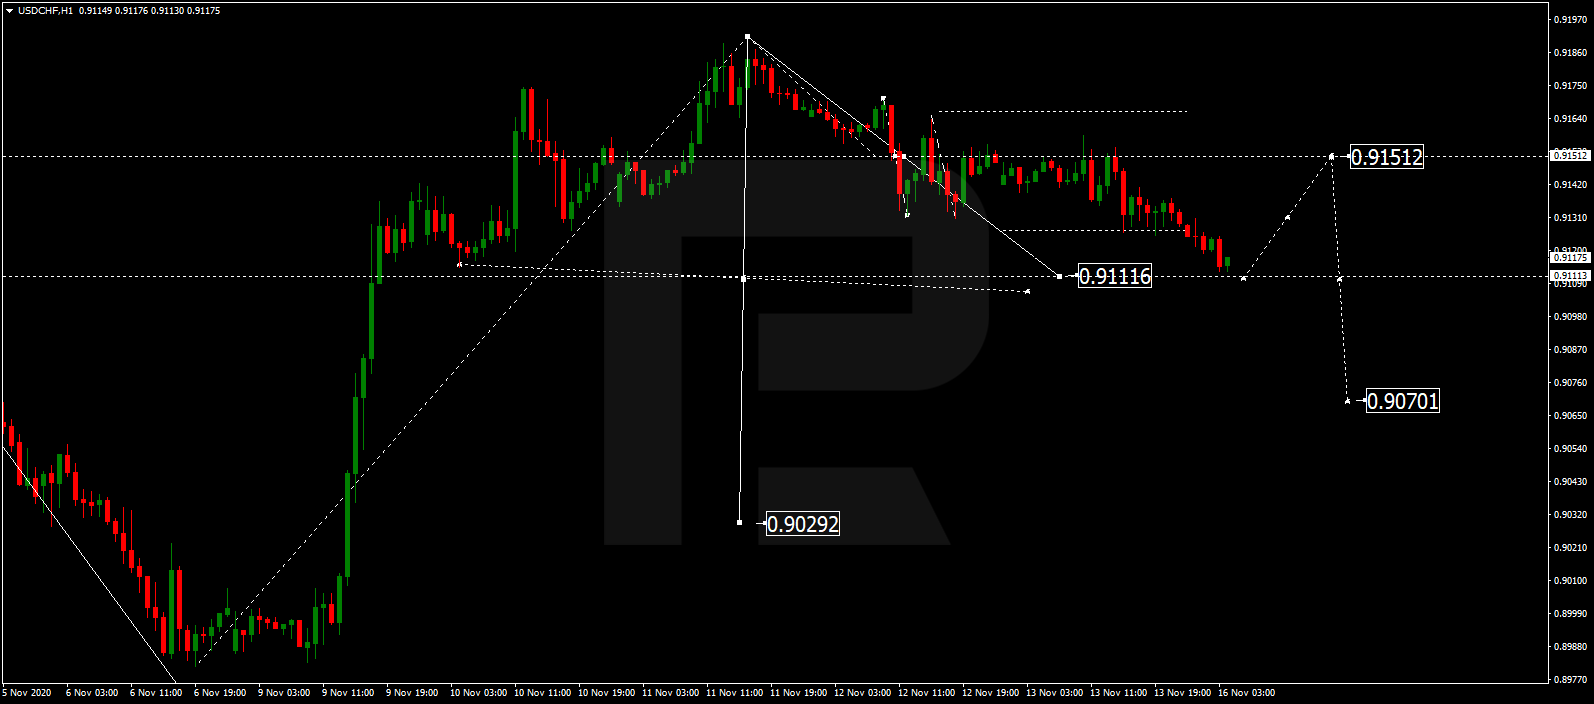
USDCHF is falling towards 0.9111 and may later grow to reach 0.9151, thus forming a new consolidation range between these two levels. If the price breaks this range to the downside, the market may continue the correction with the target at 0.9070.

USDCHF
Risk Warning: the result of previous trading operations do not guarantee the same results in the future

AUDUSD, “Australian Dollar vs US Dollar”

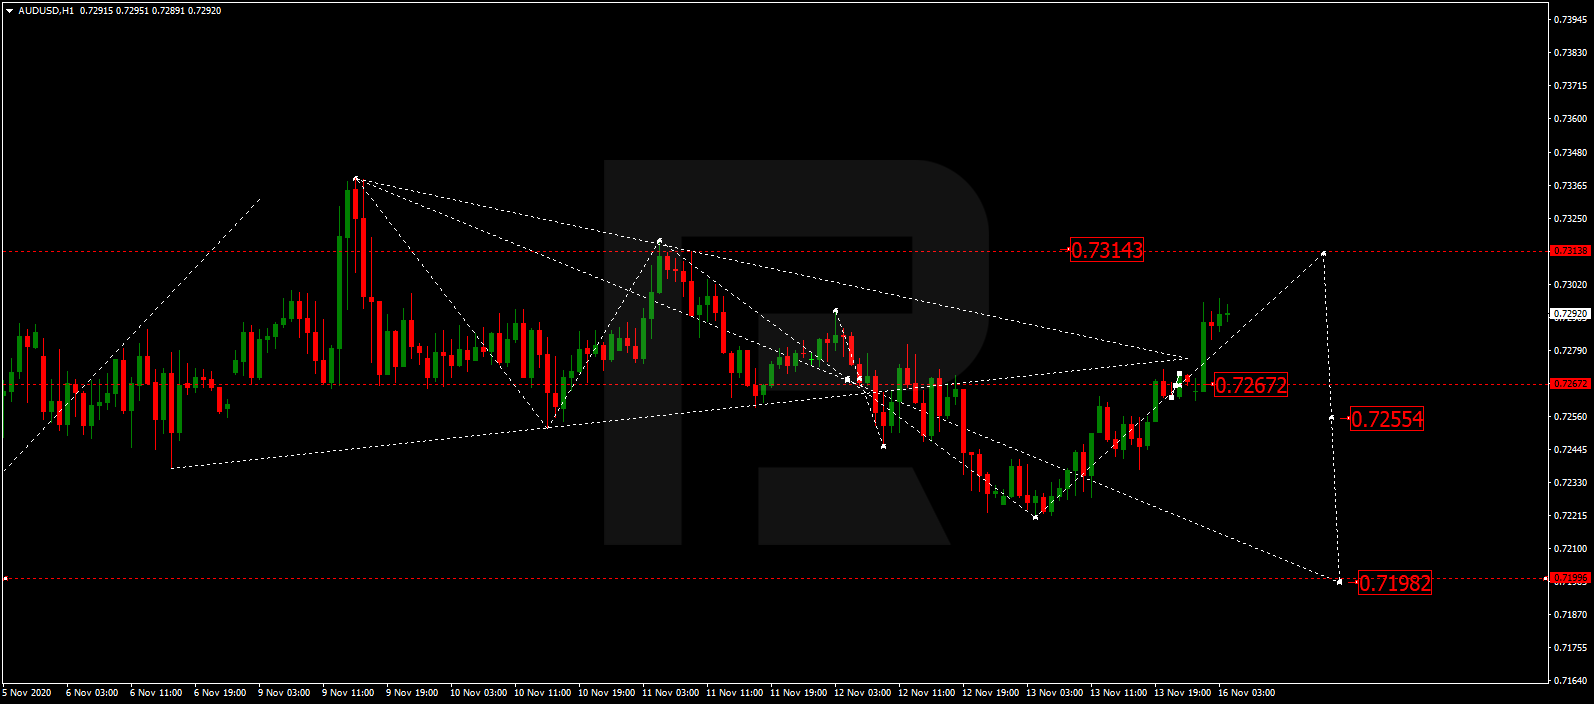
After finishing the ascending wave at 0.7267 and then forming a new consolidation range around this level, AUDUSD has broken the range to the upside. Today, the pair may form one more ascending structure towards 0.7314 and then start a new decline with the first target at 0.7267.

AUDUSD
Risk Warning: the result of previous trading operations do not guarantee the same results in the future

BRENT

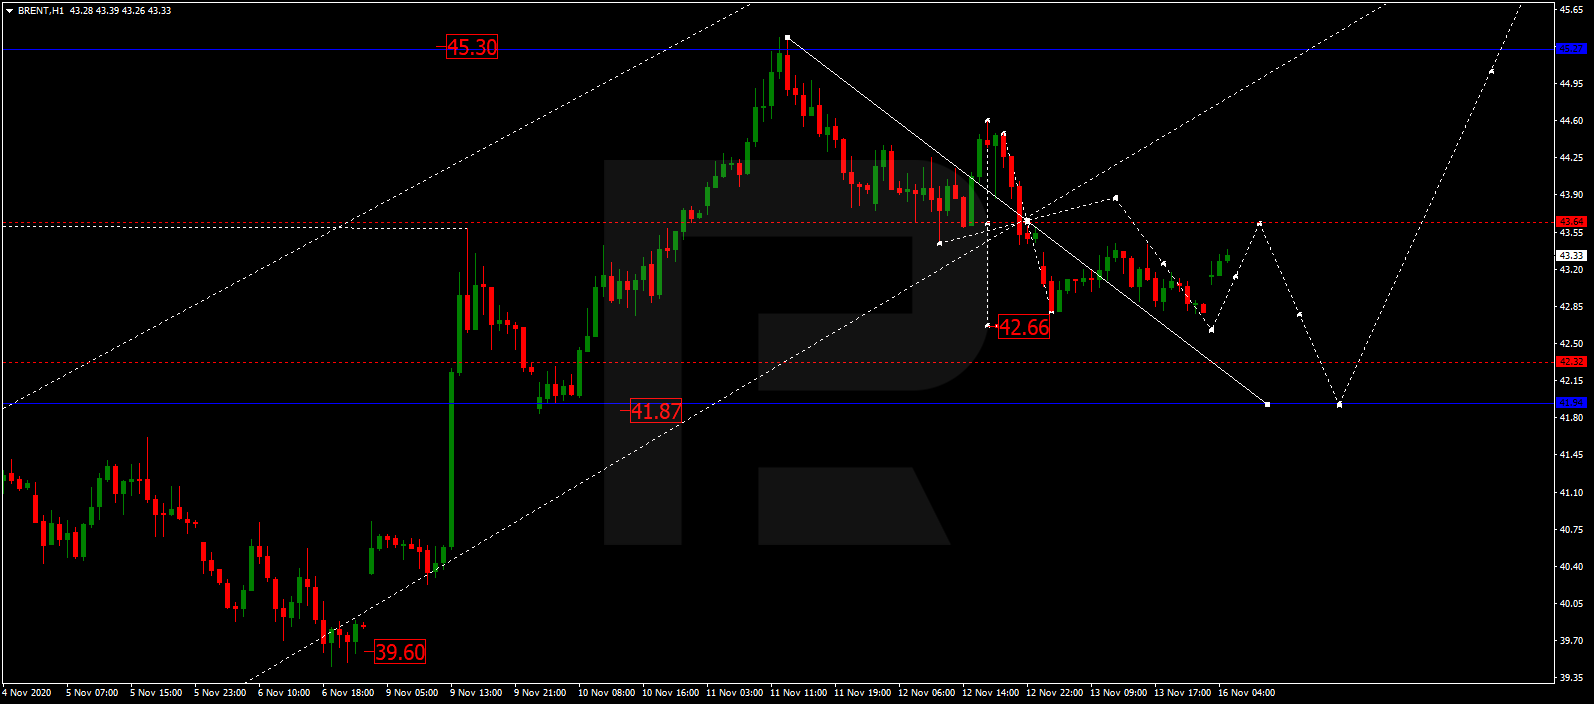
After breaking 43.63 downwards, Brent is consolidating below this level. Possibly, the asset may fall to reach 42.66 and then form one more ascending wave to break 43.64. Later, the market may continue trading upwards with the target at 45.30 or even reach 48.50.

BRENT
Risk Warning: the result of previous trading operations do not guarantee the same results in the future

XAUUSD, “Gold vs US Dollar”

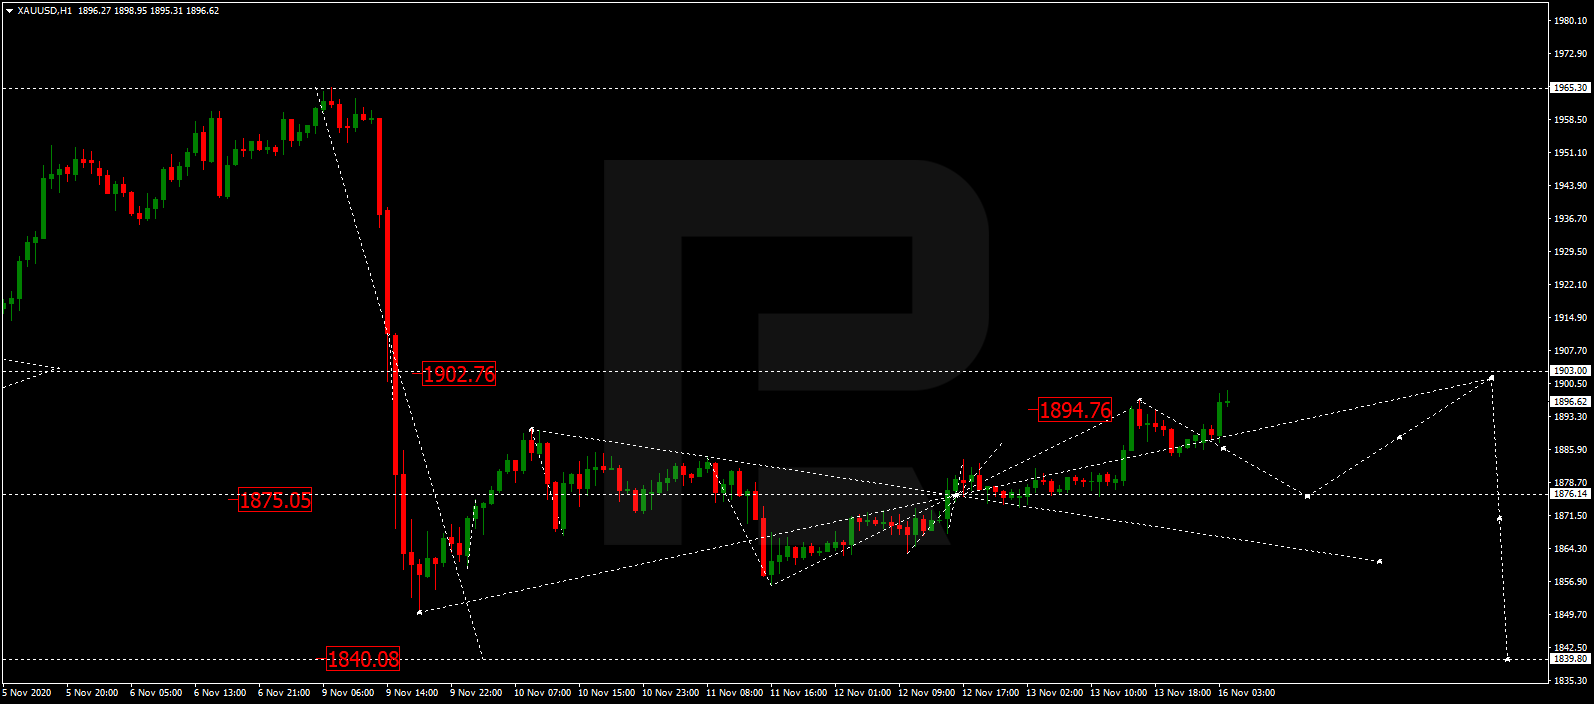
After reaching 1894.76, Gold is consolidating below this level. Today, the metal may form a new descending structure to reach 1876.15 and then resume trading upwards with the target at 1902.76.

GOLD
Risk Warning: the result of previous trading operations do not guarantee the same results in the future

BTCUSD, “Bitcoin vs US Dollar”

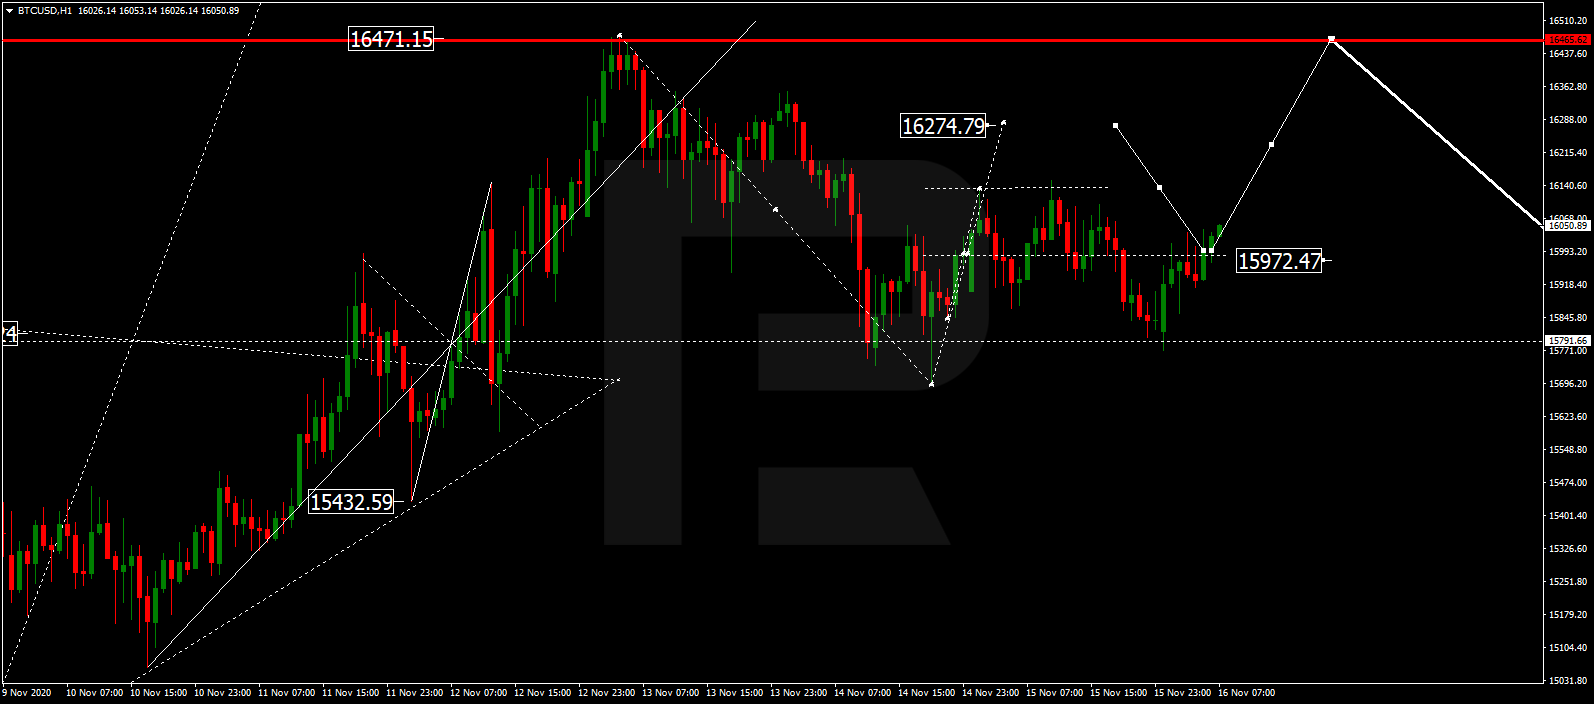
BTCUSD has reached the correctional target at 15700.00; right now, it is growing towards 16275.00. Later, the market may start a new decline to reach 15970.00 and then form one more ascending wave with the target at 16500.00.

BITCOIN
Risk Warning: the result of previous trading operations do not guarantee the same results in the future

S&P 500

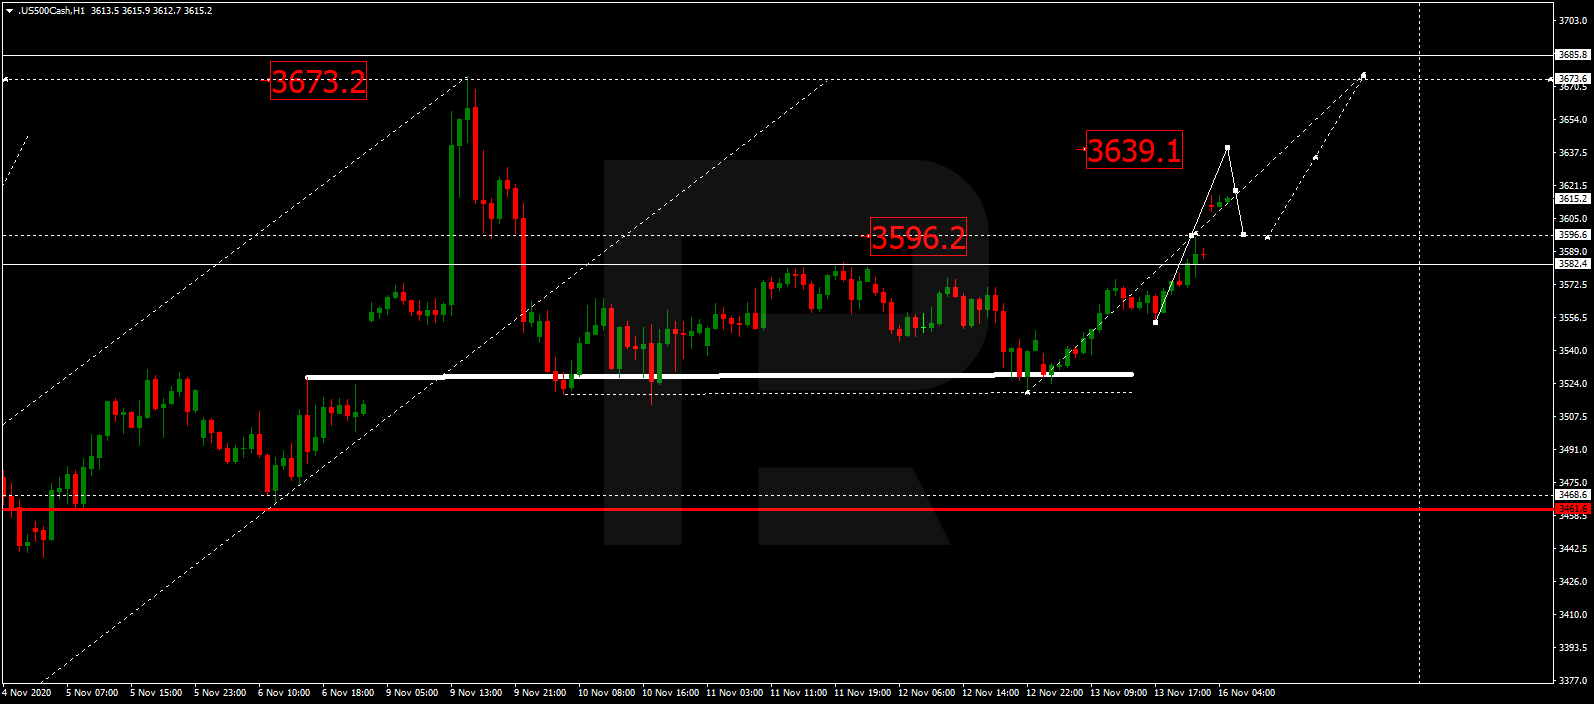
After forming another consolidation range below 3582.4, the S&P index has broken it to the upside. Possibly, the asset may continue growing to reach 3639.1 and then start a new correction towards 3596.6. After that, the instrument may resume trading upwards with the target at 3673.6.

S&P 500

Article By RoboForex.com

Attention!
Forecasts presented in this section only reflect the author’s private opinion and should not be considered as guidance for trading. RoboForex LP bears no responsibility for trading results based on trading recommendations described in these analytical reviews.

Japanese Yen Moving Towards Strengthening

Author: Dmitriy Gurkovskiy, Chief Analyst at RoboForex

On Monday, November 16th, USD/JPY is falling and mainly trading towards 104.55. The Yen is back to strengthening after the world faced a very unpleasant fact: the second wave of the COVID-19 pandemic is spreading much faster than expected, particularly in Europe and the USA.

At the same time, the statistics from Japan are still looking rather weak: the Bank of Japan’s lack of monetary tools of the fiscal stimulus with an immediate and visible effect is making the country’s economy slide toward crisis. For example, the Industrial Production in Japan added 3.9% m/m in September against the expected reading of +4.0% m/m. On YoY, the indicator showed -9.0%, the same as expected.

The Yen is in demand right now as a “safe haven” asset because the coronavirus attack rate during the second wave of the COVID-19 pandemic is much higher than everyone expected earlier. From the fundamental point of view, if all the elements of this equation remain the same, the Yen has chances to get even stronger than it is now.

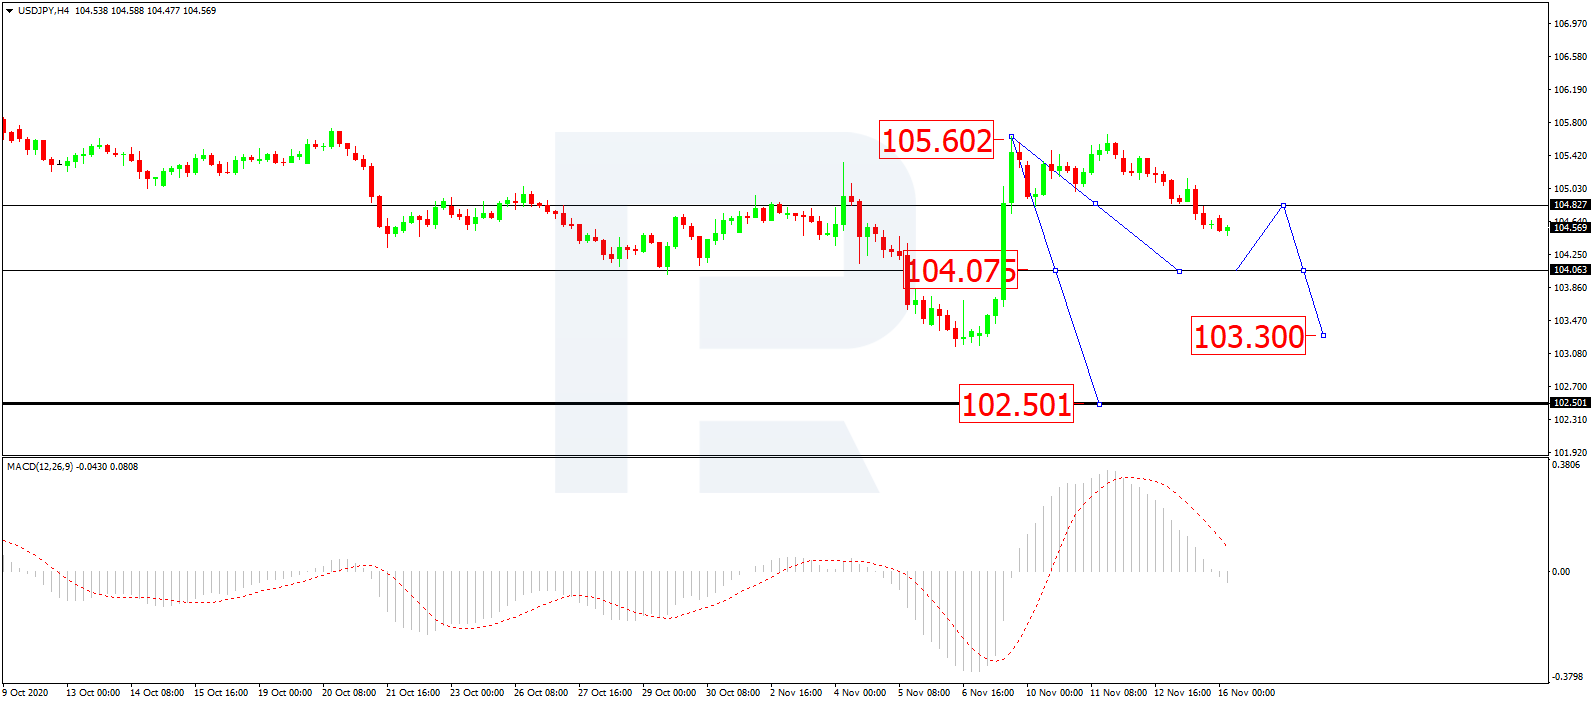
As we can see in the H4 chart, after forming the consolidation range around 104.80 and then breaking it to the downside, USD/JPY is expected to continue forming the fifth descending wave with the target at 102.50; right now, it is forming the first structure of this wave. Possibly, today the pair may fall to reach 104.00 and then start a new correction to return to 104.80. Later, the market may resume trading downwards with the short-term target at 103.30. From the technical point of view, this “bearish” scenario is confirmed by MACD Oscillator: its signal line is falling towards 0. After the line breaks 0, the price may boost its decline.

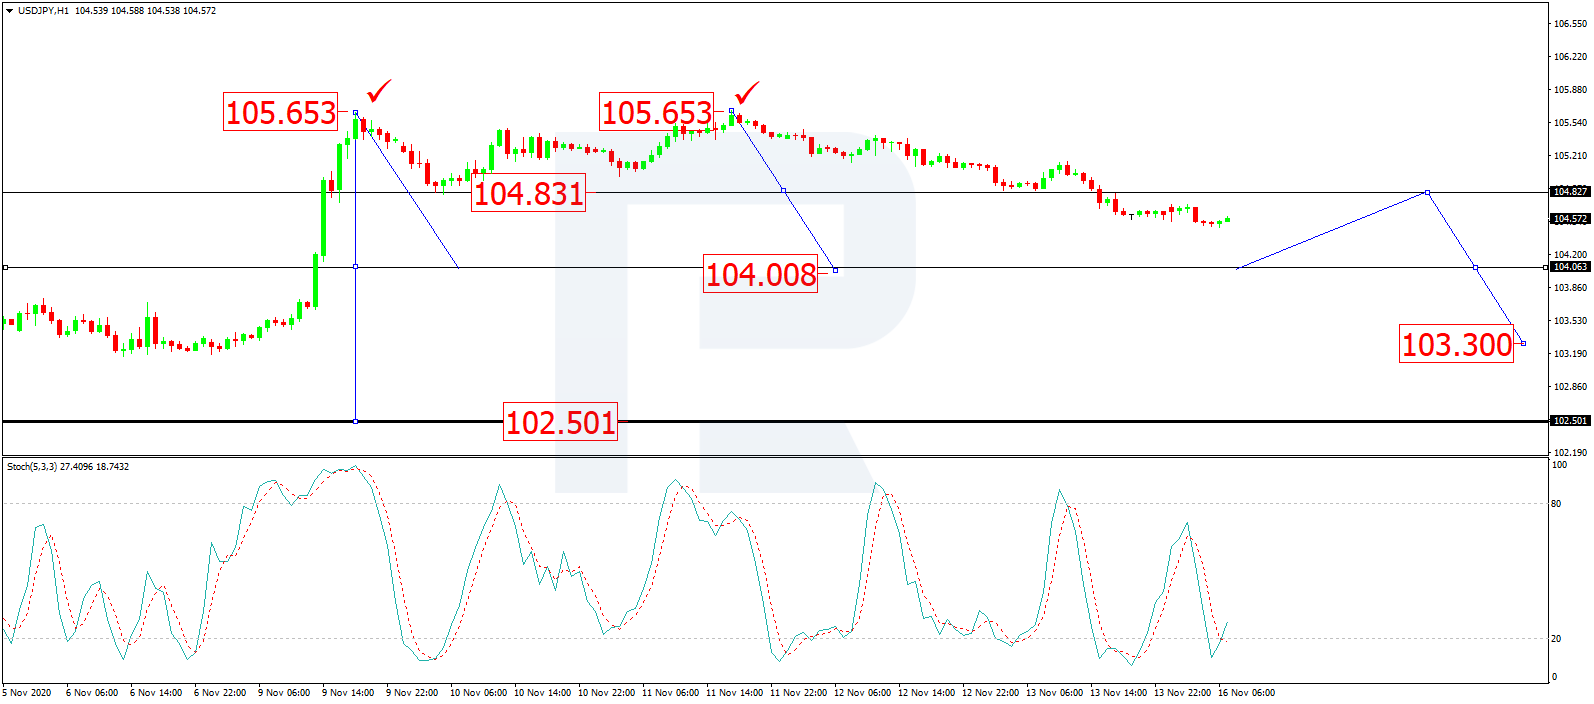
In the H1 chart, after completing the first descending structure at 104.82 along with the correction towards 105.65, USD/JPY has broken the low of the first structure and may later form the third descending structure to break 104.00. After that, the instrument may continue trading downwards with the short-term target at 103.30 and then start a new correction to return to 104.00. From the technical point of view, this scenario is confirmed by Stochastic Oscillator: its signal line is moving not far from 20, thus indicating a correction towards 104.60 on the price chart. The main scenario implies that the line may fall and break 20.

Disclaimer

Any forecasts contained herein are based on the author’s particular opinion. This analysis may not be treated as trading advice. RoboForex bears no responsibility for trading results based on trading recommendations and reviews contained herein.

Week in review: Biden Triumphs, Market Euphoria, Virus Spreads

By Lukman Otunuga, Research Analyst, ForexTime

It was a positive start to the week with global equities marching higher as investor welcomed the weekend’s declaration that Joe Biden won the 2020 US election.

Although this was not the ‘blue wave’ outcome initially projected, his presidency may represent a return to political normality while putting an end to four years of constant unpredictability. However, Donald Trump has yet to concede or show any signs of acknowledging his defeat. This development is likely to create a sense of uncertainty and raise questions over what the future holds. US Political drama  may remain an ongoing theme even after Joe Biden is officially sworn in at noon on 20 January.

Things just got better for global markets on Monday afternoon after the drug companies Pfizer and BioNTech announced that their coronavirus vaccine was 90% effective in tests! The S&P 500 sprinted to fresh record highs on this news while Gold tumbled over 4.5% – smashing into the $1850 support level.

On Tuesday, equity bulls took a breather as questions were later raised over how the coronavirus vaccine would be produced and delivered across the globe. This dose of reality, offered an opportunity for Gold to consolidate around key support levels.

In our mid-week technical outlook, we discussed the possibility of King Dollar returning back to the throne. Persistent concerns around the U.S fiscal stimulus and possible delay in the transition of power to President-elect Joe Biden dampened the market mood while surging coronavirus cases in Europe and the United States fuelled risk aversion. Given how the Dollar is still considered as a prime destination of safety, such market conditions could elevate the currency. Although the DXY rebounded mix-week, prices later consolidated around 92.70 level.

Tech stocks looked to be making a comeback mid-week with the all-important FAANGs finding a bid. At the time of writing, the Nasdaq 100 is trading marginally lower with trader’s net long, according to FXTM Trader’s Sentiments.

Global equities took another breather near the end of the week as investors realised that the pandemic won’t disappear as fast as it arrived. While the vaccine has been the best news received since the virus spread, life won’t return to normal in a matter of days or weeks.

With so much going on across the globe, investors had to catch their breath! As the vaccine euphoria faded, attention was redirected towards the surging coronavirus cases in the United States which topped 160,000 per day. Given how the potential for more lockdowns across the pond is clear, concerns are likely mount over the impacts it could have on the economy.

As the trading week slowly comes to an end, the eery calm on Friday 13th  may signal a storm ahead. Markets seem to be waiting for a fresh directional catalyst to make the next big move either up or down.

Looking at commodities, after experiencing a sharp selloff fuelled by vaccine euphoria at the start of the week, Gold continues to nurse its wounds above the significant $1850 support level.

However, with the metal in the process of forming a death cross technical formation where the 50-day simple moving average crosses below the 100-day simple moving average, bears could be around the corner.

Fundamentally, the risk-off mood triggered by rising coronavirus cases and the ongoing stalemate over a fresh round of US stimulus may stimulate appetite for Gold. But gains may be limited if the Dollar rebounds. Talking technicals, a daily close above $1890 may open a path towards $1900 and higher.

Disclaimer: The content in this article comprises personal opinions and should not be construed as containing personal and/or other investment advice and/or an offer of and/or solicitation for any transactions in financial instruments and/or a guarantee and/or prediction of future performance. ForexTime (FXTM), its affiliates, agents, directors, officers or employees do not guarantee the accuracy, validity, timeliness or completeness, of any information or data made available and assume no liability as to any loss arising from any investment based on the same.


Forex-Time-LogoArticle by ForexTime

ForexTime Ltd (FXTM) is an award winning international online forex broker regulated by CySEC 185/12 www.forextime.com

Ichimoku Cloud Analysis 13.11.2020 (LTCUSD, NZDUSD, XAUUSD)

Article By RoboForex.com

LTCUSD, “Litecoin vs US Dollar”

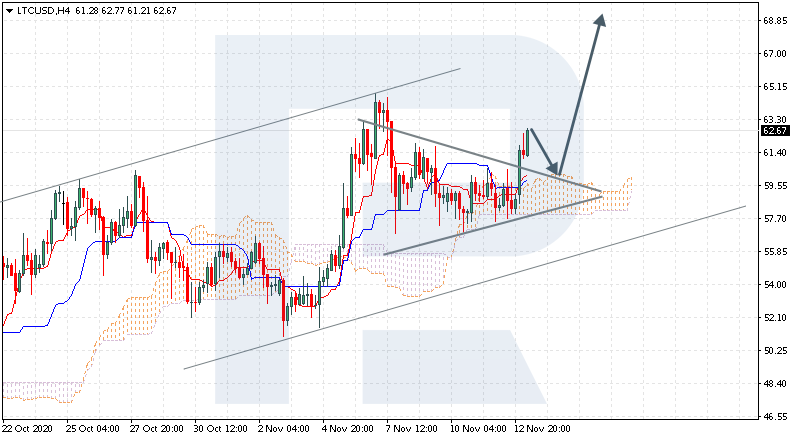
LTCUSD is trading at 62.67; the instrument is moving above Ichimoku Cloud, thus indicating an ascending tendency. The markets could indicate that the price may test the cloud’s upside border at 60.05 and then resume moving upwards to reach 68.85. Another signal in favor of further uptrend will be a rebound from the upside border of a Triangle pattern. However, the bullish scenario may no longer be valid if the price breaks the cloud’s downside border and fixes below 55.65. In this case, the pair may continue falling towards 52.05.

LTCUSD
Risk Warning: the result of previous trading operations do not guarantee the same results in the future

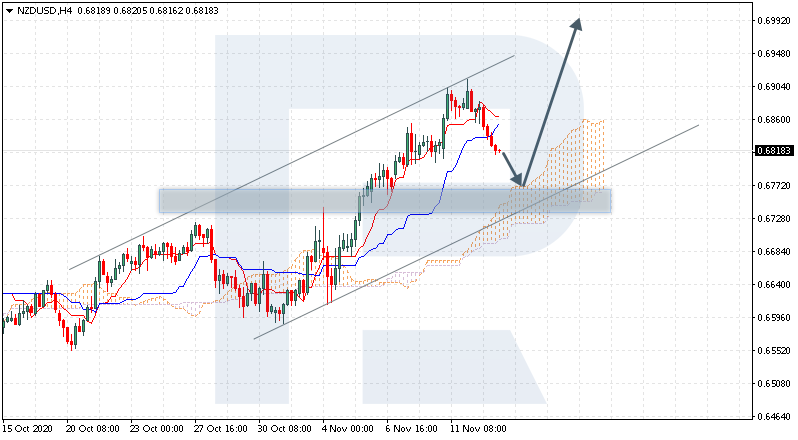
NZDUSD, “New Zealand Dollar vs US Dollar”

NZDUSD is trading at 0.6818; the instrument is moving above Ichimoku Cloud, thus indicating an ascending tendency. The markets could indicate that the price may test the cloud’s upside border at 0.6770 and then resume moving upwards to reach 0.6995. Another signal in favor of further uptrend will be a rebound from the support level. However, the bullish scenario may be canceled if the price breaks the cloud’s downside border and fixes below 0.6680. In this case, the pair may continue falling towards 0.6555.

NZDUSD
Risk Warning: the result of previous trading operations do not guarantee the same results in the future

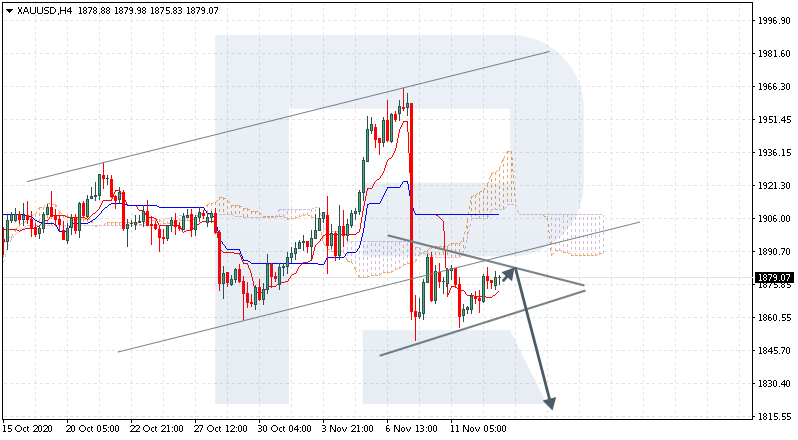
XAUUSD, “Gold vs US Dollar”

XAUUSD is trading at 1879.00; the instrument is moving below Ichimoku Cloud, thus indicating a descending tendency. The markets could indicate that the price may test Tenkan-Sen and Kijun-Sen at 1885.00 and then resume moving downwards to reach 1815.00. Another signal in favor of further downtrend will be a rebound from the upside border of the Triangle pattern. However, the bearish scenario may no longer be valid if the price breaks the cloud’s upside border and fixes above 1915.00. In this case, the pair may continue growing towards 1945.00. To confirm further decline, the asset must break the pattern’s downside border and fix below 1850.00.

XAUUSD

Article By RoboForex.com

Attention!
Forecasts presented in this section only reflect the author’s private opinion and should not be considered as guidance for trading. RoboForex LP bears no responsibility for trading results based on trading recommendations described in these analytical reviews.

Forex Technical Analysis & Forecast 13.11.2020

Article By RoboForex.com

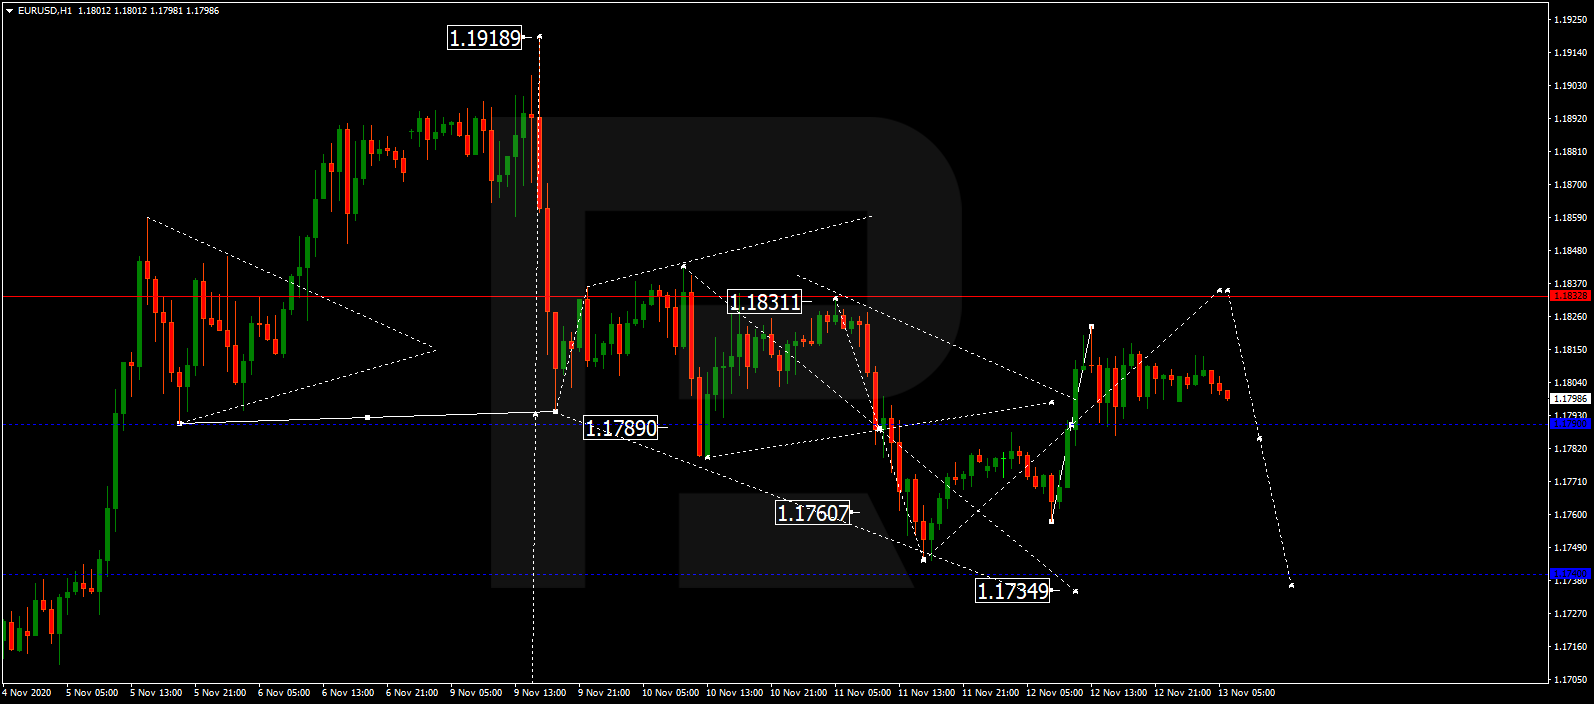
EURUSD, “Euro vs US Dollar”

EURUSD is still consolidating around 1.1789; it has broken this level upwards and may grow to reach 1.1832. After that, the instrument may fall towards 1.1735 and then start another growth to return to 1.1789. If later the price breaks this range to the downside, the market may resume trading downwards with the target at 1.1700; if to the upside – form one more ascending structure towards 1.1900.

EURUSD
Risk Warning: the result of previous trading operations do not guarantee the same results in the future

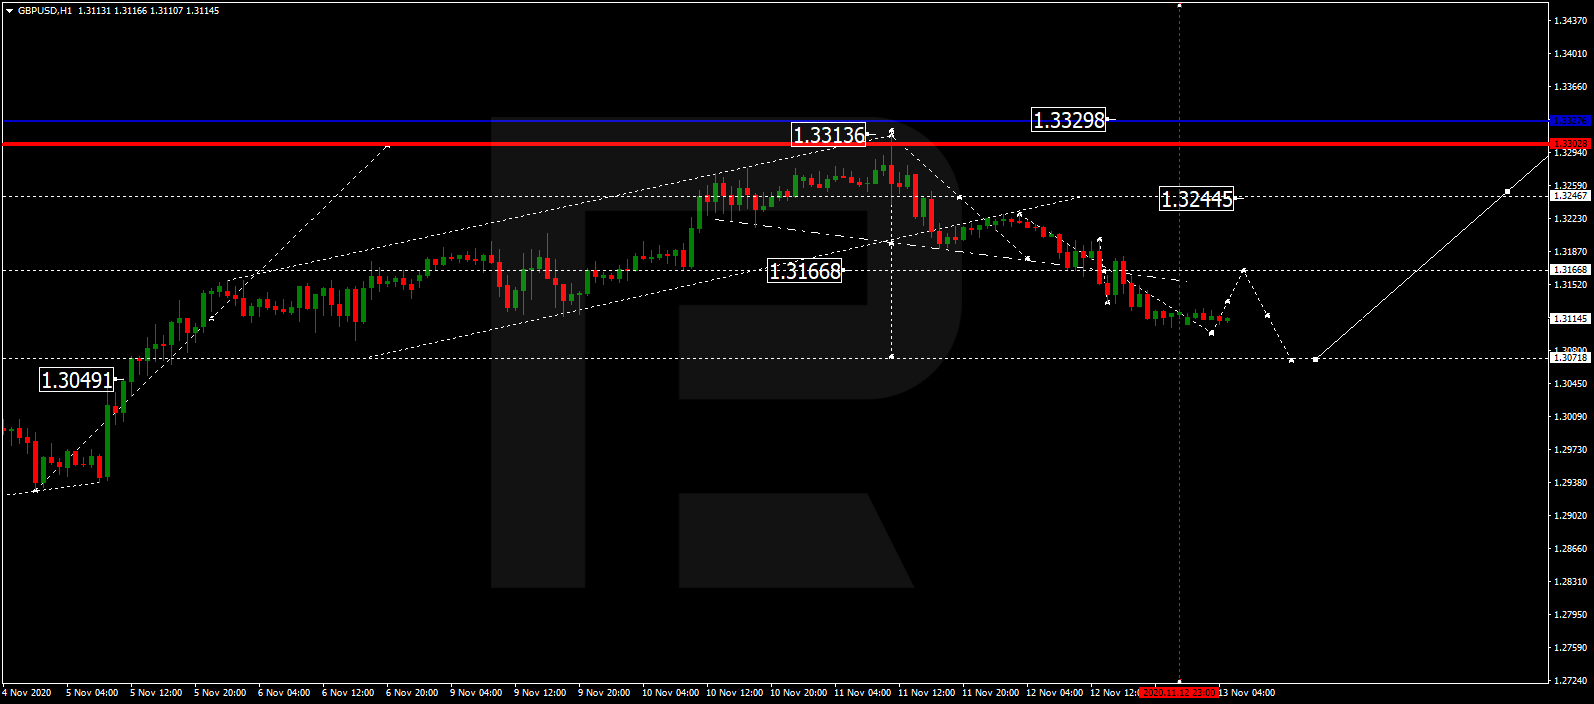
GBPUSD, “Great Britain Pound vs US Dollar”

After breaking 1.3169 downwards, GBPUSD is expected to reach 1.3097 and may later form one more ascending structure to return to 1.3169. After that, the instrument may resume trading downwards to reach 1.3070 and then start another growth with the target at 1.3170.

GBPUSD
Risk Warning: the result of previous trading operations do not guarantee the same results in the future

USDRUB, “US Dollar vs Russian Ruble”

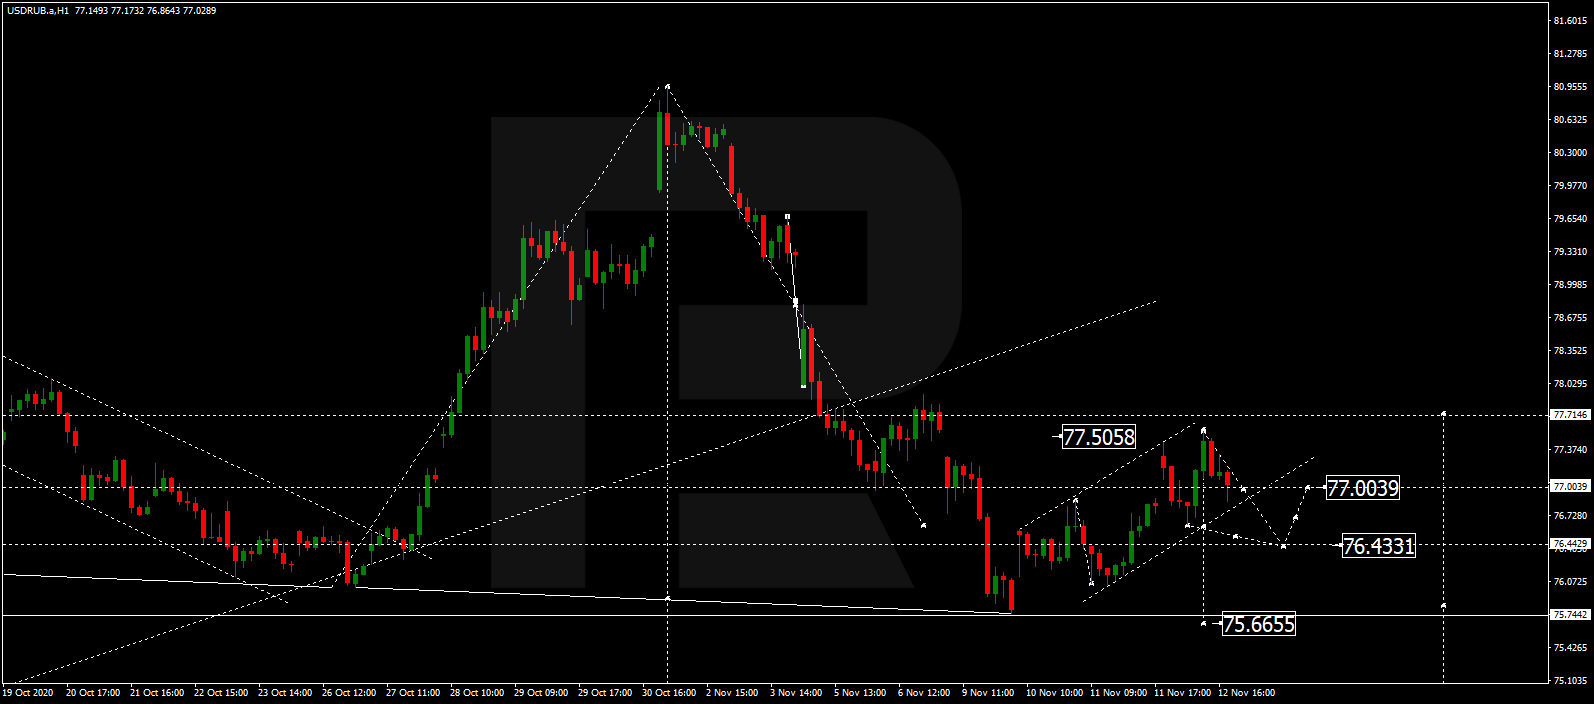
USDRUB has finished the ascending wave at 77.50. Possibly, today the pair may fall to reach 76.44 and then grow towards 77.00, thus forming a new consolidation range around the latter level. If later the price breaks this range to the downside, the market may start another decline to reach 75.66 or even 75.00; if to the upside – continue the correction with the target at 78.00.

USDRUB
Risk Warning: the result of previous trading operations do not guarantee the same results in the future

USDJPY, “US Dollar vs Japanese Yen”

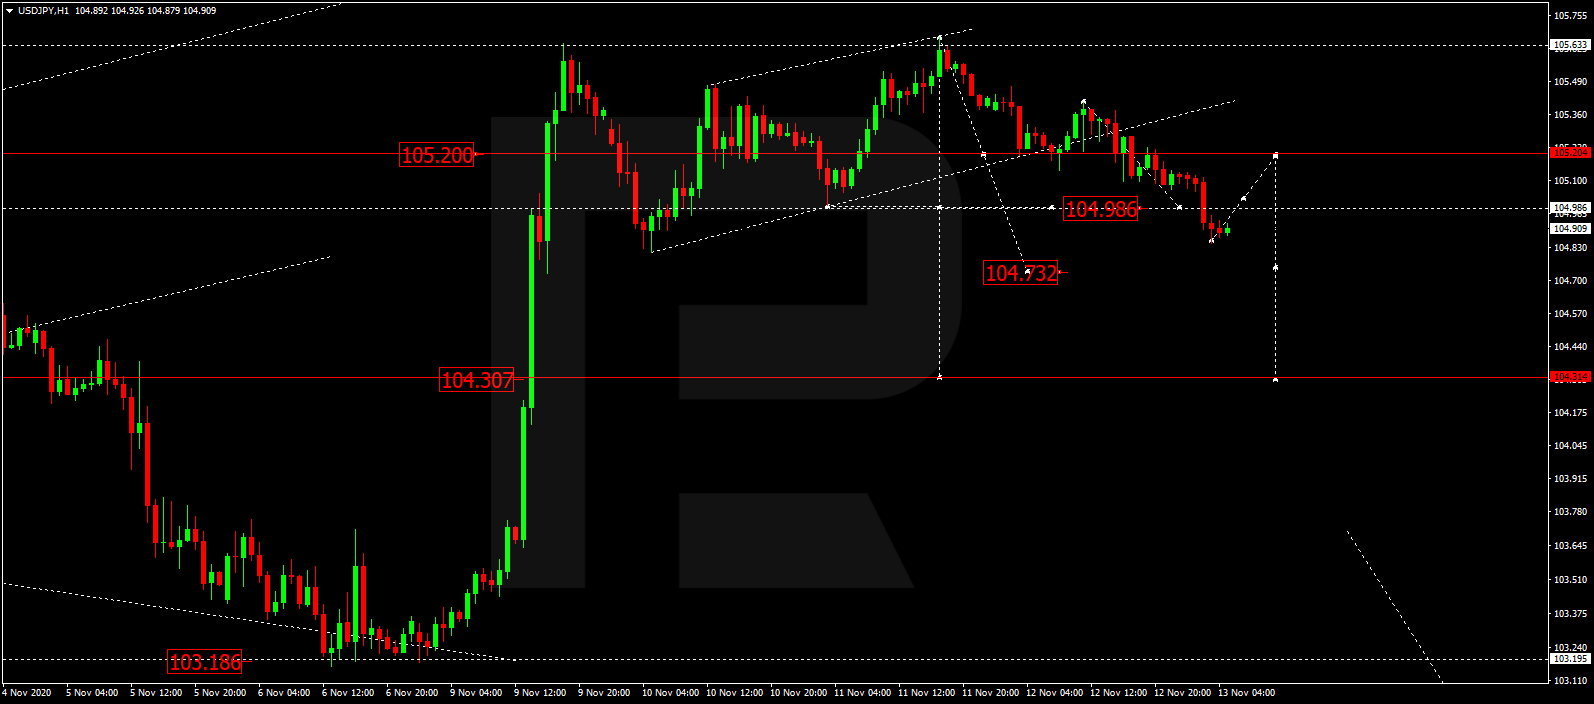
After breaking 105.30 downwards, USDJPY has finished the descending structure at 104.98. Today, the pair may correct to test 105.30 from below and then resume trading downwards with the target at 104.73 or even reach 104.33.

USDJPY
Risk Warning: the result of previous trading operations do not guarantee the same results in the future

USDCHF, “US Dollar vs Swiss Franc”

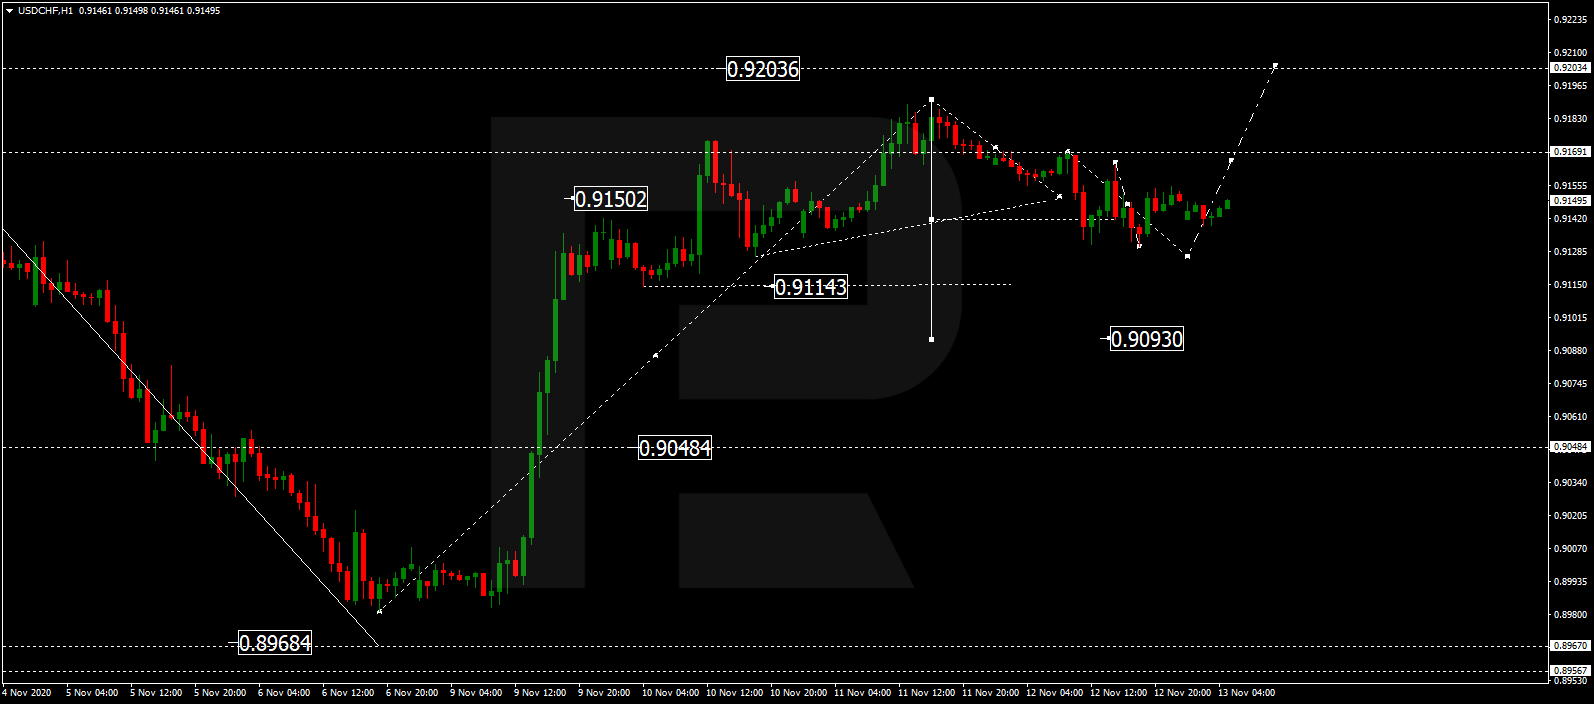
USDCHF is still consolidating around 0.9141 without any particular direction. Today, the pair may fall to reach 0.9122 and then start another growth towards 0.9150. Later, the market may resume moving downwards with the target at 0.9093.

USDCHF
Risk Warning: the result of previous trading operations do not guarantee the same results in the future

AUDUSD, “Australian Dollar vs US Dollar”

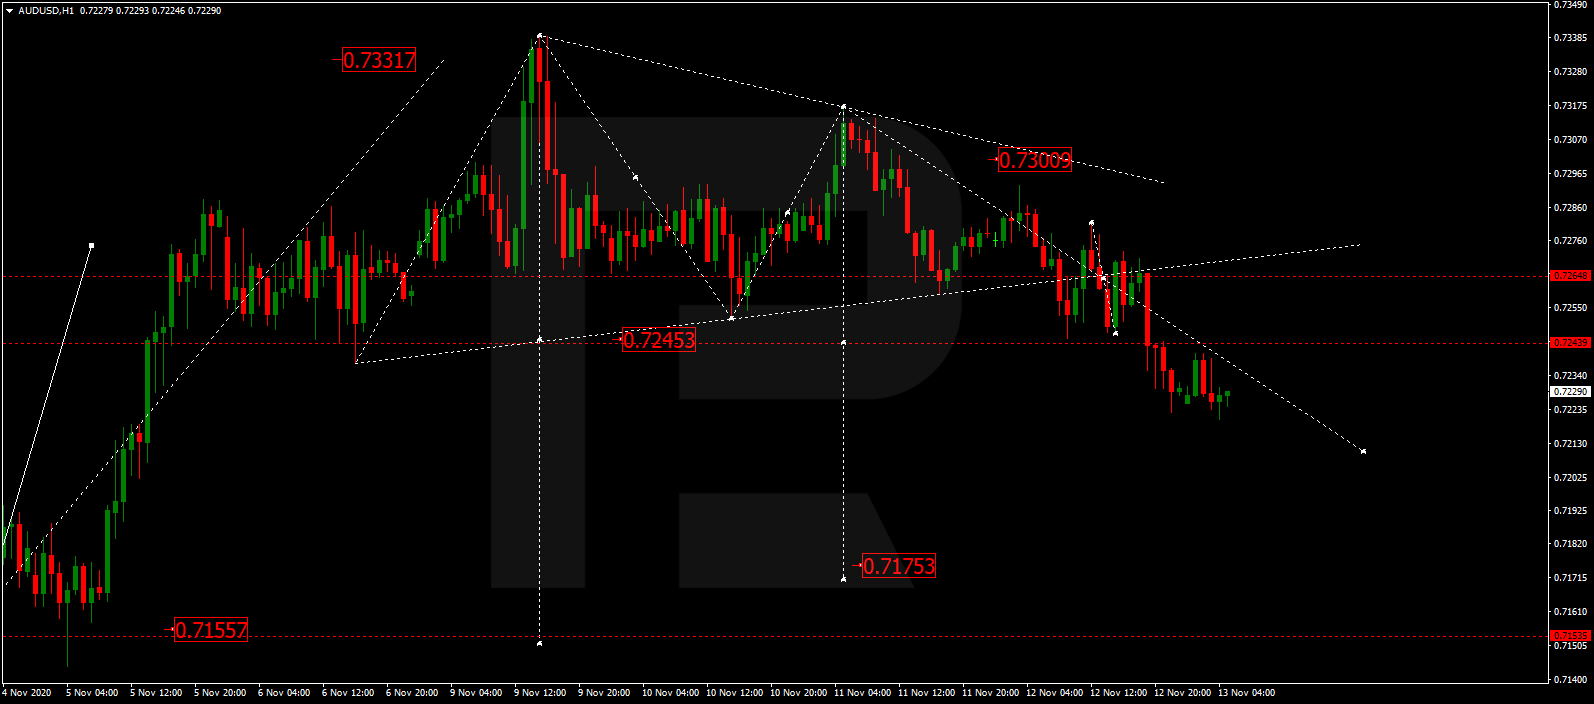
After breaking the consolidation range to the downside along with 0.7245, AUDUSD is expected to continue falling towards 0.7175. After that, the instrument may start a new correction to return to 0.7245 and then resume falling with the first target at 0.7155.

AUDUSD
Risk Warning: the result of previous trading operations do not guarantee the same results in the future

BRENT

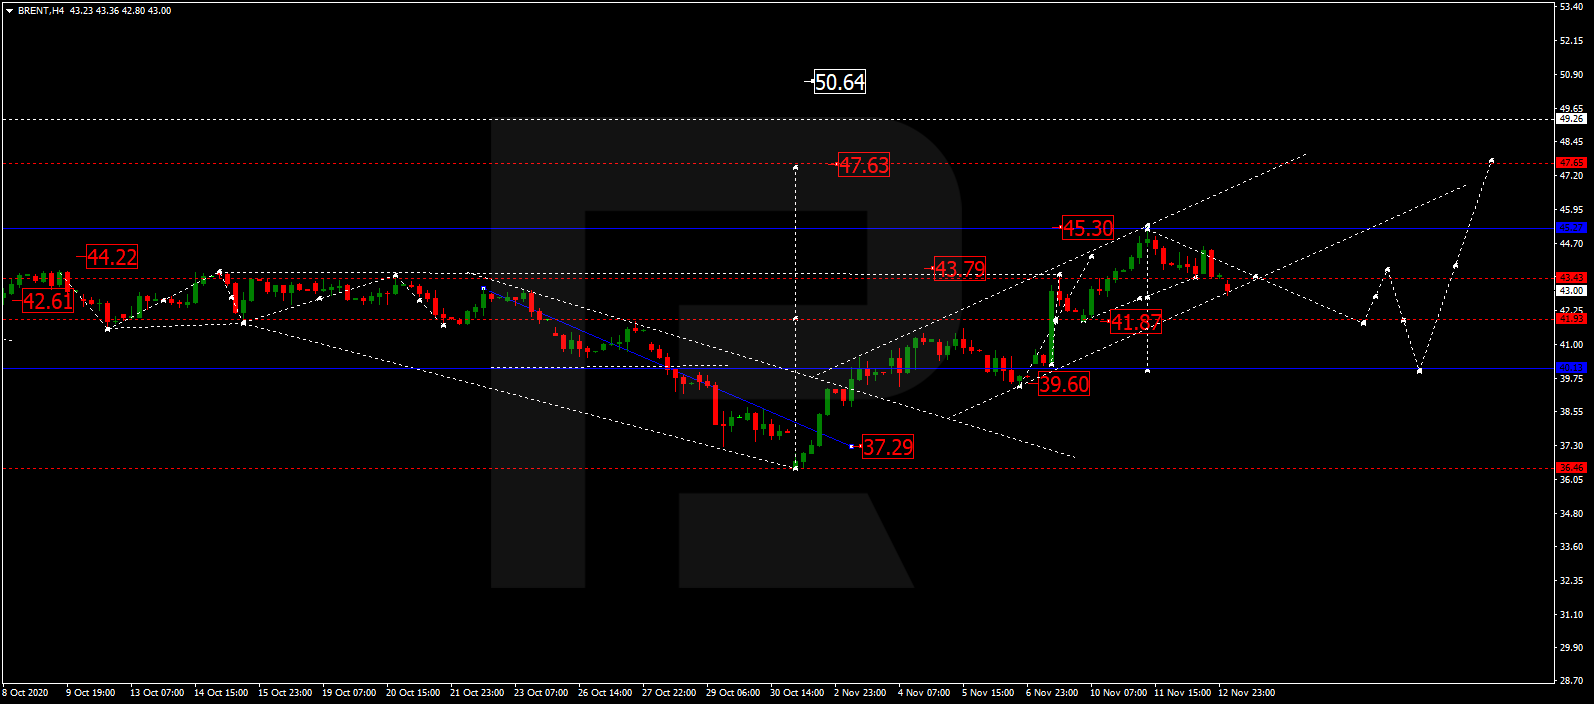
After completing the ascending wave at 45.30, Brent is correcting towards 41.85. Possibly, the asset may extend the correction down to 39.60 and then form one more ascending wave with the target at 47.60.

BRENT
Risk Warning: the result of previous trading operations do not guarantee the same results in the future

XAUUSD, “Gold vs US Dollar”

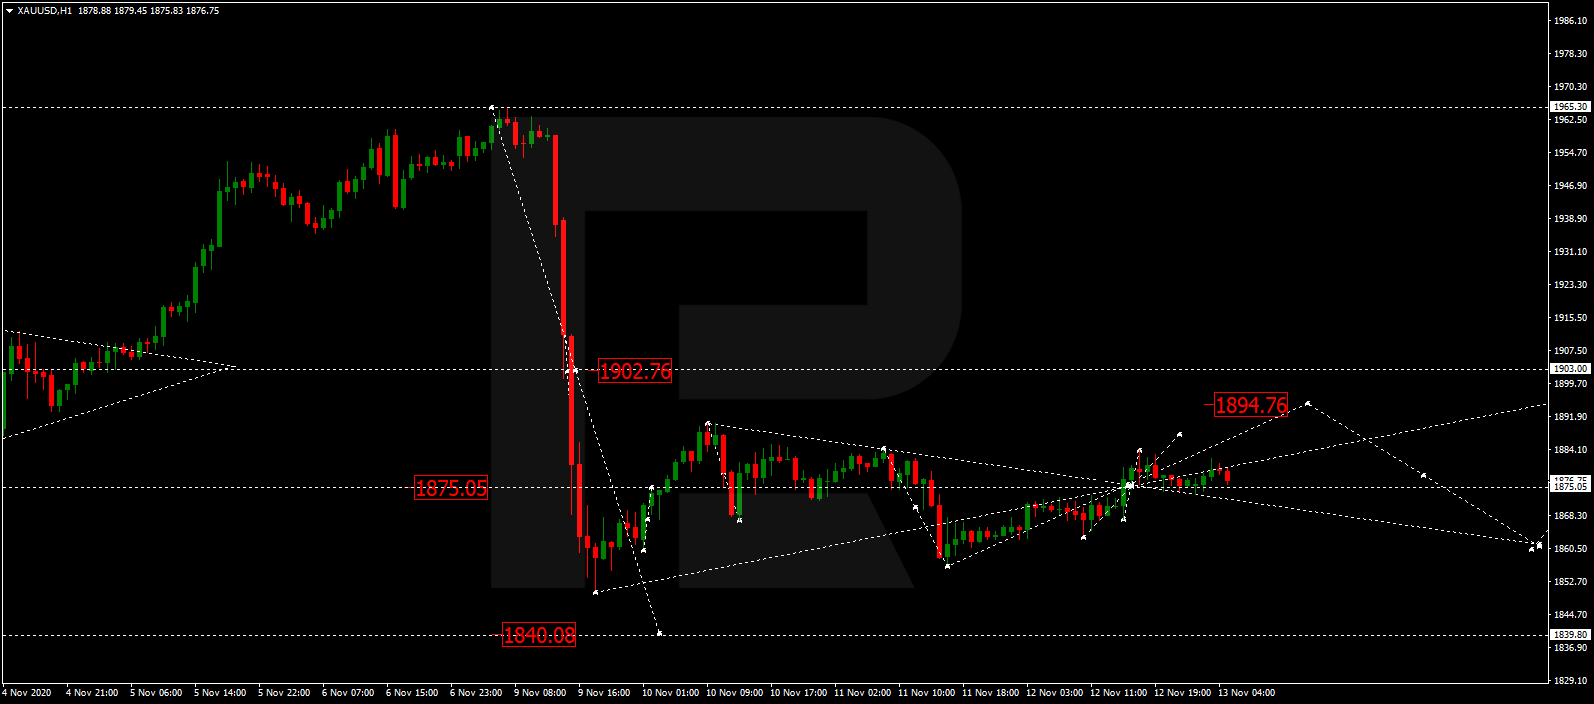
Gold is still consolidating around 1870.30; it has fixed above 1875.00 and may choose an alternative scenario to expand the range up to 1894.76. The main scenario suggests that the metal may fall to break 1860.60 and then continue trading downwards with the target at 1840.00.

GOLD
Risk Warning: the result of previous trading operations do not guarantee the same results in the future

BTCUSD, “Bitcoin vs US Dollar”

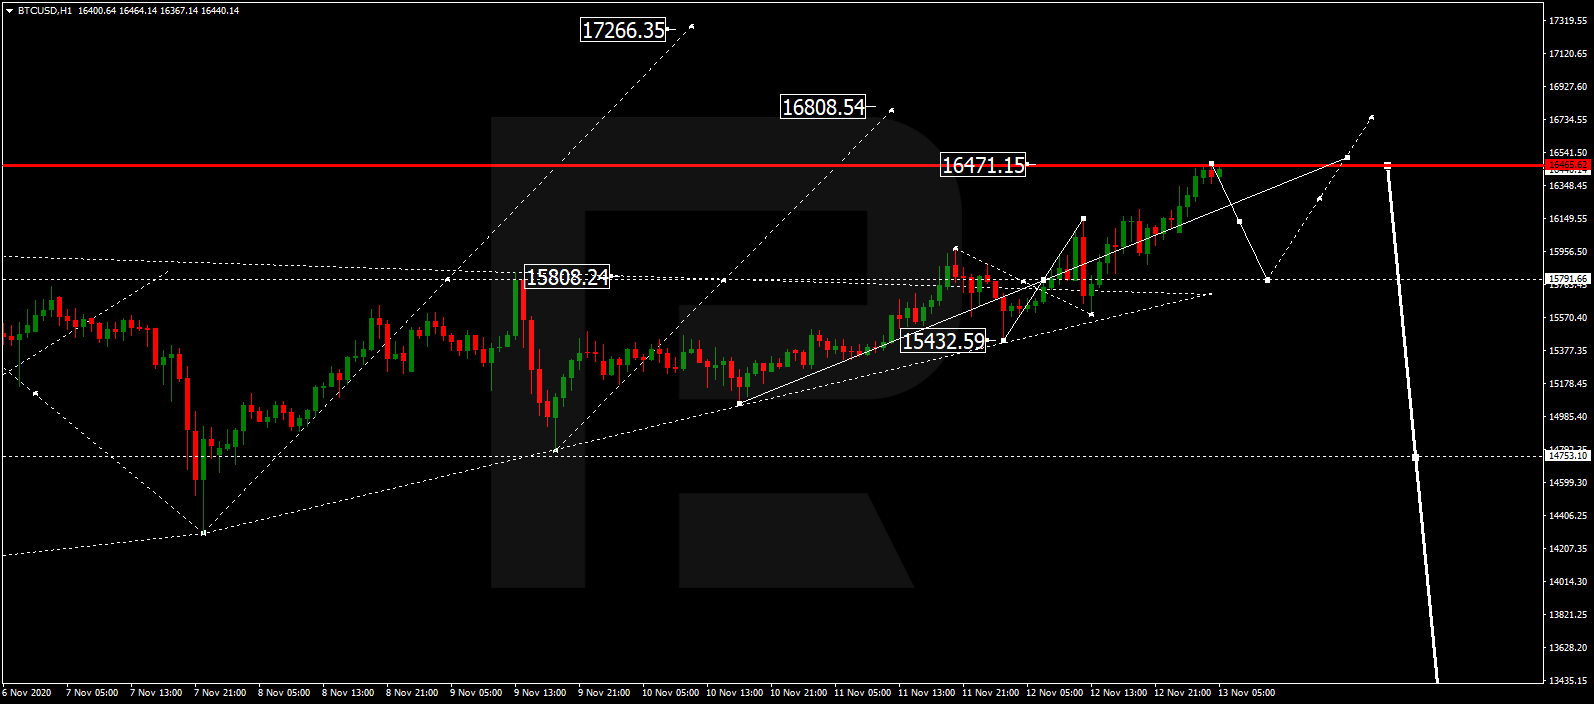
BTCUSD has reached its upside target at 16400.00. Possibly, today the asset may fall to test 15800.00 from above and then choose an alternative scenario to form one more ascending wave towards 16800.00 or even reach 17250.00. However, if the price breaks 15800.00 and forms a continuation pattern, the market may start a new correctional decline with the target at 15000.00.

BITCOIN
Risk Warning: the result of previous trading operations do not guarantee the same results in the future

S&P 500

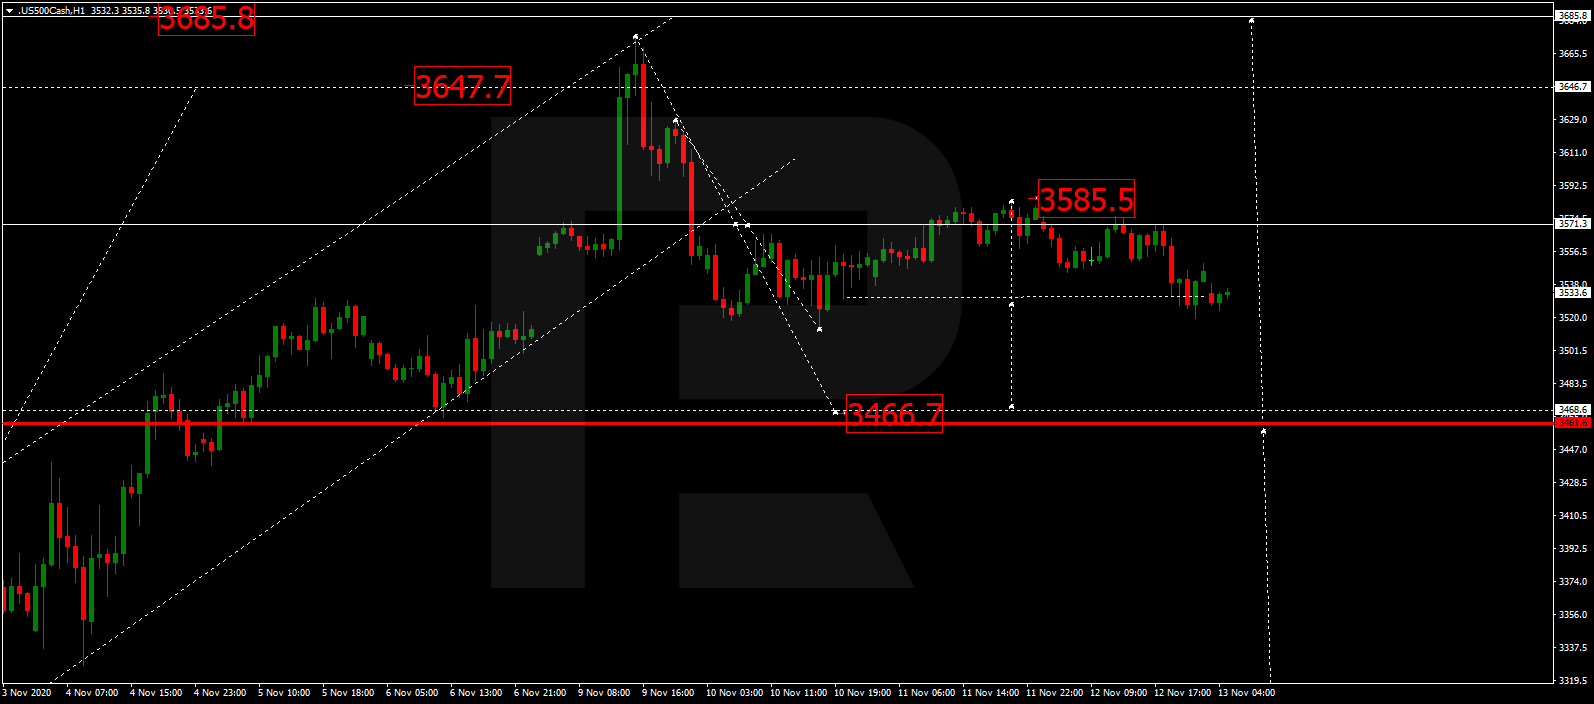
The S&P index is still falling towards 3468.6 and may later start another growth to reach 3585.5, thus forming a new consolidation range between these two levels. If later the price breaks this range to the downside, the market may form a new descending wave with the target at 3333.3.

S&P 500

Article By RoboForex.com

Attention!
Forecasts presented in this section only reflect the author’s private opinion and should not be considered as guidance for trading. RoboForex LP bears no responsibility for trading results based on trading recommendations described in these analytical reviews.

The Analytical Overview of the Main Currency Pairs on 2020.11.13

by JustForex

The EUR/USD currency pair

Technical indicators of the currency pair:
  • Prev Open: 1.1775
  • Prev Close: 1.1805
  • % chg. over the last day: +0.25%

Yesterday, the EUR/USD currency pair was traded upward and showed a positive trend of 0.25%. This morning the pair is being traded in a narrow daily range near the previous day’s close price: 1.1797 – 1.1812. If you look at the chart, a technical analysis figure of an Ascending Triangle is drawn now. On the hourly timeframe, the price is being traded above the moving average MA 200. On the H4 timeframe, the situation is similar. The MACD indicator is in the positive zone. Based on the above, it is probably worth considering purchases while the price is above MA 200.

Trading recommendations
  • Support levels: 1.1758, 1.1621
  • Resistance levels: 1.1832, 1.1880, 1.1920

The main scenario for trading EUR/USD is continued growth towards 1.1832 (November 11 high)

Alternative scenario: if the price fixes below MA 200 on the H1 timeframe, the currency pair is likely to decline to 1.1620.

EUR/USD
News feed for 2020.11.13:
  • – US producer price index at 15:30 (GMT+2)

The GBP/USD currency pair

Technical indicators of the currency pair:
  • Prev Open: 1.3210
  • Prev Close: 1.3122
  • % chg. over the last day: -0.67

Yesterday, the GBP/USD currency pair was traded downward and closed the day with -0.67%. Today, the currency pair has been trading in the range of $1.3105-50. On the hourly chart, GBP/USD is testing the MA 200 line on the H1 timeframe. The situation is similar on the four-hour chart. The MACD indicator is still in the negative zone. Based on the above, it is probably worth looking for buy entry points, while the GBP/USD is still above MA 200 H1.

Trading recommendations
  • Support levels: 1.3105, 1.2915, 1.2850
  • Resistance levels: 1.3140, 1.3228, 1.3312

The main scenario for trading GBP/USD: if the price fixes above the level of 1.3140, GBP/USD quotes can move to the level of $1.3228 (November 12 high).

Alternative scenario: if the price fixes below the moving average MA 200 on H1, then GBP/USD may fall to $1.2915.

GBP/USD
News feed for 2020.11.13:
  • – US producer price index at 15:30 (GMT+2);
  • – Speech by the Bank of England Governor Bailey at 18:00 (GMT+2).

The USD/JPY currency pair

Technical indicators of the currency pair:
  • Prev Open: 105.402
  • Prev Close: 105.118
  • % chg. over the last day: -0.27

Yesterday, the USD/JPY currency pair was traded downward and showed a 0.27% fall. The currency pair has fallen slightly today, dropping to Y104.85. On the hourly chart, USD/JPY is still being traded above the MA 200 on the H1 timeframe. On the four-hour chart, the pair remains below the MA 200 on the H4 timeframe. Based on the above, it is worth looking for buy entry points at the end of the correction, while the price remains above MA 200 H1.

Trading recommendations
  • Support levels: 104.80, 103.18
  • Resistance levels: 105.67

The main scenario for trading USD/JPY is the continuation of the upward movement to the level of 105.67 (November 11 high).

An alternative scenario assumes consolidation below MA 200 H1, followed by a decline to 103.20 (Nov 9 low).

USD/CAD
News feed for 2020.11.13:
  • – US producer price index at 15:30 (GMT+2)

The USD/CAD currency pair

Technical indicators of the currency pair:
  • Prev Open: 1.3059
  • Prev Close: 1.3142
  • % chg. over the last day: +0,63

Yesterday, the USD/CAD pair was traded upward and closed with +0.63%. Today, the pair has also increased slightly, rising to $1.3170. On the H1 timeframe, the pair broke through the MA 200. On the four-hour chart, the price has not yet tested the moving average. Based on the above, it is worth looking for buy entry points at the correction, while the price remains above MA 200 H1. We recommend paying attention to how the price will behave when approaching the moving average on the H4 timeframe.

Trading recommendations
  • Support levels: 1.3080, 1.2928
  • Resistance levels: 1.3297

The main scenario for trading USD/CAD: it is necessary to look for a buy entry point upon a pullback to the level of 1.3080, on the H1 timeframe. The currency pair may reach the level of 1.3297.

Alternative scenario: if the price breaks through the level of 1.3080 and fixes below the MA 200, you can consider a sell position to the level of 1.2928.

USD/JPY
News feed for 2020.11.13:
  • – US producer price index at 15:30 (GMT+2)

by JustForex


This article reflects a personal opinion and should not be interpreted as an investment advice, and/or offer, and/or a persistent request for carrying out financial transactions, and/or a guarantee, and/or a forecast of future events.

Despite rising US yields, EURUSD still well above 1.1600 – 1.2000 into the yearly close?

By Admiral Markets

Economic Events November 13, 2020

Source: Economic Events November 13, 2020 – Admiral Markets Forex Calendar

On Monday, after Pfizer/BioNTech announced that they are on their way to a Covid-19 vaccine that is effective in preventing the virus in over 90% of cases, US yields spiked to their highest levels since March 2020, eyeing the 1.00% mark.

Main reason was certainly that market participants saw chances of a massive fiscal and further monetary stimulus dropping. As a result Gold sold off sharply and a potential sector rotation from growth to value stocks set in.

But what’s especially noteworthy: EURUSD saw an initial push above 1.1900, dropping only with a delay of several hours towards and slightly below 1.1800 in the days to come.

That’s not just noteworthy, but surprising. The spike higher in US yields and resulting US-Dollar strength can in fact only mean one thing: market participants are still convinced that we are far from returning to “normal”, especially from an economic standpoint.

That said, chances of a massive fiscal package to stabilize the US economy and an ultra-dovish approach from the US central bank FED to finance that fresh US debt are probably still on the table, which was underlined by FED chairman Powell last week at the FED meeting on Wednesday.

While the picture in EURUSD remains choppy as long as we trade below 1.1900, but above 1.1600, we will remain positive for the currency pair, expecting a break higher, direct follow through to 1.2000 and a deep run beyond the 1.2000 mark in the 6 to 12 months to come.

Even if we get to see a short-term USD relief rally and break below 1.1600, we consider the region between 1.1400 to 1.1500 interesting, risk-reward wise, and could anticipate our expected break to above 1.2000:

EURUSD Daily chart

Source: Admiral Markets MT5 with MT5SE Add-on EURUSD Daily chart (from August 07, 2019, to November 12, 2020). Accessed: November 12, 2020, at 10:00 PM GMT. Please note: Past performance is not a reliable indicator of future results, or future performance.

In 2015, the value of the EURUSD fell by 10.2%, in 2016, it fell by 3.2%, in 2017, it increased by 13.92%, in 2018, it fell by 4.4%, and in 2019, it fell by 2.2%, meaning that in five years, it was down by 7.3%.

Discover the world’s #1 multi-asset platform

Admiral Markets offers professional traders the ability to trade with MetaTrader 5, allowing you to experience trading at a significantly higher, more rewarding level than with MetaTrader 4. Experience benefits such as the addition of the Market Heat Map, so you can compare various currency pairs to see which ones might be lucrative investments, access real-time trading data, and so much more. Click the banner below to start your FREE download of MT5!

Trade With MetaTrader 5

Disclaimer: The given data provides additional information regarding all analysis, estimates, prognosis, forecasts or other similar assessments or information (hereinafter “Analysis”) published on the website of Admiral Markets. Before making any investment decisions please pay close attention to the following:

  1. This is a marketing communication. The analysis is published for informative purposes only and is in no way to be construed as investment advice or recommendation. It has not been prepared in accordance with legal requirements designed to promote the independence of investment research, and that it is not subject to any prohibition on dealing ahead of the dissemination of investment research.
  2. Any investment decision is made by each client alone whereas Admiral Markets shall not be responsible for any loss or damage arising from any such decision, whether or not based on the Analysis.
  3. Each of the Analysis is prepared by an independent analyst (Jens Klatt, Professional Trader and Analyst, hereinafter “Author”) based on the Author’s personal estimations.
  4. To ensure that the interests of the clients would be protected and objectivity of the Analysis would not be damaged Admiral Markets has established relevant internal procedures for prevention and management of conflicts of interest.
  5. Whilst every reasonable effort is taken to ensure that all sources of the Analysis are reliable and that all information is presented, as much as possible, in an understandable, timely, precise and complete manner, Admiral Markets does not guarantee the accuracy or completeness of any information contained within the Analysis. The presented figures that refer to any past performance is not a reliable indicator of future results.
  6. The contents of the Analysis should not be construed as an express or implied promise, guarantee or implication by Admiral Markets that the client shall profit from the strategies therein or that losses in connection therewith may or shall be limited.
  7. Any kind of previous or modelled performance of financial instruments indicated within the Publication should not be construed as an express or implied promise, guarantee or implication by Admiral Markets for any future performance. The value of the financial instrument may both increase and decrease and the preservation of the asset value is not guaranteed.
  8. The projections included in the Analysis may be subject to additional fees, taxes or other charges, depending on the subject of the Publication. The price list applicable to the services provided by Admiral Markets is publicly available from the website of Admiral Markets.
  9. Leveraged products (including contracts for difference) are speculative in nature and may result in losses or profit. Before you start trading, you should make sure that you understand all the risks.

By Admiral Markets

Calmer seas on Friday the 13th?

By Han Tan, Market Analyst, ForexTime

Asian stocks are mostly tracking Thursday’s declines on Wall Street, with most US and European equity futures edging lower at the time of writing. The VIX is now around its lowest levels since August, while the VIX futures have returned to pre-pandemic levels. Meanwhile, volatility in the currency markets around the world has reached a near 4-month low, as measured by the J.P. Morgan Global FX Volatility Index.

Market sentiment is merely bobbing about amid the cross currents in global financial markets, with investors awaiting the next gust of wind that could bring them further into risk-on waters. Monday’s post-US elections cheer and vaccine optimism have clearly ebbed, with market participants now facing a tepid end to the trading week.

Central banks urge cautious optimism

That isn’t to say that investors have nary a care in the world; there are dangerous undercurrents lurking below the surface. The persistent concerns over the state of the global economy, given the alarming resurgence of Covid-19 cases across major economies, from the US to Japan, have given risk-appetite reason to pause.

Investors should pay heed to the words of caution from some of the world’s most influential central banks, namely the Fed, ECB, and the BOE, whose chiefs have just warned against getting too excited about what a vaccine could actually contribute to the global economic recovery. The vaccine, when it reaches the world, may not be potent enough to immediately heal the mental scars left by the pandemic. Such an outlook suggests that more concerted monetary and fiscal support may be required in order to facilitate a full global economic recovery, with a longer runway potentially needed before marking such an event. Investors’ fears that this Covid-19 resurgence across major economies could derail their fledgling recovery are keeping safe havens well bid, with the Dollar index not straying far from the 93.0 mark for now.

Gold set to form death cross

Speaking of safe havens, a traditional pillar of this asset class appears to be falling out of favour. Gold prices are set to form a death cross, with its 50-day simple moving average about to move below its 100-day counterpart. Such a technical episode may herald further declines in the precious metal.

However, with US Treasury yields essentially halving its advance from the first half of the week and pulling further below the psychologically-important 1% level, it allows Bullion some breathing space for now.

Still, Bullion bulls are at risk of being left at the altar, waiting on more significant policy signals as to how US inflationary pressures will be boosted. Given that Thursday’s release of the October US CPI prints came in below market expectations, Gold may find itself on a softer footing, curtailing attempts to push higher from current levels.

Unless Friday the 13th lives up to superstitions and investors are blindsided by an “unlucky” event, it’s set to be a ho-hum day in global markets.


Disclaimer: The content in this article comprises personal opinions and should not be construed as containing personal and/or other investment advice and/or an offer of and/or solicitation for any transactions in financial instruments and/or a guarantee and/or prediction of future performance. ForexTime (FXTM), its affiliates, agents, directors, officers or employees do not guarantee the accuracy, validity, timeliness or completeness, of any information or data made available and assume no liability as to any loss arising from any investment based on the same.


Forex-Time-LogoArticle by ForexTime

ForexTime Ltd (FXTM) is an award winning international online forex broker regulated by CySEC 185/12 www.forextime.com