Archive for Forex and Currency News – Page 301

What to expect from this week’s Fed meeting

By Hussein Sayed Chief Market Strategist (Gulf & MENA), ForexTime

It has been a year since the Federal Reserve was forced to lower interest rates to zero, joining other central banks globally in taking measures to prevent a severe economic downturn led by the coronavirus pandemic. The Fed emergency action back then included an additional $700 billion in asset purchases, expanded repurchase operations, swap lines with foreign banks and credit facilities to commercial banks.

Fast forward one year and the US economy looks in a better shape than most other developed economies thanks to a second heavyweight $1.9 trillion stimulus package just passed and three vaccines promising an end to the current pandemic.  Growth and employment estimates have been revised sharply higher by the private sector with Morgan Stanley now expecting the economy to grow by 8.1% this year.

Despite the rosier economic outlook, this week’s Fed meeting is expected to be absent of major policy changes. Nevertheless, how officials see the economy and rates heading over the upcoming years is crucial for investor’s decision making.

A lot has changed since December when the Fed last updated its economic projections. GDP was estimated to grow by 4.2% and unemployment to decline to 5% by year-end. Expect these forecasts to significantly change on Wednesday when the new forecasts are released. While these upgrades should be positive to risk sentiment, it is the inflation forecast that matters most to investors at this stage.

Markets are betting that inflation will rise at a faster pace than official’s estimates. Massive stimulus combined with fast vaccination rollouts and low interest rates are all seen as ingredients for rising prices. Inflation expectations have soared over the past three months with five-year breakeven rates rising to 2.6%, the highest since 2008. US 10-year Treasury yields are now trading above 1.6% and some market participants are betting the benchmark could reach 2% before year-end, which would lead to a further selloff in growth stocks that have benefited from low interest rates.

Fed Chair Jerome Powell has attempted to play down fears of rising prices on numerous occasions as he expects any surge in inflation will likely be more temporary than sustained. On Wednesday, we will get to know whether Powell and his colleagues are getting more aligned with market expectations or continue to see the matter differently.

As of December, only five out of 17 Fed officials expected interest rates to move higher by 2023. The median projections continued to reflect no interest rate hikes through 2023. However, if four or more participants joined those who expect a rate hike in two years, that would suggest an earlier exit from loose policy, and hence could bring additional volatility to equity markets and strengthen the dollar.

There is no doubt that the recent surge in US government debt yields has caught the attention of officials, but there have been no signs that they are ready to step in. So far, implementing yield curve control does not seem to be on the table, but whether the Fed will shift its asset purchases to more long-dated bonds remains a question to be answered on Wednesday. Given the current environment, if the FOMC does not take action to calm volatility in debt markets, we should be prepared for another selloff in growth stocks, especially in the highly priced Tech firms.

Disclaimer: The content in this article comprises personal opinions and should not be construed as containing personal and/or other investment advice and/or an offer of and/or solicitation for any transactions in financial instruments and/or a guarantee and/or prediction of future performance. ForexTime (FXTM), its affiliates, agents, directors, officers or employees do not guarantee the accuracy, validity, timeliness or completeness, of any information or data made available and assume no liability as to any loss arising from any investment based on the same.


Forex-Time-LogoArticle by ForexTime

ForexTime Ltd (FXTM) is an award winning international online forex broker regulated by CySEC 185/12 www.forextime.com

Euro Appears Rather Confusing

Author: Dmitriy Gurkovskiy, Chief Analyst at RoboForex

On Monday, March 15th, EUR/USD is looking rather confusing: it seems like there are no compelling reasons for the USD to get stronger but the Euro remains under pressure. The pair is mostly trading at 1.1931.

The fact that the $1.9 trillion stimulus package to help the American economy was completely approved made investors quite happy – no one expected the plan to fail but the final approval was still extremely positive. The money flow intended to support businesses and the social sphere will boost the country’s economic recovery and in the long-term, it’s very good for the “greenback”.

At the same time, social restrictions that remain in effect in European countries put pressure on the European currency. It’s not quite clear yet when such countries as Germany and France will cancel their lockdowns.

This week, there will be few statistical reports from Europe, so financial markets will have to rest upon the good stimulus-relating news from the USA.

In the H4 chart, after reaching the downside target at 1.1835, EUR/USD is forming another rising wave with the target at 1.2020; it has already completed the correctional structure towards 1.1930 and may later continue growing to reach the above-mentioned target. However, if the price continues falling to break 1.1900 and forms a downside continuation pattern, the pair may form one more descending structure towards 1.1777 and then resume trading upwards to reach 1.2000. From the technical point of view, this scenario is confirmed by MACD Oscillator: its signal line has broken 0 to the upside, thus implying a further ascending movement on the price chart. The asset may start another decline on the price chart only if the signal line steadily breaks 0 to the downside.

As we can see in the H1 chart, after completing the correction at 1.1910 along with the ascending impulse to reach 1.1964, EUR/USD has finished another correction towards 1.1930. the key scenario implies a new rising wave towards 1.1960, a breakout of which may result in a further uptrend with the target at 1.2020. From the technical point of view, this scenario is confirmed by the Stochastic Oscillator: its signal line is moving below 20, thus implying that the market is trading within the “oversold area” and may start a new structure to the upside on the price chart. The indicator line is expected to grow and break 50, thus confirming a boost in the uptrend on the price chart.

Disclaimer

Any forecasts contained herein are based on the author’s particular opinion. This analysis may not be treated as trading advice. RoboForex bears no responsibility for trading results based on trading recommendations and reviews contained herein.

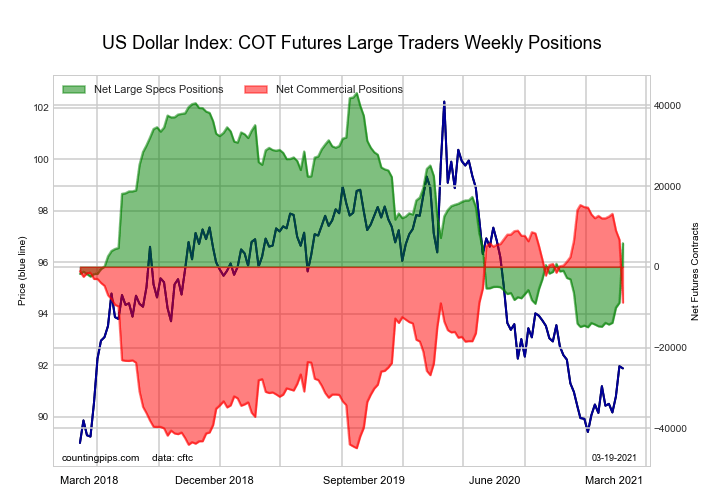
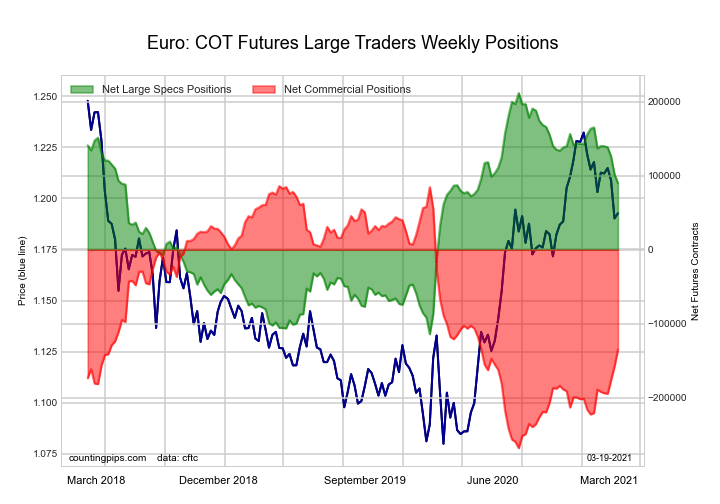
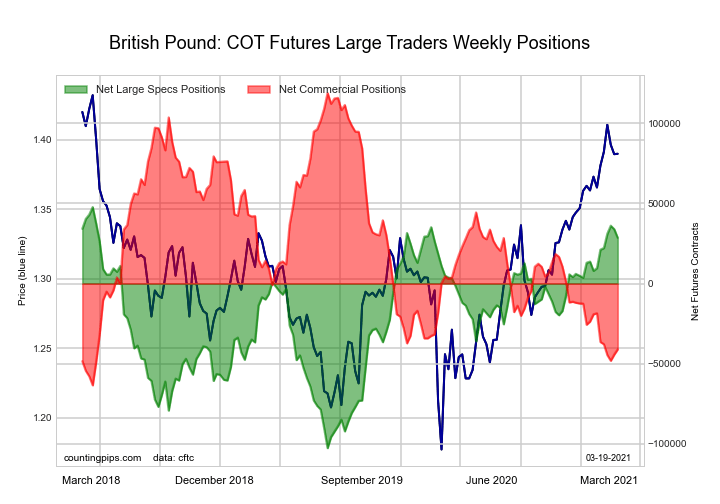
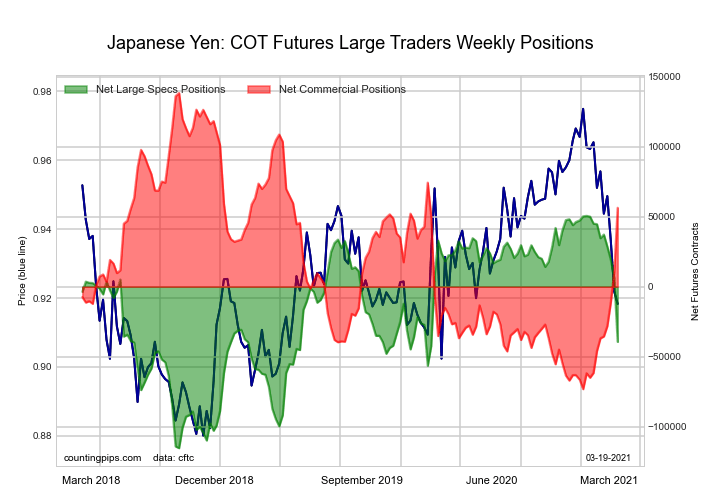
COT Currency Futures Charts: US Dollar, Euro, Yen, Pound, Bitcoin

By CountingPips.comReceive our weekly COT Reports by Email

Here are the latest charts and statistics for the Commitment of Traders (COT) data published by the Commodities Futures Trading Commission (CFTC).

The latest COT data is updated through Tuesday March 09 2021 and shows a quick view of how large traders (for-profit speculators and commercial entities) were positioned in the futures markets. All currency positions are in direct relation to the US dollar where, for example, a bet for the euro is a bet that the euro will rise versus the dollar while a bet against the euro will be a bet that the euro will decline versus the dollar.


US DOLLAR INDEX:

US DOLLAR INDEX StatisticsSPECULATORSCOMMERCIALSSMALL TRADERS
– Percent of Open Interest Longs:57.525.111.7
– Percent of Open Interest Shorts:79.08.96.4
– Net Position:-8,8876,7062,181
– Gross Longs:23,75910,3654,812
– Gross Shorts:32,6463,6592,631
– Long to Short Ratio:0.7 to 12.8 to 11.8 to 1
NET POSITION TREND:
– COT Index Score (3 Year Range Pct):10.585.747.7
– COT Index Reading (3 Year Range):Bearish-ExtremeBullish-ExtremeBearish
NET POSITION MOVEMENT INDEX:
– 6-Week Change in Strength Index:10.1-9.81.1


EURO Currency:

EURO Currency StatisticsSPECULATORSCOMMERCIALSSMALL TRADERS
– Percent of Open Interest Longs:28.755.713.4
– Percent of Open Interest Shorts:14.677.55.7
– Net Position:101,964-157,44255,478
– Gross Longs:207,588402,39496,525
– Gross Shorts:105,624559,83641,047
– Long to Short Ratio:2.0 to 10.7 to 12.4 to 1
NET POSITION TREND:
– COT Index Score (3 Year Range Pct):66.331.287.8
– COT Index Reading (3 Year Range):BullishBearishBullish-Extreme
NET POSITION MOVEMENT INDEX:
– 6-Week Change in Strength Index:-19.517.90.3


BRITISH POUND STERLING:

BRITISH POUND StatisticsSPECULATORSCOMMERCIALSSMALL TRADERS
– Percent of Open Interest Longs:33.843.520.0
– Percent of Open Interest Shorts:15.168.014.2
– Net Position:33,911-44,35410,443
– Gross Longs:61,27178,94636,212
– Gross Shorts:27,360123,30025,769
– Long to Short Ratio:2.2 to 10.6 to 11.4 to 1
NET POSITION TREND:
– COT Index Score (3 Year Range Pct):90.810.587.4
– COT Index Reading (3 Year Range):Bullish-ExtremeBearish-ExtremeBullish-Extreme
NET POSITION MOVEMENT INDEX:
– 6-Week Change in Strength Index:17.3-13.8-1.9


JAPANESE YEN:

JAPANESE YEN StatisticsSPECULATORSCOMMERCIALSSMALL TRADERS
– Percent of Open Interest Longs:30.357.89.5
– Percent of Open Interest Shorts:27.252.717.7
– Net Position:6,51410,816-17,330
– Gross Longs:64,027122,09920,013
– Gross Shorts:57,513111,28337,343
– Long to Short Ratio:1.1 to 11.1 to 10.5 to 1
NET POSITION TREND:
– COT Index Score (3 Year Range Pct):73.439.723.1
– COT Index Reading (3 Year Range):BullishBearishBearish
NET POSITION MOVEMENT INDEX:
– 6-Week Change in Strength Index:-23.234.2-64.8


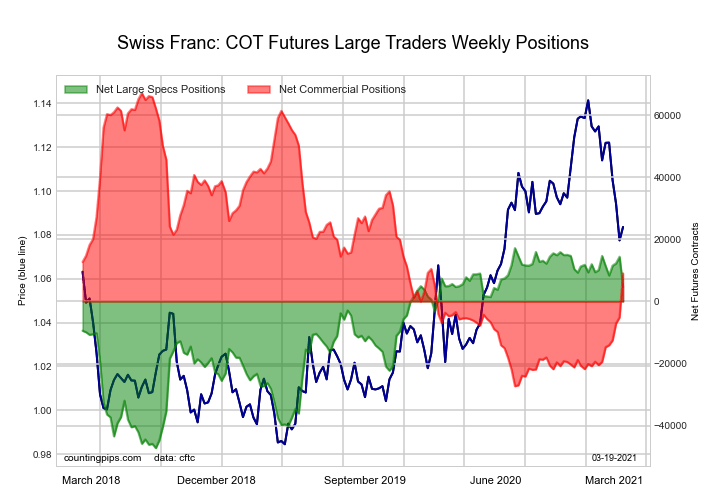
SWISS FRANC:

SWISS FRANC StatisticsSPECULATORSCOMMERCIALSSMALL TRADERS
– Percent of Open Interest Longs:41.238.117.4
– Percent of Open Interest Shorts:16.147.033.6
– Net Position:14,393-5,138-9,255
– Gross Longs:23,61421,8449,994
– Gross Shorts:9,22126,98219,249
– Long to Short Ratio:2.6 to 10.8 to 10.5 to 1
NET POSITION TREND:
– COT Index Score (3 Year Range Pct):95.723.540.5
– COT Index Reading (3 Year Range):Bullish-ExtremeBearishBearish
NET POSITION MOVEMENT INDEX:
– 6-Week Change in Strength Index:6.716.3-53.7


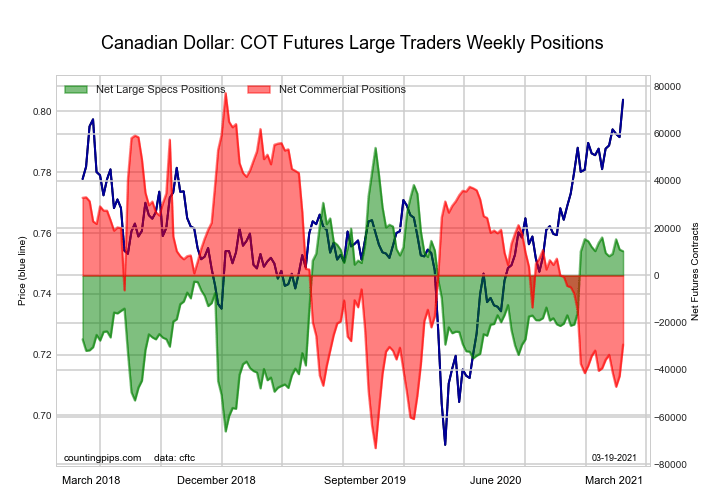
CANADIAN DOLLAR:

CANADIAN DOLLAR StatisticsSPECULATORSCOMMERCIALSSMALL TRADERS
– Percent of Open Interest Longs:28.940.728.2
– Percent of Open Interest Shorts:22.665.410.0
– Net Position:10,981-42,61731,636
– Gross Longs:50,02270,52948,876
– Gross Shorts:39,041113,14617,240
– Long to Short Ratio:1.3 to 10.6 to 12.8 to 1
NET POSITION TREND:
– COT Index Score (3 Year Range Pct):64.220.394.5
– COT Index Reading (3 Year Range):BullishBearishBullish-Extreme
NET POSITION MOVEMENT INDEX:
– 6-Week Change in Strength Index:-2.3-1.57.6


AUSTRALIAN DOLLAR:

AUSTRALIAN DOLLAR StatisticsSPECULATORSCOMMERCIALSSMALL TRADERS
– Percent of Open Interest Longs:41.131.524.5
– Percent of Open Interest Shorts:35.845.415.9
– Net Position:8,075-20,90912,834
– Gross Longs:61,84847,41336,787
– Gross Shorts:53,77368,32223,953
– Long to Short Ratio:1.2 to 10.7 to 11.5 to 1
NET POSITION TREND:
– COT Index Score (3 Year Range Pct):89.23.685.3
– COT Index Reading (3 Year Range):Bullish-ExtremeBearish-ExtremeBullish-Extreme
NET POSITION MOVEMENT INDEX:
– 6-Week Change in Strength Index:8.0-2.7-8.9


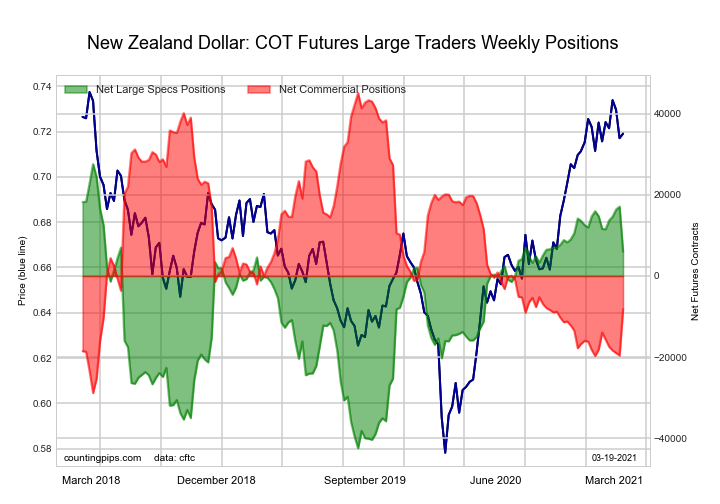
NEW ZEALAND DOLLAR:

NEW ZEALAND DOLLAR StatisticsSPECULATORSCOMMERCIALSSMALL TRADERS
– Percent of Open Interest Longs:63.616.611.0
– Percent of Open Interest Shorts:30.254.76.1
– Net Position:17,126-19,6072,481
– Gross Longs:32,6648,5205,639
– Gross Shorts:15,53828,1273,158
– Long to Short Ratio:2.1 to 10.3 to 11.8 to 1
NET POSITION TREND:
– COT Index Score (3 Year Range Pct):85.012.580.9
– COT Index Reading (3 Year Range):Bullish-ExtremeBearish-ExtremeBullish-Extreme
NET POSITION MOVEMENT INDEX:
– 6-Week Change in Strength Index:3.4-2.0-9.9


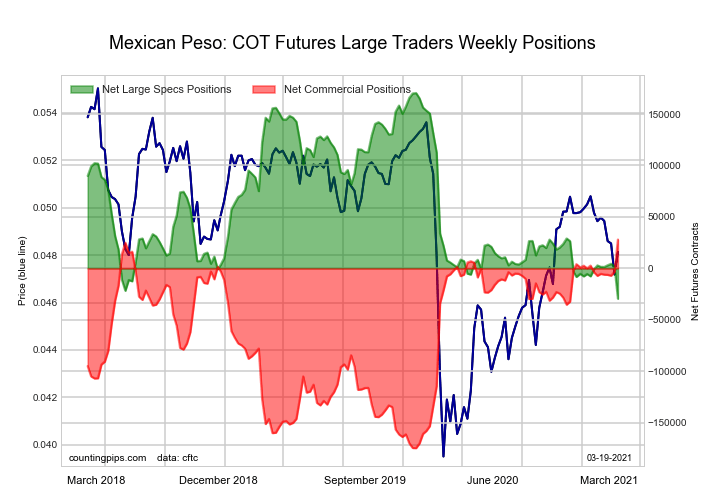
MEXICAN PESO:

MEXICAN PESO StatisticsSPECULATORSCOMMERCIALSSMALL TRADERS
– Percent of Open Interest Longs:30.154.63.2
– Percent of Open Interest Shorts:29.056.62.4
– Net Position:1,852-3,2981,446
– Gross Longs:50,34991,4095,402
– Gross Shorts:48,49794,7073,956
– Long to Short Ratio:1.0 to 11.0 to 11.4 to 1
NET POSITION TREND:
– COT Index Score (3 Year Range Pct):12.385.849.2
– COT Index Reading (3 Year Range):Bearish-ExtremeBullish-ExtremeBearish
NET POSITION MOVEMENT INDEX:
– 6-Week Change in Strength Index:1.50.2-13.6


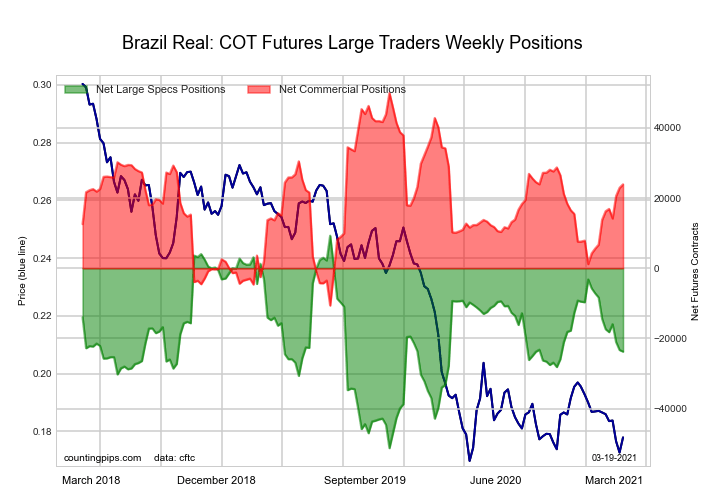
BRAZIL REAL:

BRAZIL REAL StatisticsSPECULATORSCOMMERCIALSSMALL TRADERS
– Percent of Open Interest Longs:34.058.66.6
– Percent of Open Interest Shorts:83.210.15.8
– Net Position:-23,31422,926388
– Gross Longs:16,08427,7243,141
– Gross Shorts:39,3984,7982,753
– Long to Short Ratio:0.4 to 15.8 to 11.1 to 1
NET POSITION TREND:
– COT Index Score (3 Year Range Pct):46.255.476.2
– COT Index Reading (3 Year Range):BearishBullishBullish
NET POSITION MOVEMENT INDEX:
– 6-Week Change in Strength Index:-24.726.7-15.6


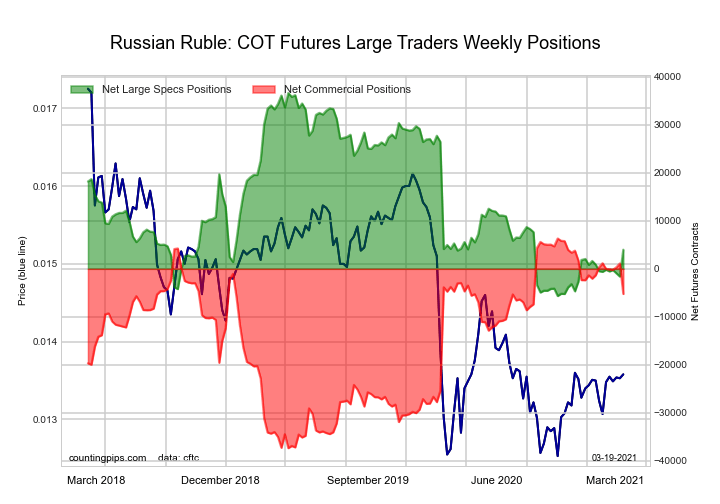
RUSSIAN RUBLE:

RUSSIAN RUBLE StatisticsSPECULATORSCOMMERCIALSSMALL TRADERS
– Percent of Open Interest Longs:30.961.17.0
– Percent of Open Interest Shorts:36.557.35.4
– Net Position:-1,6091,118491
– Gross Longs:8,99917,7942,050
– Gross Shorts:10,60816,6761,559
– Long to Short Ratio:0.8 to 11.1 to 11.3 to 1
NET POSITION TREND:
– COT Index Score (3 Year Range Pct):9.688.159.0
– COT Index Reading (3 Year Range):Bearish-ExtremeBullish-ExtremeBullish
NET POSITION MOVEMENT INDEX:
– 6-Week Change in Strength Index:-2.71.811.9


BITCOIN FUTURES:

BITCOIN StatisticsSPECULATORSCOMMERCIALSSMALL TRADERS
– Percent of Open Interest Longs:56.34.730.0
– Percent of Open Interest Shorts:78.13.09.9
– Net Position:-1,9131501,763
– Gross Longs:4,9444102,635
– Gross Shorts:6,857260872
– Long to Short Ratio:0.7 to 11.6 to 13.0 to 1
NET POSITION TREND:
– COT Index Score (3 Year Range Pct):50.157.047.7
– COT Index Reading (3 Year Range):BullishBullishBearish
NET POSITION MOVEMENT INDEX:
– 6-Week Change in Strength Index:24.5-27.9-21.6


Article By CountingPips.comReceive our weekly COT Reports by Email

*COT Report: The COT data, released weekly to the public each Friday, is updated through the most recent Tuesday (data is 3 days old) and shows a quick view of how large speculators or non-commercials (for-profit traders) were positioned in the futures markets.

The CFTC categorizes trader positions according to commercial hedgers (traders who use futures contracts for hedging as part of the business), non-commercials (large traders who speculate to realize trading profits) and nonreportable traders (usually small traders/speculators).

Don’t know which is a good broker? Check brokertested.com out. They test brokers by depositing real money and making real trades.

Find CFTC criteria here: (http://www.cftc.gov/MarketReports/CommitmentsofTraders/ExplanatoryNotes/index.htm).

Fibonacci Retracements Analysis 12.03.2021 (AUDUSD, USDCAD)

Article By RoboForex.com

AUDUSD, “Australian Dollar vs US Dollar”

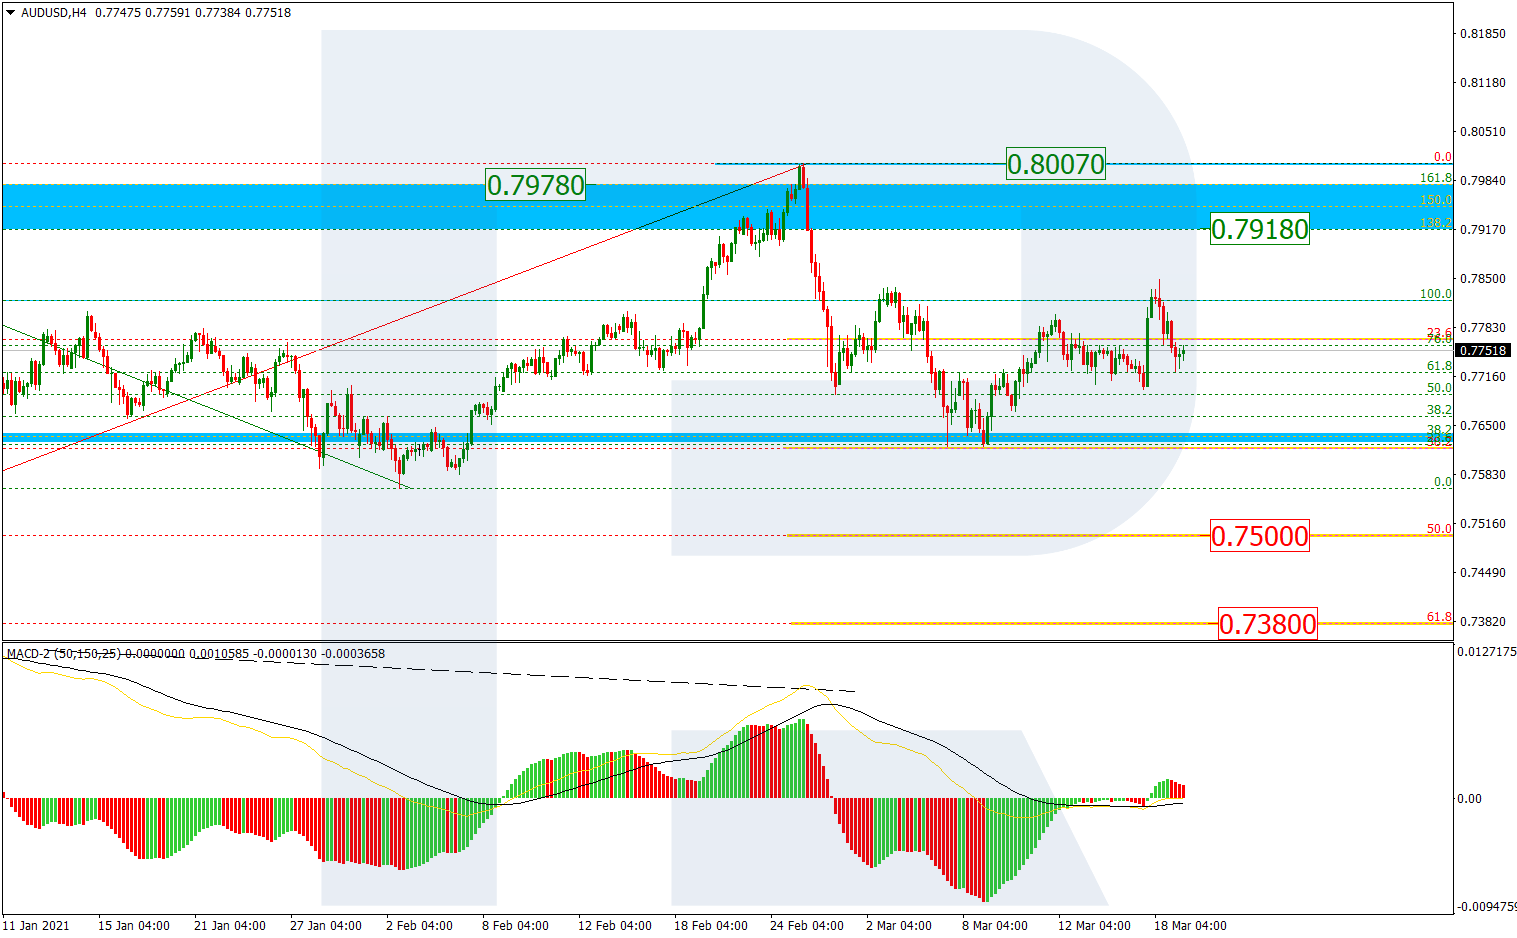
As we can see in the H4 chart, the mid-term “bearish” phase in AUDUSD is experiencing a correction to the upside. After testing 38.2% fibo at 0.7619, the asset has started a slight pullback, which may be later followed by a further decline towards 50.0% and 61.8% fibo at 0.7500 and 0.7379 respectively. Despite a global divergence, one shouldn’t exclude a further uptrend to reach the high at 0.8007. if the asset breaks this level, it may continue growing towards the long-term 50.0% fibo at 0.8292.

AUDUSD_H4
Risk Warning: the result of previous trading operations do not guarantee the same results in the future

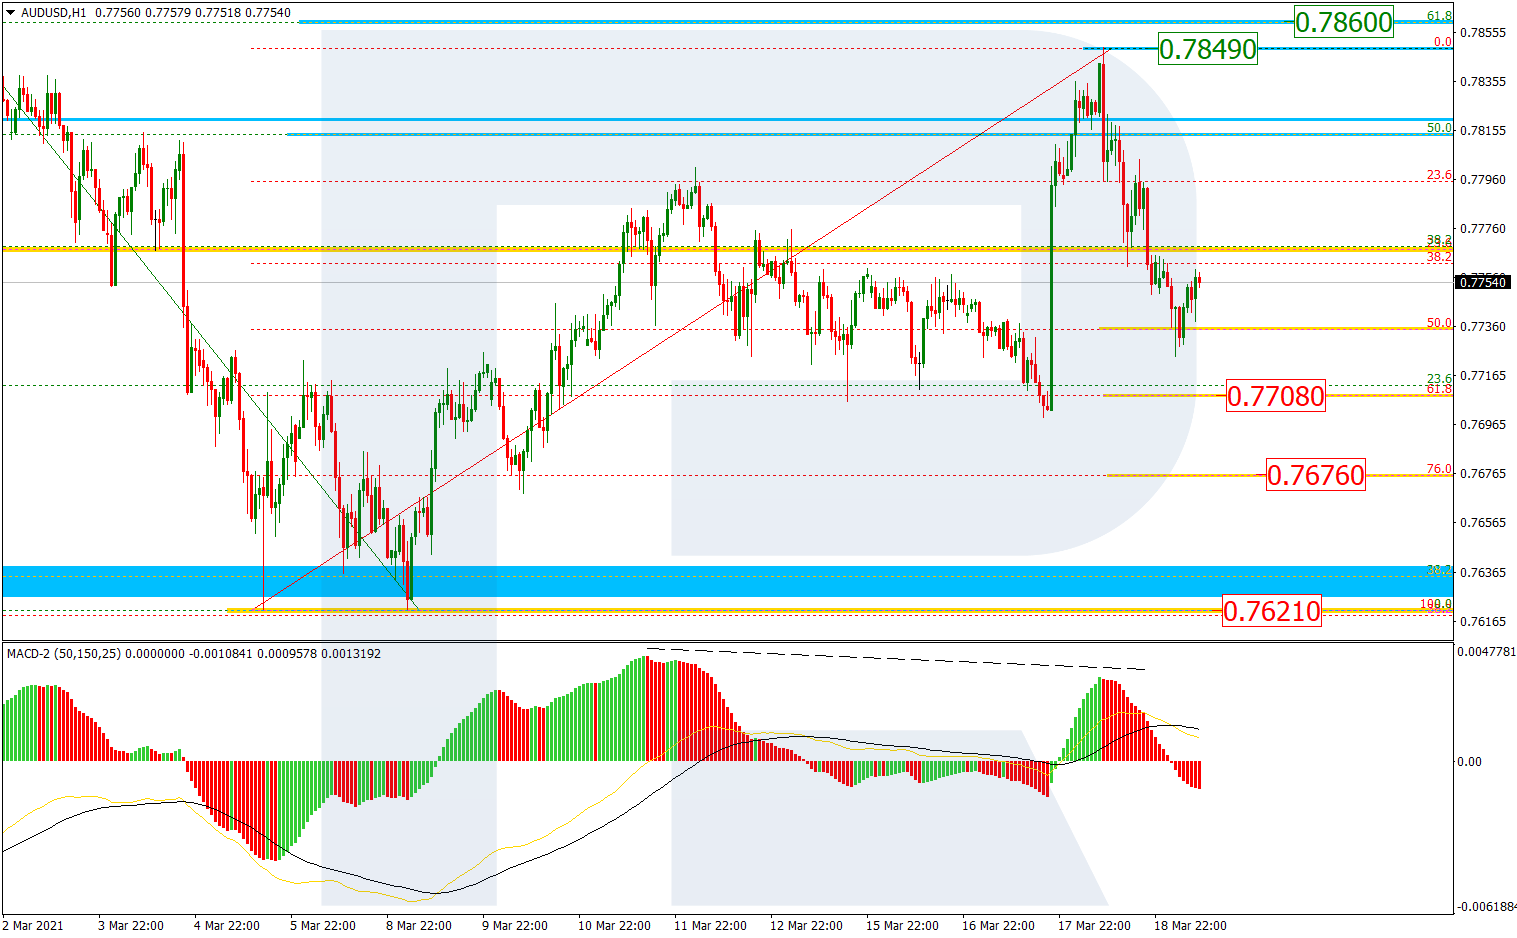
The H1 chart shows a more detailed structure of the current ascending correction, which has already reached 38.2% fibo. After a short-term decline, the price may continue growing towards 50.0% and 61.8% fibo at 0.7814 and 0.7859 respectively. A breakout of the low at 0.7621, which is the current support, may lead to a further downtrend.

AUDUSD_H1
Risk Warning: the result of previous trading operations do not guarantee the same results in the future

USDCAD, “US Dollar vs Canadian Dollar”

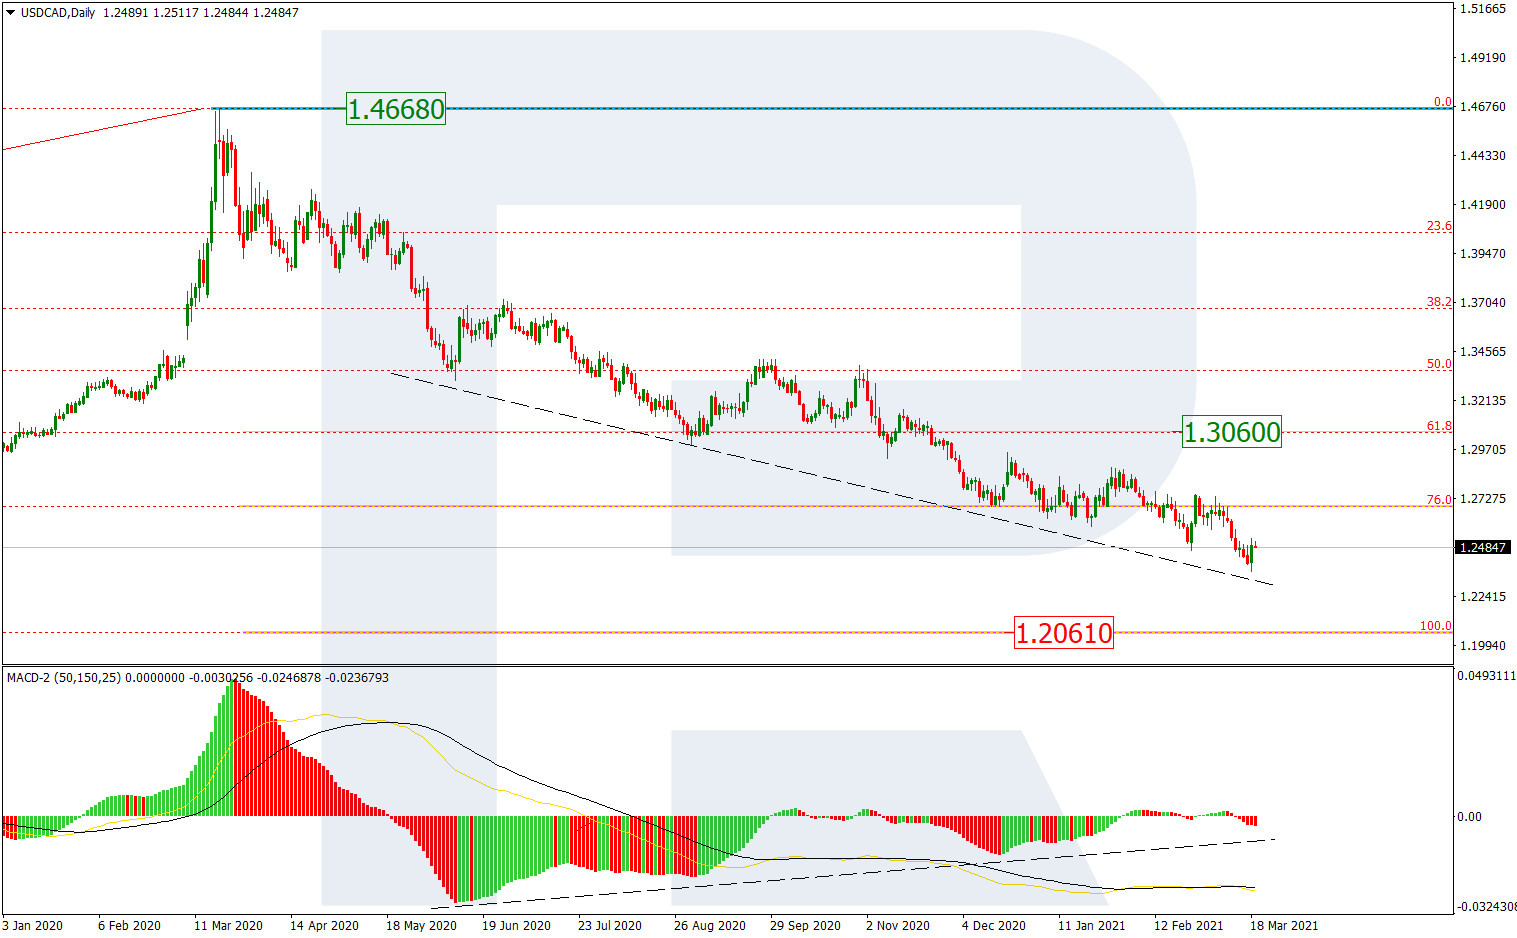
In the case of USDCAD, the situation hasn’t changed much. As we can see in the H4 chart, after completing the first impulse to the upside, the pair has started a new descending pullback, which may be later followed by another ascending impulse but much stronger than the first one. The closest upside target of the latter impulse may be the high at 1.2881 and then 23.6% fibo at 1.2987. This scenario may imply the start of a new long-term uptrend.

USDCAD_H4
Risk Warning: the result of previous trading operations do not guarantee the same results in the future

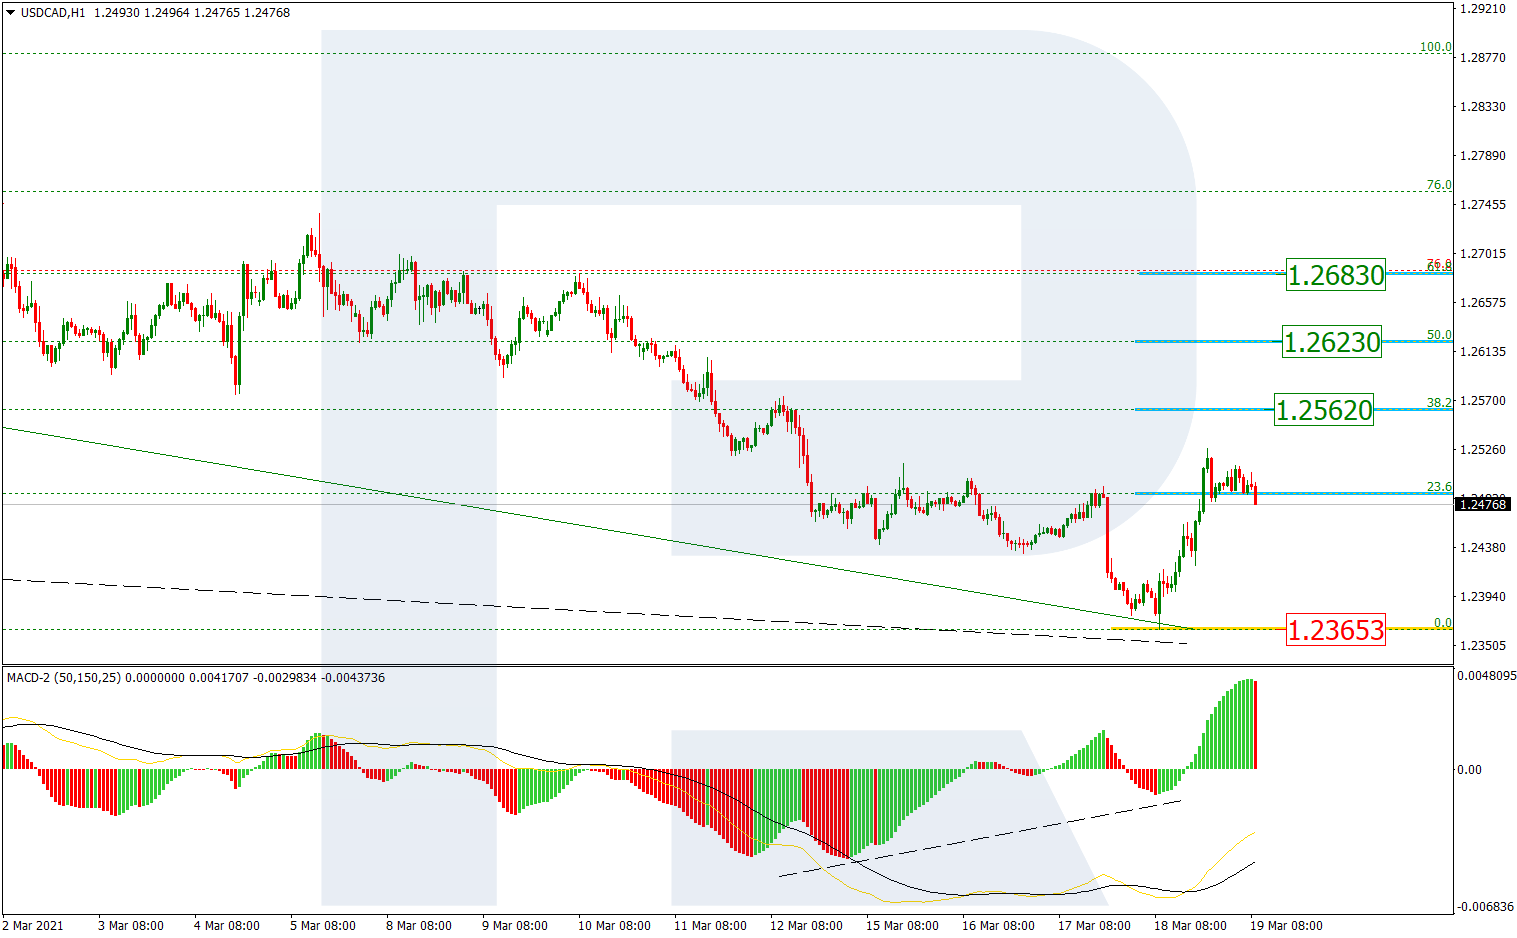
In the H1 chart, the pair has reached 76.0% fibo and may later start a new growth towards the local high at 1.2745 and then 76.0% fibo at 1.2782. The support is the low at 1.2468.

USDCAD_H1

Article By RoboForex.com

Attention!
Forecasts presented in this section only reflect the author’s private opinion and should not be considered as guidance for trading. RoboForex LP bears no responsibility for trading results based on trading recommendations described in these analytical reviews.

Ichimoku Cloud Analysis 12.03.2021 (XAUUSD, USDCAD, EURUSD)

Article By RoboForex.com

XAUUSD, “Gold vs US Dollar”

XAUUSD is trading at 1712.00; the instrument is moving inside Ichimoku Cloud, thus indicating a sideways tendency. The markets could indicate that the price may test the resistance area at 1715.00 and then resume moving downwards to reach 1635.00. Another signal in favor of a further downtrend will be a rebound from the descending channel’s upside border. However, the bearish scenario may no longer be valid if the price breaks the cloud’s upside border and fixes above 1765.00. In this case, the pair may continue growing towards 1805.00. To confirm further decline, the asset must break the rising channel’s downside border and fix below 1690.00.

XAUUSD
Risk Warning: the result of previous trading operations do not guarantee the same results in the future

USDCAD, “US Dollar vs Canadian Dollar”

USDCAD is trading at 1.2558; the instrument is moving below Ichimoku Cloud, thus indicating a descending tendency. The markets could indicate that the price may test the cloud’s downside border at 1.2605 and then resume moving downwards to reach 1.2405. Another signal in favor of a further downtrend will be a rebound from the downside border of the Triangle pattern. However, the bearish scenario may no longer be valid if the price breaks the cloud’s upside border and fixes above 1.2685. In this case, the pair may continue growing towards 1.2775.

USDCAD
Risk Warning: the result of previous trading operations do not guarantee the same results in the future

EURUSD, “Euro vs US Dollar”

EURUSD is trading at 1.1949; the instrument is moving below Ichimoku Cloud, thus indicating a descending tendency. The markets could indicate that the price may test the cloud’s downside border at 1.1965 and then resume moving downwards to reach 1.1755. Another signal in favor of a further downtrend will be a rebound from the descending channel’s upside border. However, the bearish scenario may be canceled if the price breaks the cloud’s upside border and fixes above 1.2045. In this case, the pair may continue growing towards 1.2135. To confirm further decline, the asset must break the rising channel’s downside border and fix below 1.1905..

EURUSD

Article By RoboForex.com

Attention!
Forecasts presented in this section only reflect the author’s private opinion and should not be considered as guidance for trading. RoboForex LP bears no responsibility for trading results based on trading recommendations described in these analytical reviews.

The Analytical Overview of the Main Currency Pairs on 2021.03.12

by JustForex

The EUR/USD currency pair

Technical indicators of the currency pair:
  • Prev Open: 1.1927
  • Prev Close: 1.1985
  • % chg. over the last day: +0.47%

After the ECB meeting, the euro rose even more than the previous day. The committee’s decision disappointed investors. The initial decline in German Bonds yields was almost completely leveled off in the American session. This allowed the pair to exceed the first resistance level.

Trading recommendations
  • Support levels: 1.1799, 1.1746
  • Resistance levels: 1.1991, 1.2113

The main scenario for EUR/USD is trading in a sideways range between 1.1991 – 1.1907. The ADX dropped to its lowest levels. But the MACD and moving averages indicate the likelihood of continued growth. Mixed data gives a neutral signal. The upward movement is likely to slow down or the southern pullback to the 100 SMA moving average will begin to develop.

Alternative scenario: if the price manages to gain a foothold above the level of 1.1991, the pair may return to growth to 1.2113. A break at 1.1908 could push the pair towards 1.1799.

EUR/USD
News feed for 2021.03.12:
  • – The US Producer Price Index (PPI) (m/m) (Feb) at 15:30 (GMT+2).

The GBP/USD currency pair

Technical indicators of the currency pair:
  • Prev Open: 1.3931
  • Prev Close: 1.3988
  • % chg. over the last day: +0.41%

Sterling’s slow recovery stopped at the resistance level and the pair moved to a decline in the Asian session. An increase in volatility can be expected during the day after the publication of data on GDP and manufacturing output.

Trading recommendations
  • Support levels: 1.3857, 1.3775
  • Resistance levels: 1.3997, 1.4224

The main scenario for GBP/USD is trading sideways between 1.3997 and 1.3857. The ADX shows a slight increase in the potential of the northern direction, which indicates the weakness of the bulls. As long as the price holds above the moving averages, fixing above the resistance level is still possible, but the probability is low.

Alternative scenario: if the pair consolidates above 1.3997, it resumes growth to the highs of the year. A breakdown of 1.37857 could send the price up to 1.3775.

GBP/USD
News feed for 2021.03.12:
  • – The UK GDP (q/q) at 09:00 (GMT+2);
  • – UK Manufacturing Production Output (m/m) (Jan) at 09:00 (GMT+2).

The USD/JPY currency pair

Technical indicators of the currency pair:
  • Prev Open: 108.38
  • Prev Close: 108.47
  • % chg. over the last day: +0.08%

The rise in risky assets supports the bulls in the dollar-yen pair. Despite the decline in the dollar index, the pair closed the day in positive territory. Medium-term expectations for the growth of the instrument are strengthening from a fundamental point of view.

Trading recommendations
  • Support levels: 108.35, 107.08
  • Resistance levels: 109.34, 109.86

The main scenario is buying. In the Asian session, the price rises, while the ADX shows the strength of the bullish potential above the average. The MACD is also starting to signal the beginning of an upward movement. The probability of a breakout of the first resistance level has increased.

An alternative scenario implies the price-fixing below 108.35. In this case, the pair may return to the decline to 107.08.

USD/JPY
News feed for 2021.03.12:
  • – The US Producer Price Index (PPI) (m/m) (Feb) at 15:30 (GMT+2).

The USD/CAD currency pair

Technical indicators of the currency pair:
  • Prev Open: 1.2614
  • Prev Close: 1.2529
  • % chg. over the last day: -0.67%

The Canadian currency has shown the highest volatility among the majors. A breakdown of the weekly range from top to bottom took place, which was facilitated by the growth of oil prices. A solid rally in the oil market may continue to put pressure on the pair.

Trading recommendations
  • Support levels: 1.2519, 1.2467
  • Resistance levels: 1.2592, 1.2745

The main scenario is selling. The pair has left the sideways range and moved to the south. The ADX showed high potential for the southern direction, which indicated a possible continuation of the fall to the second support level.

Alternative scenario: if the price manages to gain a foothold above 1.2592, the pair may return to the previous weekly range with the upper border at 1.2745.

USD/CAD
News feed for 2021.03.12:
  • – The US Producer Price Index (PPI) (m/m) (Feb) at 15:30 (GMT+2);
  • – Canada Employment Change (Feb) at 15:30 (GMT+2).

by JustForex


Keep Calm It’s Friday!

By Lukman Otunuga Research Analyst, ForexTime

It was a week defined by fluctuating bond yields, easing inflation fears, monetary bazookas, and U.S stimulus hopes.

Market sentiment was influenced by the developments in the global bond markets with the risk pendulum swinging back and forth. This was reflected across equities, currencies, and even commodities.

As the mood across the board improved on easing inflation fears and Congressional approval of Joe Biden’s $1.9 trillion relief package, the risk-on sentiment strengthened. Asian shares were mostly mixed on Friday thanks to a spike in U.S Treasury yields. European stocks have opened higher after the European Central Bank said it would ramp up the speed of its bond purchases. The positive vibe from Europe could find its way into Wall Street later today, especially after the S&P 500 hit a new closing high overnight.

With so much going across the board, it may be wise to fasten your seat belts and prepare for more volatility next week.

In the meantime, keep calm because it’s Friday!

Dollar eyes 92.00 

The recent jump in yields has injected dollar bulls with fresh confidence.

Prices are trading below the 92.00 resistance level as of writing. A breakout above this point could open the doors towards 92.50 and possibly higher in the week ahead. Should 92.00 prove to be reliable resistance, a decline towards 91.60 could be on the cards.


EURUSD to resume downtrend?

In a move to address rising bond yields, the European Central Bank pledged to ramp up buying government debt in the coming months.

The purchases in the next quarter will be conducted at a significantly higher pace during the first months of this year. It must be kept in mind that the overall size of the 1.85 trillion-euro pandemic-buying program remained unchanged.

The Euro tumbled following the announcement with prices approaching the 1.1900 level. Earlier in the week, we discussed the possibility of prices hitting the 1.1800 level. Well, this could become reality next week if the downside momentum holds.


GBPUSD capped below 1.4000?

There is something about the 1.4000 resistance level.

Over the past two weeks, prices have struggled to break above this point. Although the trend remains bullish on the daily charts, a move back below 1.3760 could spoil the party for bulls. Should 1.4000 prove to be an unbreakable resistance level, the GBPUSD could find itself in a downtrend in the medium to longer term.


Commodity spotlight – Gold

If one word could be used to describe Gold prices this week, the best fit could be volatile.

The precious metal was heavily influenced by fluctuating bond yields, the Dollar’s performance, and overall risk sentiment. Given how yields are rising once again, this has capped Gold’s gains with prices pressured below the $1730 level. Should the Dollar extend gains in the week ahead, this may result in the precious metal slipping below $1675 to levels seen since April 2020 around $1650. Technically, bears remain in control as there have been consistently lower lows and lower highs.

Prices are likely to trend lower until the Relative Strength Index hits the 30.00 oversold level on the daily charts.

Disclaimer: The content in this article comprises personal opinions and should not be construed as containing personal and/or other investment advice and/or an offer of and/or solicitation for any transactions in financial instruments and/or a guarantee and/or prediction of future performance. ForexTime (FXTM), its affiliates, agents, directors, officers or employees do not guarantee the accuracy, validity, timeliness or completeness, of any information or data made available and assume no liability as to any loss arising from any investment based on the same.


Forex-Time-LogoArticle by ForexTime

ForexTime Ltd (FXTM) is an award winning international online forex broker regulated by CySEC 185/12 www.forextime.com

Fibonacci Retracements Analysis 11.03.2021 (Brent, Dow Jones)

Article By RoboForex.com

Brent

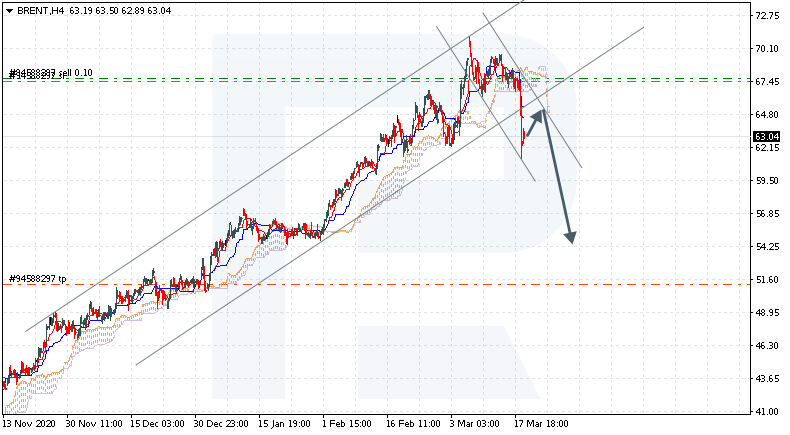
The H4 chart shows a long-term ascending tendency, which seems pretty stable. After reaching 76.9% fibo, Brent has started a new short-term pullback. Despite the stable uptrend, there is a divergence on MACD, which may hint at a reversal and possible decline towards 23.6%, 38.2%, 50.0%, and 61.8% fibo at 62.91, 57.86, 53.77, and 49.69 respectively. A breakout of the high at 71.07 may complete the correction and lead to a further uptrend to reach the fractal high at 87.09.

BRENT_H4
Risk Warning: the result of previous trading operations do not guarantee the same results in the future

As we can see in the H1 chart, the correctional decline has reached 50.0% fibo. One shouldn’t exclude a possibility of another decline towards 61.8% fibo at 65.64 but only after a breakout of the support at 66.27. If the price fails to break the support, the short-term growth may transform into a proper rising wave towards the high at 71.07, a breakout of which may result in a further uptrend to reach the post-correctional extension area between 138.2% and 161.8% fibo at 72.89 and 74.03 respectively.

BRENT_H1
Risk Warning: the result of previous trading operations do not guarantee the same results in the future

Dow Jones

The daily chart shows that the Dow Jones index continues rising and updating its highs one after another. After breaking the previous high at 29585.0, the asset is expected to continue growing towards the post-correctional extension area between 138.2% and 161.8% fibo at 33916.0 and 36629.0 respectively. At the same time, there is divergence on MACD, which may indicate a new pullback to teach 29585.0.

US30_D1
Risk Warning: the result of previous trading operations do not guarantee the same results in the future

In the H1 chart, after breaking 32084.0, the asset is moving towards the local post-correctional extension area between 138.2% and 161.8% fibo at 32669.0 and 33026.0 respectively. However, a divergence on MACD may hint at a new pullback towards the level broken earlier.

US30_H1

Article By RoboForex.com

Attention!
Forecasts presented in this section only reflect the author’s private opinion and should not be considered as guidance for trading. RoboForex LP bears no responsibility for trading results based on trading recommendations described in these analytical reviews.

Japanese Candlesticks Analysis 11.03.2021 (USDCAD, AUDUSD, USDCHF)

Article By RoboForex.com

USDCAD, “US Dollar vs Canadian Dollar”

As we can see in the H4 chart, the asset is still moving sideways. After forming a Hammer reversal pattern not far from the support level, USDCAD may reverse and correct towards the resistance area at 1.2730. After the correction, the price may resume falling to reach the next downside target at 1.2500. After that, the asset may continue forming the descending impulse.

USDCAD
Risk Warning: the result of previous trading operations do not guarantee the same results in the future

AUDUSD, “Australian Dollar vs US Dollar”

As we can see in the H4 chart, after forming several reversal patterns, such as Inverted Hammer, not far from the support area, the pair may reverse and resume growing to reach the resistance level at 0.7880. After testing it, the instrument may resume its decline to reach the downside target at the next support level at 0.7645.

AUDUSD
Risk Warning: the result of previous trading operations do not guarantee the same results in the future

USDCHF, “US Dollar vs Swiss Franc”

As we can see in the H4 chart, the correction within the uptrend continues. At the moment, after forming an Engulfing reversal pattern not far from the support area, USDCHF may reverse and resume growing. In this case, the upside target is the resistance level at 0.9410. Still, there might be an alternative scenario, according to which the asset may correct to reach 0.9220 before resuming its growth.

USDCHF

Article By RoboForex.com

Attention!
Forecasts presented in this section only reflect the author’s private opinion and should not be considered as guidance for trading. RoboForex LP bears no responsibility for trading results based on trading recommendations described in these analytical reviews.

The Analytical Overview of the Main Currency Pairs on 2021.03.11

by JustForex

The EUR/USD currency pair

Technical indicators of the currency pair:
  • Prev Open: 1.1899
  • Prev Close: 1.1928
  • % chg. over the last day: +0.24%

The European currency continues its gradual growth against the dollar, which can hardly be called stable. The daily gain was two times less than on Tuesday and corresponded to the movement within the correction. An important event is expected today – the publication of the ECB’s monetary policy decision and a press conference with the president of the bank Christine Lagarde.

Trading recommendations
  • Support levels: 1.1799, 1.1746
  • Resistance levels: 1.1952, 1.2113

The main scenario for EUR/USD is sideways trading. The ADX has shown an insignificant reaction to the growth of the pair in the American session, which so far indicates low upside potential. The MACD has consolidated above zero and the price is above the moving averages. This may indicate a slight growth of the pair, but the upward movement technically looks limited by the first resistance level.

Alternative scenario: if the price manages to gain a foothold above the level of 1.1952, the pair may return to growth to 1.2113. A breakdown of 1.1799 will resume southward movement.

EUR/USD
News feed for 2021.03.11:
  • – The ECB’s Monetary Policy Decision (Mar) at 14:45 (GMT+2);
  • – The US Initial Jobless Claims at 15:30 (GMT+2);
  • – The ECB Press Conferences at 15:30 (GMT+2).

The GBP/USD currency pair

Technical indicators of the currency pair:
  • Prev Open: 1.3886
  • Prev Close: 1.3932
  • % chg. over the last day: +0.33%

The sterling showed approximately the same pullback against the euro, which indicated the absence of strong drivers for the price movement in either direction. The UK growth expectations support the pair. However, traders are watching with dismay the growing confrontation between the EU and UK, fueled by a trade dispute.

Trading recommendations
  • Support levels: 1.3857, 1.3775
  • Resistance levels: 1.3997, 1.4224

The main scenario for GBP/USD is trading sideways between 1.3997 and 1.3857. Same as for the euro, the rise in the American session caused the ADX reaction, although less significant than during the fall. This indicates a higher likelihood of an early resumption of the downward movement.

Alternative scenario: if the pair consolidates above 1.3997, it may resume growth to the highs of the year. A breakdown of 1.37857 could send the price up to 1.3775.

GBP/USD
There is no news feed for today.

The USD/JPY currency pair

Technical indicators of the currency pair:
  • Prev Open: 108.46
  • Prev Close: 108.37
  • % chg. over the last day: -0.08%

The growth of risky assets does not allow the rapid development of the southern correction. Inflation indicators in the USA, which turned out to be in line with the forecasts, calmed investors down for a while. The stock market is growing again, supporting the pair.

Trading recommendations
  • Support levels: 108.35, 107.08
  • Resistance levels: 109.34, 109.86

The main scenario is cautious buying. In the Asian session, the price rises, while the ADX shows the strength of the bullish potential above the average. But the MACD is still near zero and the price is close to the moving averages. This indicates a decrease in volatility at least until the American session.

An alternative scenario implies the price-fixing below 108.35. In this case, the pair may return to the decline to 107.08.

USD/JPY
News feed for 2021.03.11:
  • – The US Initial Jobless Claims at 15:30 (GMT+2).

The USD/CAD currency pair

Technical indicators of the currency pair:
  • Prev Open: 1.2635
  • Prev Close: 1.2615
  • % chg. over the last day: -0.16%

The Bank of Canada did not surprise the market on Wednesday. In fact, the monetary regulator has left its previous statements unchanged. The Canadian dollar was trading calmly with prevailing bearish pressure on the back of a declining dollar index and rising oil prices.

Trading recommendations
  • Support levels: 1.2592, 1.2467
  • Resistance levels: 1.2745, 1.2845

The main scenario is trading in the sideways range 1.2745 – 1.2592. The pair is still in the weekly sideways range, and the technical indicators remain unchanged. This indicates a greater likelihood of the continuation of the flat. But, from a fundamental point of view, a rise in oil prices can provoke a breakdown of the lower boundary at any time.

Alternative scenario: if the price manages to gain a foothold above 1.2745, the pair may resume growth to 1.2845. A breakdown of 1.2592 will resume southward movement.

USD/CAD
There is no news feed for today.

by JustForex


This article reflects a personal opinion and should not be interpreted as an investment advice, and/or offer, and/or a persistent request for carrying out financial transactions, and/or a guarantee, and/or a forecast of future events.