Archive for Forex and Currency News – Page 302

Moderate growth of inflation allowed the stock market to resume its rally

by JustForex

Weaker-than-expected inflation data eased concerns concerning the need to scale back the Fed’s stimulus program. After the release of the report, the growth of Treasury yields stopped, and at the end of the American session, the yield fell to 1.50%. Cyclical stocks continue to grow amid expectations that the economic recovery will accelerate following the entry into force of the stimulus package from the US government.

The consumer price index, excluding food and fuel, increased by 0.1% compared to January. The annual rate is kept at 1.3%. The general CPI increased by 0.4% compared to the previous month and by 1.7% from a year earlier.

Against the background of low inflation rates, the stock market’s growth resumed. Dow Jones has updated its annual highs. Asian stocks followed the US stocks. China’s CSI 300 has indicated the largest gain in two months. S&P 500 futures continue to rise in the European session and are already close to this year’s records.

Meanwhile, the Bank of Canada left monetary policy unchanged. Interest rates and asset purchases remain the same. In Wednesday’s statement in Ottawa, there is a promise not to raise interest rates on loans until the damage from the pandemic is completely reversed. Also, the monetary regulator stressed that the labor market is still far from recovery.

There are no changes in the statement after the last meeting of the Bank of Canada in January, which is slightly contrary to market expectations. According to economists, the expected rapid rebound of the economy this year may lead to a reduction in asset purchases by the monetary regulator. According to the Canadian Imperial Bank of Commerce, the signal for a reduction in the volume of stimulus measures will still be received at its April meeting when the quarterly forecasts will be updated and a press conference will be held.

Main market quotes:

S&P 500 (F) 3,923.62 +27.12 (+0.70%)

Dow Jones 32,297.02 +464.28 (+1.46%)

DAX 14,539.15 -1.10 (-0.01%)

FTSE 100 6,733.65 +8.05 (+0.12%)

USD Index 91.580 -0.248 (-0.27%)

Important events:
  • – ECB Interest Rate Decision (Mar) at 14:45 (GMT+2);
  • – US Initial Jobless Claims at 15:30 (GMT+2);
  • – ECB press conference at 15:30 (GMT+2).

by JustForex


This article reflects a personal opinion and should not be interpreted as an investment advice, and/or offer, and/or a persistent request for carrying out financial transactions, and/or a guarantee, and/or a forecast of future events.

Euro set to react to ECB meeting today

By Han Tan Market Analyst, ForexTime

Next up on this week’s list of major market events is the European Central Bank which has a policy decision due today.

In the leadup to today’s ECB meeting, the euro has only managed to eke out a 0.1 percent advance against the US dollar so far this week, making it the smallest gainer on a week-to-date basis among G10 currencies versus the greenback. On a year-to-date basis, EURUSD has declined by more than 2%, nearly testing its 200-day simple moving average (SMA) as a support level on Monday before pulling back up.

Traders will be closely monitoring whether the world’s most-traded currency pair can breach 1.195, if it gets there, which was the support region for the currency pair in early February. Failure to breach could then see the currency pair come face to face with its 200-day SMA.


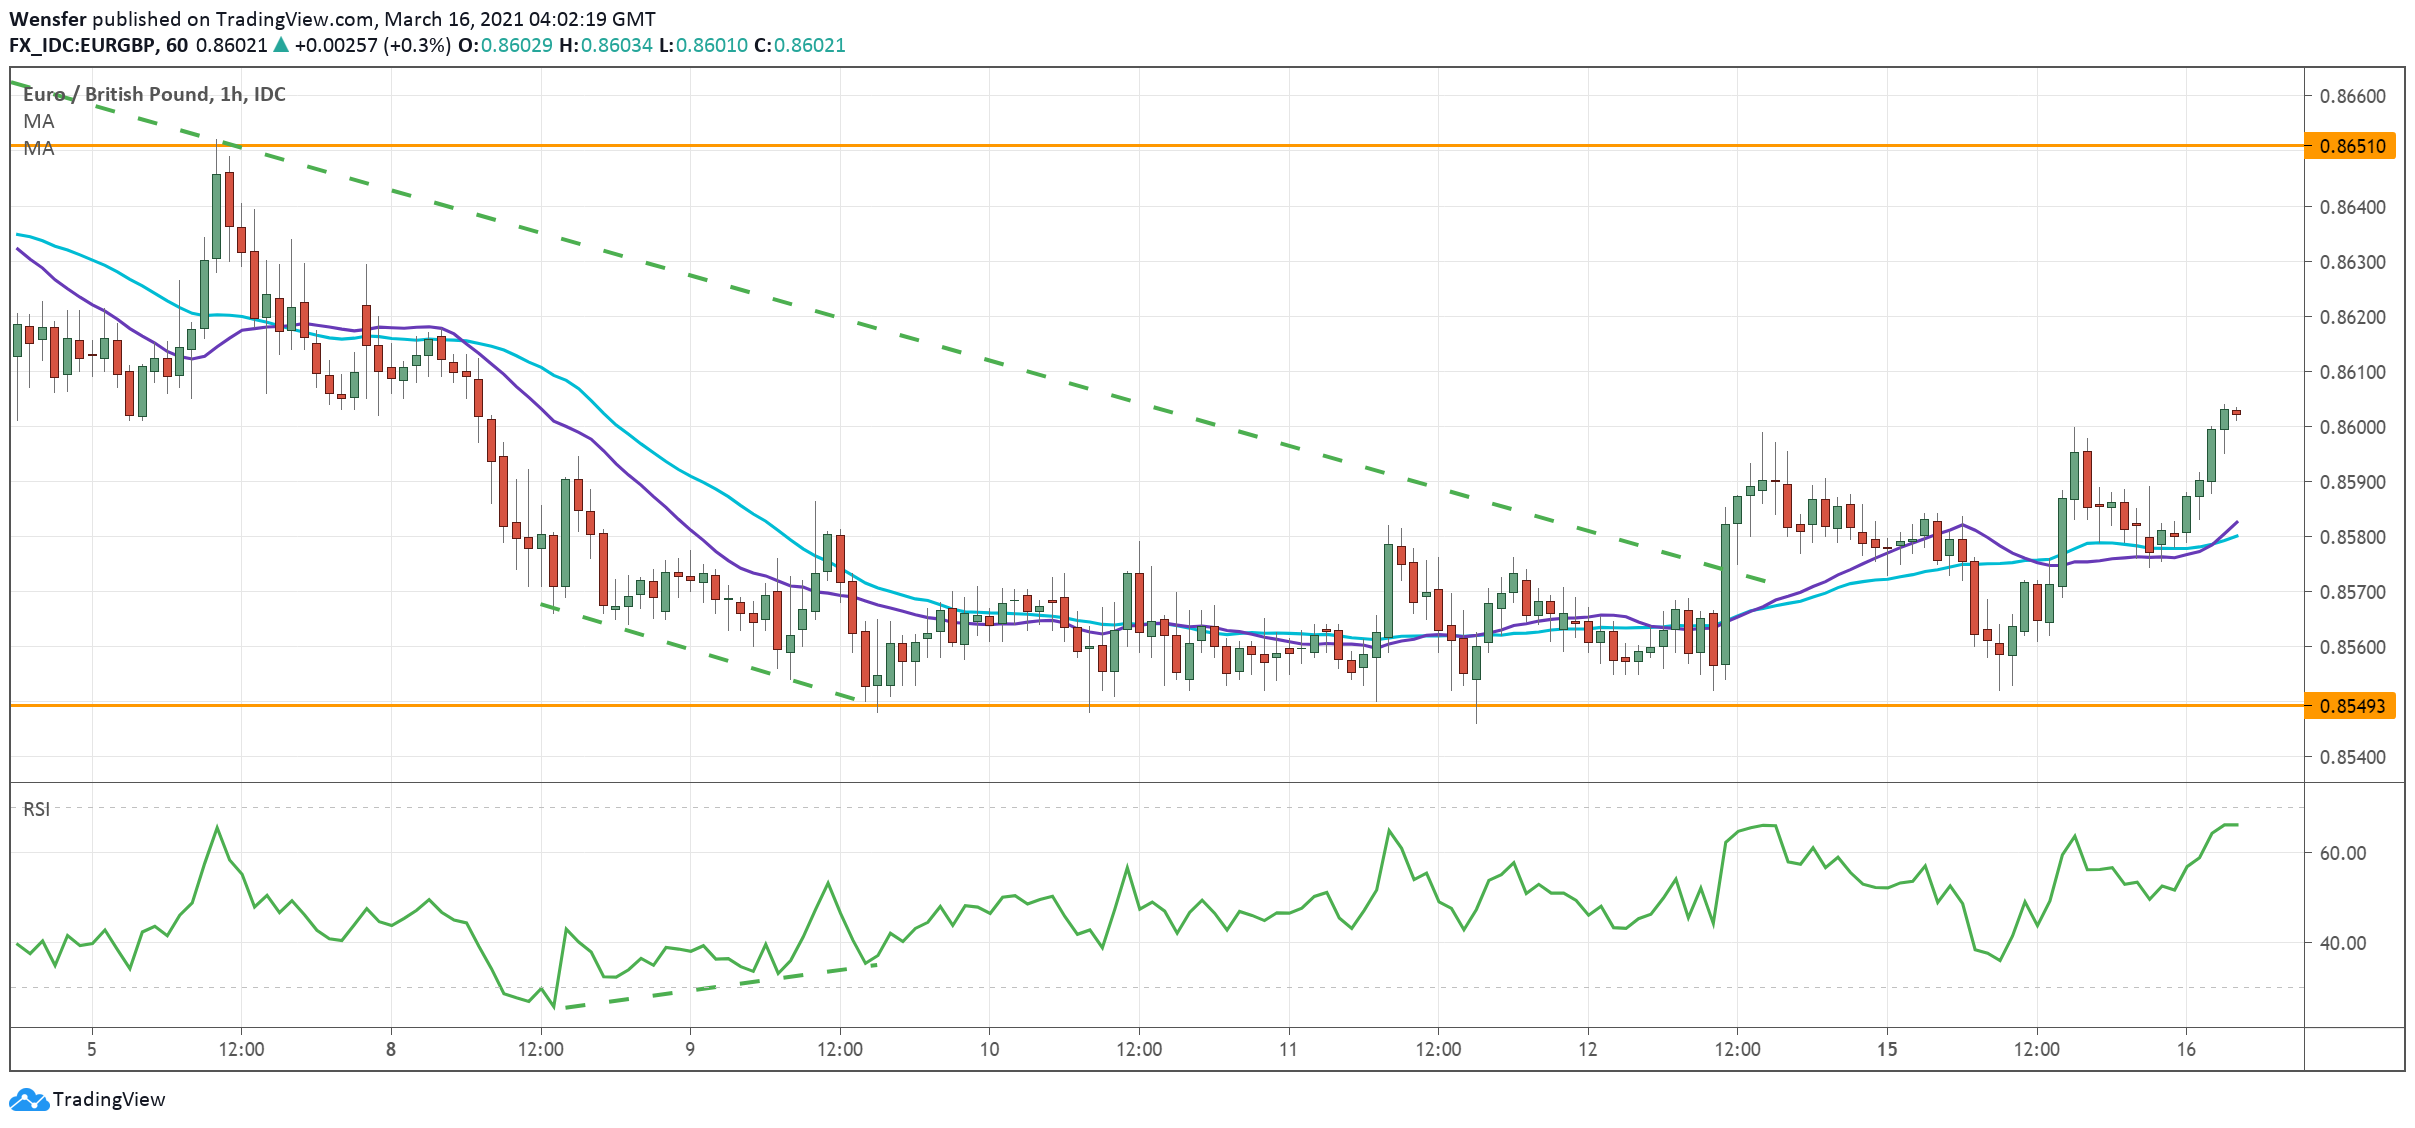
Meanwhile, EURGBP has weakened by more than 4% so far in 2021. However, this currency pair may be due for a pullback in the not-too-distant future, given that its 14-day relative strength index has already broken below the 30 line and is now in oversold territory.


What are markets expecting out of the ECB today?

Today, the European Central Bank is highly unlikely to adjust interest rates or its asset purchases programme. The ECB is also set to unveil its latest economic forecasts, which is expected to show policymakers’ belief that any inflation spike won’t stick around for long.

However, it’ll be the central bank’s characterization of the surging bond yields that harbours the biggest potential to jolt markets today.

Note that rising bond yields can be a double-edged sword. On one hand, it can be interpreted as a sign of economic optimism. On the other hand, it presents higher borrowing costs which impedes the government’s ability to raise funds for the economic recovery.

Hence, the ECB’s interpretation of the unsettling climb in bond yields, which has roiled global markets in recent weeks, could be crucial in determining how European assets perform in the immediate aftermath.

Watch out for these two words in particular: “unwarranted tightening”.

If ECB President Christine Lagarde uses those two words to describe how bond yields have been behaving of late, that could signal to the markets that the ECB is ready to step in to quell the bond rout.

And if markets believe that the central bank wants to and can push yields lower, that could heap even more downward pressure on the euro (note that the bloc’s currency holds a year-to-date decline against most of its G10 peers, except for the Swedish Krona, Japanese Yen, and the Swiss Franc).

Could EURUSD break below its 200-day SMA support?

And if European bond yields are suppressed while Treasury yields keep climbing, especially if today’s auction of $24 billion in 30-year Treasuries is met with lackluster demand, then the widening gap between European and US bond yields could even drag EURUSD below its 200-day SMA.

For now, it remains a battle of wits between the markets and the ECB in ascertaining how high yields can go. And Lagarde’s words may play an outsized role in determining the trajectory for European bond yields, and for the euro.


Disclaimer: The content in this article comprises personal opinions and should not be construed as containing personal and/or other investment advice and/or an offer of and/or solicitation for any transactions in financial instruments and/or a guarantee and/or prediction of future performance. ForexTime (FXTM), its affiliates, agents, directors, officers or employees do not guarantee the accuracy, validity, timeliness or completeness, of any information or data made available and assume no liability as to any loss arising from any investment based on the same.


Forex-Time-LogoArticle by ForexTime

ForexTime Ltd (FXTM) is an award winning international online forex broker regulated by CySEC 185/12 www.forextime.com

Fibonacci Retracements Analysis 10.03.2021 (GBPUSD, EURJPY)

Article By RoboForex.com

GBPUSD, “Great Britain Pound vs US Dollar”

As we can see in the H4 chart, the situation hasn’t changed much. After finishing the uptrend and then reaching 23.6% fibo, GBPUSD is starting a short-term pullback, which may be followed by a further decline towards 38.2%, 50.0%, and 61.8% fibo at 1.3642, 1.3459, and 1.3273 respectively. A breakout of the high will result in a further uptrend towards the long-term fractal high at 1.4376.

GBPUSD_H4
Risk Warning: the result of previous trading operations do not guarantee the same results in the future

The H1 chart shows an ascending correctional movement after a convergence on MACD, which has already reached 23.6% and may later continue towards 38.2%, 50.0%, and 61.8% fibo at 1.3954, 1.4010, and 1.4064 respectively. A breakout of the low at 1.3778 will result in a further mid-term downtrend.

GBPUSD_H1
Risk Warning: the result of previous trading operations do not guarantee the same results in the future

EURJPY, “Euro vs. Japanese Yen”

As we can see in the H4 chart, after entering the post-correctional extension area between 138.2% and 161.8% fibo at 129.16 and 130.43 respectively, EURJPY is forming the Triangle correctional pattern. Possibly, the price may complete this correctional movement by breaking the pattern to the upside. After that, the instrument may continue trading within the uptrend to reach 76.0% at 131.95.

EURJPY_H4
Risk Warning: the result of previous trading operations do not guarantee the same results in the future

The H1 chart shows a more detailed structure of the current correction. The first descending wave couldn’t reach 38.2% fibo at 128.11 but the rising structure that followed also failed to update the high at 129.98. In this case, the market may start a new decline to reach 50.0% and 61.8% fibo at 127.54 and 126.96 respectively.

EURJPY_H1

Article By RoboForex.com

Attention!
Forecasts presented in this section only reflect the author’s private opinion and should not be considered as guidance for trading. RoboForex LP bears no responsibility for trading results based on trading recommendations described in these analytical reviews.

Ichimoku Cloud Analysis 10.03.2021 (NZDUSD, USDMXN, EURUSD)

Article By RoboForex.com

NZDUSD, “New Zealand Dollar vs US Dollar”

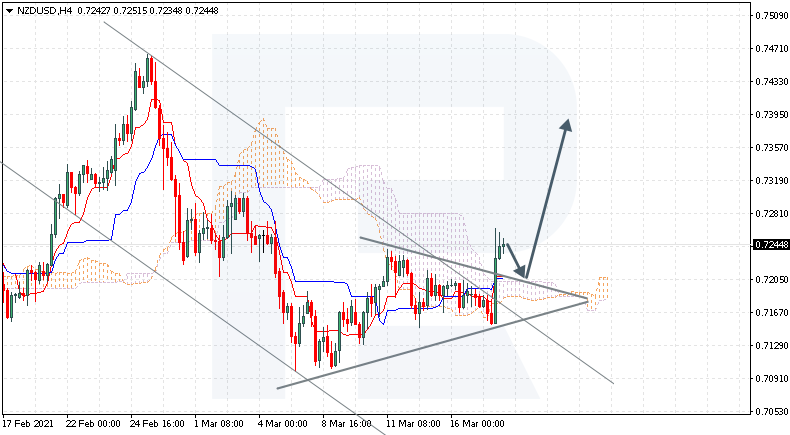
NZDUSD is trading at 0.7132; the instrument is moving inside Ichimoku Cloud, thus indicating a sideways tendency. The markets could indicate that the price may test the cloud’s upside border at 0.7140 and then resume moving downwards to reach 0.6965. Another signal in favor of a further downtrend will be a rebound from the upside border of the Triangle pattern. However, the bearish scenario may be canceled if the price breaks the cloud’s upside border and fixes above 0.7205. In this case, the pair may continue growing towards 0.7295. To confirm further decline, the asset must break the pattern’s downside border and fix below 0.7095.

NZDUSD
Risk Warning: the result of previous trading operations do not guarantee the same results in the future

USDMXN. “US Dollar vs Mexican Peso”

USDMXN is trading at 21.26; the instrument is moving above Ichimoku Cloud, thus indicating an ascending tendency. The markets could indicate that the price may test Tenkan-Sen and Kijun-Sen at 21.45 and then resume moving upwards to reach 22.05. Another signal in favor of a further uptrend will be a rebound from the rising channel’s downside border. However, the bullish scenario may no longer be valid if the price breaks the cloud’s downside border and fixes below 20.50. In this case, the pair may continue falling towards 19.65.

USDMXN
Risk Warning: the result of previous trading operations do not guarantee the same results in the future

EURUSD, “Euro vs US Dollar”

EURUSD is trading at 1.1870; the instrument is moving inside Ichimoku Cloud, thus indicating a sideways tendency. The markets could indicate that the price may test the cloud’s upside border at 1.1895 and then resume moving downwards to reach 1.1675. Another signal in favor of a further downtrend will be a rebound from the descending channel’s upside border. However, the bearish scenario may be canceled if the price breaks the cloud’s upside border and fixes above 1.1920. In this case, the pair may continue growing towards 1.2010.

EURUSD

Article By RoboForex.com

Attention!
Forecasts presented in this section only reflect the author’s private opinion and should not be considered as guidance for trading. RoboForex LP bears no responsibility for trading results based on trading recommendations described in these analytical reviews.

The Analytical Overview of the Main Currency Pairs on 2021.03.10

by JustForex

The EUR/USD currency pair

Technical indicators of the currency pair:
  • Prev Open: 1.1847
  • Prev Close: 1.1900
  • % chg. over the last day: +0.45%

The European currency has regained some of the losses incurred on Tuesday within the expected technical pullback. This week, investors await the ECB’s decision on the further stimulus of the Eurozone economy and the need to put pressure on bond yields. In this light, the growth of the euro may be limited.

Trading recommendations
  • Support levels: 1.1799, 1.1746
  • Resistance levels: 1.1952, 1.2113

The main scenario for trading EUR/USD is selling. The ADX is reacting to any southern price movement, which indicates the likelihood of a resumption of the decline soon. After the pullback, there is a slight decrease in bearish pressure, which may signal a short-term stop in the pair. But as long as the price stays below the moving averages, selling remains relevant.

Alternative scenario: if the price gains a foothold above the level of 1.1952, the pair may reach the 1.2113 level.

EUR/USD
News feed for 2021.03.10:
  • – The US Core Consumer Price Index (m/m) (Feb) at 15:30 (GMT+2).

The GBP/USD currency pair

Technical indicators of the currency pair:
  • Prev Open: 1.3818
  • Prev Close: 1.3885
  • % chg. over the last day: +0.48%

The sterling has shown about the same pullback as the euro, which indicates the absence of strong drivers for the price movement in either direction. But the British currency still looks stronger than the others. New OECD forecasts released on Tuesday show an improvement in economic growth expectations by 0.9% to 5.1% in 2021.

Trading recommendations
  • Support levels: 1.3775, 1.3680
  • Resistance levels: 1.3924, 1.3997

The main scenario for GBP/USD is trading sideways between 1.3924 and 1.3775. A decline in the Asian session has triggered a strong ADX reaction, which may signal a resumption of southward direction. But the rest of the indicators point to flat. Another important detail is that the price has stopped near the SMA 50 moving average. This casts doubt on the continuation of the pair’s fall.

Alternative scenario: if the pair consolidates above 1.3924, it may resume its growth. A breakdown of 1.3775 could trigger a further decline.

GBP/USD
There is no news feed for today.

The USD/JPY currency pair

Technical indicators of the currency pair:
  • Prev Open: 108.87
  • Prev Close: 108.47
  • % chg. over the last day: -0.37%

The decline in Treasury yields and the technical pullback of the dollar index put downward pressure on the pair. At the same time, a bearish engulfing candlestick has formed on the daily chart, which may signal the beginning of a deep correction. However, the fundamental background may prevent further decline in the dollar index. The expected US inflation data may support dollar bulls.

Trading recommendations
  • Support levels: 107.08, 106.12
  • Resistance levels: 109.34, 109.86

The main scenario is cautious buying. The pullback on Tuesday did not affect the technical indicators of the northern impulse. The price holds above the moving averages, while the ADX only reacts to price increases. These are all signs of the presence of bullish power in the pair.

An alternative scenario implies the price-fixing below 108.36. In this case, the pair may return to the decline to 107.08.

USD/JPY
News feed for 2021.03.10:
  • – The US Core Consumer Price Index (m/m) (Feb) at 15:30 (GMT+2).

The USD/CAD currency pair

Technical indicators of the currency pair:
  • Prev Open: 1.2661
  • Prev Close: 1.2636
  • % chg. over the last day: -0.20%

USD/CAD continues to remain in a narrow sideways range. The intraday price movement leaves long shadows in both directions, which is a sign of a flat. But today the pair may get out of the narrow range after the publication of the decision of the Bank of Canada.

Trading recommendations
  • Support levels: 1.2592, 1.2467
  • Resistance levels: 1.2745, 1.2845

The main scenario is trading in a sideways range between 1.2745 and 1.2592. None of the indicators signal the beginning of any movement in the medium term. The MACD is near zero, and the price shows frequent breakouts of the moving averages. This indicates the continuation of trading in a narrow sideways range.

Alternative scenario: if the price manages to gain a foothold above 1.2745, the pair may resume growth to 1.2845. A breakdown of 1.2592 will resume southward movement.

USD/CAD
News feed for 2021.03.10:
  • – The US Core Consumer Price Index (m/m) (Feb) at 15:30 (GMT+2);
  • – Bank of Canada Interest Rate Decision at 17:00 (GMT+2);
  • – US Crude Oil Reserves at 17:00 (GMT+2).

by JustForex


This article reflects a personal opinion and should not be interpreted as an investment advice, and/or offer, and/or a persistent request for carrying out financial transactions, and/or a guarantee, and/or a forecast of future events.

The stock market is recovering after updated forecasts by the OECD. The dollar is correcting

by JustForex

After a four-day rise of the dollar, the foreign exchange market began to show a correction tendency. Against the backdrop of falling oil prices, the government bonds yield declined. American Treasuries stabilized near 1.55%, which led to a slight pullback of the dollar index. At the same time, the 2-year US bonds yield is indicating an upward tendency, remaining slightly above 0.15%.

The Nasdaq 100 gained 4% amid prices leap of some of the most expensive stocks, such as Tesla Inc., which increased by 20%. The resumption of the bullish rally is based on optimism about economic growth. On Tuesday, OECD released its updated forecasts, which boosted the need for risky assets. According to the organization, the US economic recovery, boosted by President Joe Biden’s stimulus package, will help to accelerate the global economic recovery.

The global growth forecast for 2021 has been revised from 4.2% to 5.6%. For the United States, the expected figures were twice as high as in December forecasts – 6.5%. The OECD models are based on the assumption that the US government stimulus measures will increase the volume of production by about 3-4%, which will add 1% to the total world production.

But economic growth is expected to be unbalanced. OECD reduced growth estimates for European countries. For Germany, estimates of growth declined by 0.2%, for France – by 0.6%, and for Italy – by 1.0%. OECD forecasts for this and the next year assume that the economies of Italy, Spain, and the United Kingdom will not make up for GDP losses even by the end of 2022. Trade Department data that was released on Tuesday shows that Eurozone GDP decreased by 0.7% in the last three months of 2020, which is 0.1% more than it was previously calculated.

The market will now shift its focus to central banks meetings from Tokyo to Ottawa. The decision of the Bank of Canada is expected to be published today, and after that, the investors will look forward to the announcement of the results of the ECB meeting on Thursday. Against this background, volatility can gradually increase.

Main market quotes:

S&P 500 (F) 3,871.62 -1.63 (-0.04%)

Dow Jones 31,832.74 +30.30 (+0.10%)

DAX 14,456.05 +18.11 (+0.13%)

FTSE 100 6,702.04 -28.30 (-0.42%)

USD Index 92.093 +0.129 (+0.14%)

Important events:
  • – US Core Consumer Price Index (m/m) (Feb) at 15:30 (GMT+2);
  • – Bank of Canada Interest Rate Decision at 17:00 (GMT+2);
  • – US Crude Oil Reserves at 17:00 (GMT+2).

by JustForex


This article reflects a personal opinion and should not be interpreted as an investment advice, and/or offer, and/or a persistent request for carrying out financial transactions, and/or a guarantee, and/or a forecast of future events.

Dollar index, gold on inflation watch

By Han Tan Market Analyst, ForexTime

Global investors are readying themselves for two major events today:

  1. The February US consumer price index (CPI) announcement
  2. The House of Representative’s possible vote on the $1.9 trillion fiscal stimulus plan

Both events could spur inflation expectations higher and trigger a massive reaction in Treasury yields, which could then jolt multiple major assets including the dollar, gold, and tech stocks.

Wall Street is expecting the headline CPI to register a year-on-year growth of 1.7%, which would be its highest reading since February 2020, before the pandemic took hold. And the vote on President Joe Biden’s pandemic relief bill, if passed, could strengthen investors’ belief that inflation will come roaring back.

Heightened inflation expectations are arguably the biggest talking point in global markets at the moment. And with this viewpoint gaining critical mass, investors are forced to reassess their portfolios.

Today’s release of the CPI figures, though backward-looking, may lend more insight as to whether markets are getting ahead of themselves, or if their repositioning of late has been warranted.

92 DXY depends on higher-than-expected CPI

At the onset of 2021, most on Wall Street were firm in their belief that the US dollar would weaken further, based on the idea that faster inflation would erode the greenback’s purchasing power.

Yet the dollar index (DXY) has advanced by more than 2% on a year-to-date basis, thank to those rising Treasury yields which in turn make dollar assets more appealing.

So here we are, with the Dollar index hovering just below the 92 mark at the time of writing, despite completing a head-and-shoulders pattern earlier this year.

The DXY’s pullback yesterday to around the 92 line was in tandem with moderating yields on Tuesday, as 10-year yields fell by some 7 basis points. There were technical factors at play as well, with the DXY’s 14-day relative strength index (RSI) hitting the 70 line. Such a technical event typically heralds an immediate pullback, as was the case overnight.

Although momentum is still pointing north, the dollar index’s ability to hang on to the 92 handle may depend on the upcoming inflation data release.

A lower-than-expected CPI could mean further moderation in Treasury yields, which in turn should translate into the DXY paring more of its recent gains. However, the passage of the fiscal stimulus plan could convince investors to stick with their inflation outlook, which has supported the DXY so far in 2021.

Gold resurfaces above $1700 … for now

Gold prices have been able to come up for air above the psychologically-important $1700 level, thanks to the moderating dollar.

Note that bullion has an inverse relationship with the greenback; each tends to move in the opposite direction to the other. From a technical perspective, spot gold’s reprieve comes after its 14-day RSI hit oversold territory which triggered the slight recovery.

Still, gold’s downward trend since posting its new record high in August remains firmly intact, with its 100-day simple moving average (SMA) having followed its 50-day counterpart to move below the 200-SMA. These technical events are referred to as a ‘death cross’.

Although gold has historically been seen as a hedge against inflation (preserve wealth when prices are rising), it now has to contend with rising Treasury yields too. Given the fact that bullion is a zero-yielding asset, higher Treasury yields make gold less appealing. And even though real yields (yields after stripping out inflation) remain in negative territory, gold is still finding it extremely tough to garner favour among investors in this current market climate.

So if today’s events translate into higher yields, that could drag gold back below the $1700 once more.


Disclaimer: The content in this article comprises personal opinions and should not be construed as containing personal and/or other investment advice and/or an offer of and/or solicitation for any transactions in financial instruments and/or a guarantee and/or prediction of future performance. ForexTime (FXTM), its affiliates, agents, directors, officers or employees do not guarantee the accuracy, validity, timeliness or completeness, of any information or data made available and assume no liability as to any loss arising from any investment based on the same.


Forex-Time-LogoArticle by ForexTime

ForexTime Ltd (FXTM) is an award winning international online forex broker regulated by CySEC 185/12 www.forextime.com

Japanese Candlesticks Analysis 09.03.2021 (EURUSD, USDJPY, EURGBP)

Article By RoboForex.com

EURUSD, “Euro vs. US Dollar”

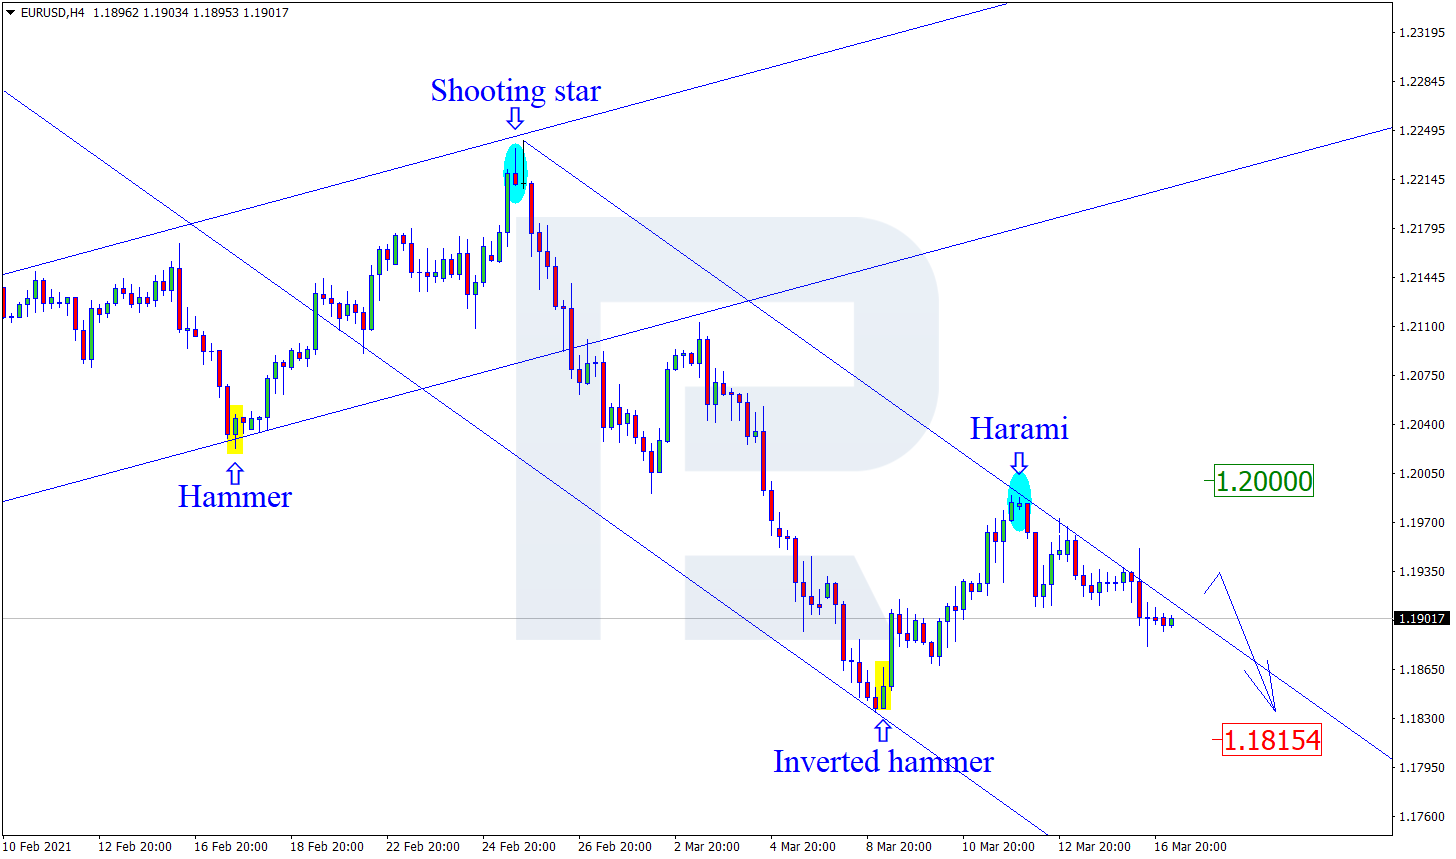
As we can see in the H4 chart, the correction continues. While testing the support area, the asset has formed several reversal patterns, including Inverted Hammer. At the moment, EURUSD is reversing and may later resume growing towards the resistance area. In this case, the upside target may be at 1.1930. However, an alternative scenario implies that the price may continue falling to reach 1.1775 without any corrections.

EURUSD
Risk Warning: the result of previous trading operations do not guarantee the same results in the future

USDJPY, “US Dollar vs. Japanese Yen”

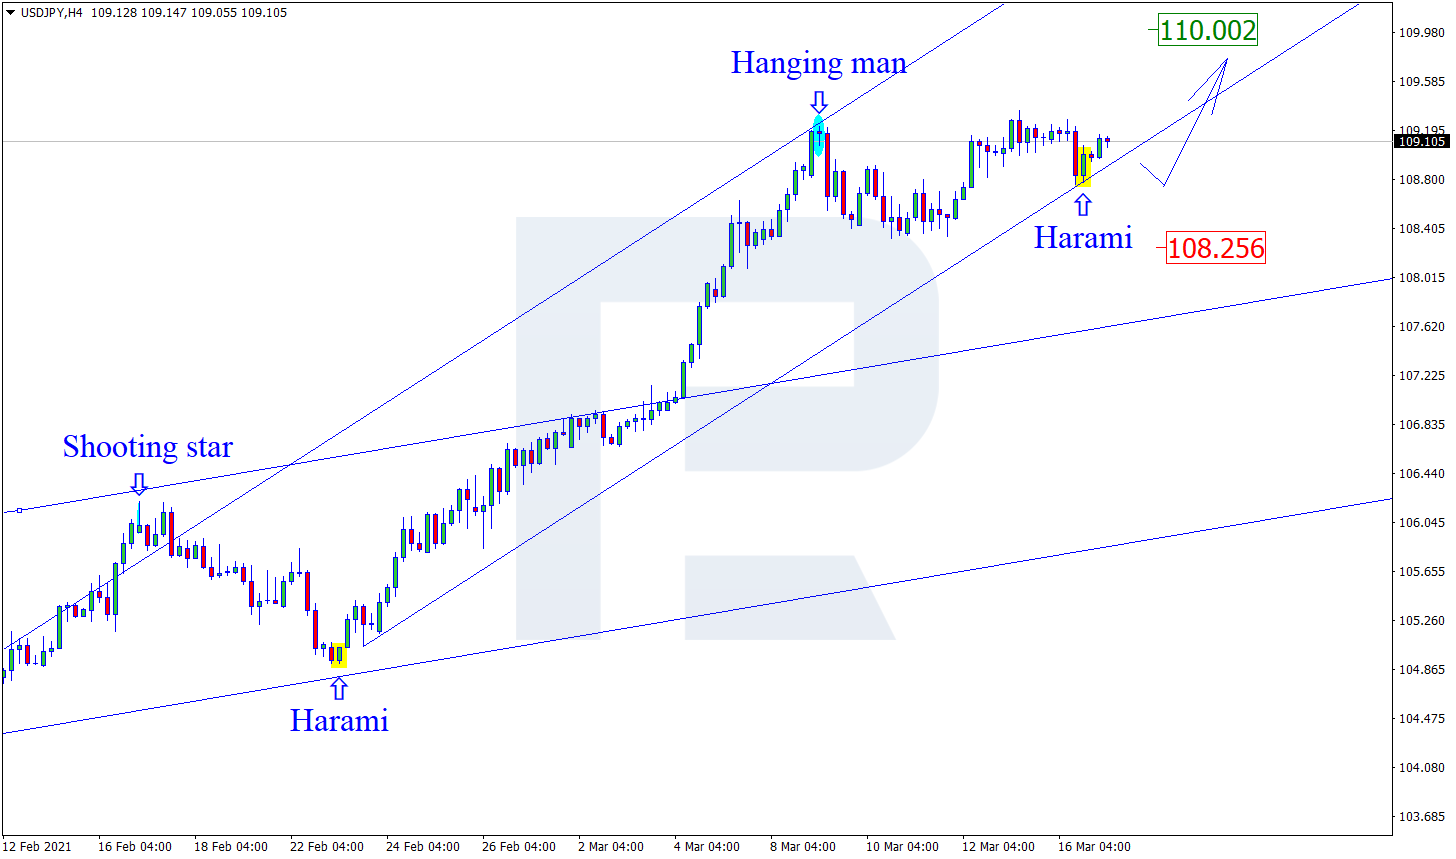
As we can see in the H4 chart, USDJPY has formed several reversal patterns, such as Hanging Man, while testing the resistance level. Judging by the previous movements, one may assume that the asset may reverse and start a new pullback. In this case, the correctional target is the support area at 108.50. After that, the instrument may rebound from this level and resume trading upwards. At the same time, an opposite scenario implies that the price may grow to reach 109.95 without reversing and correcting.

USDJPY
Risk Warning: the result of previous trading operations do not guarantee the same results in the future

EURGBP, “Euro vs. Great Britain Pound”

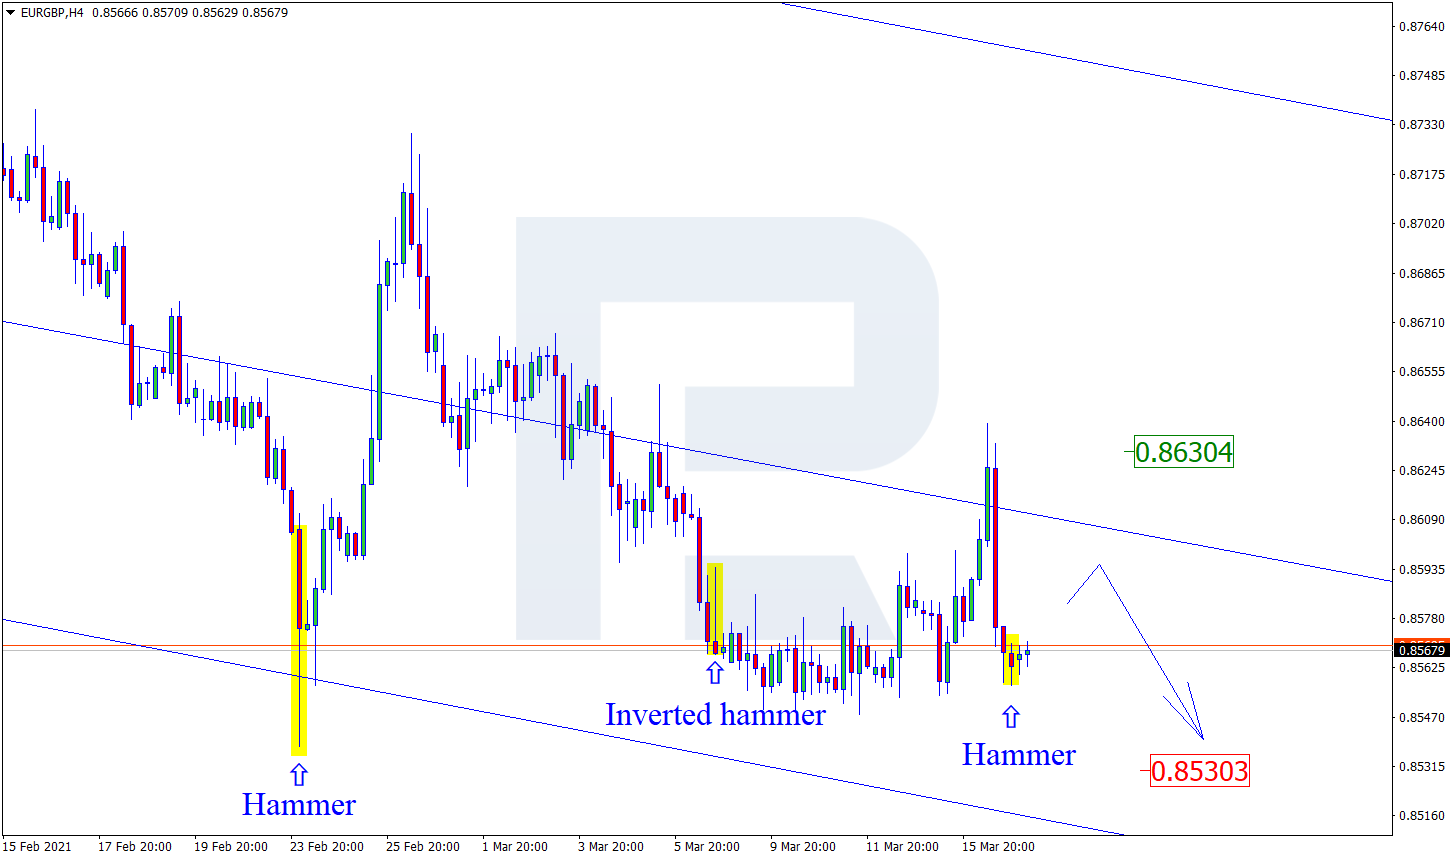
As we can see in the H4 chart, the asset continues trading close to the support level. After forming several reversal patterns there, such as Inverted Hammer, EURGBP may reverse and form a slight pullback. In this case, the upside target may be the resistance area at 0.8620. Still, there might be an alternative scenario, according to which the asset may continue falling to reach the downside target at the next support level at 0.8525 without reversing and correcting.

EURGBP

Article By RoboForex.com

Attention!
Forecasts presented in this section only reflect the author’s private opinion and should not be considered as guidance for trading. RoboForex LP bears no responsibility for trading results based on trading recommendations described in these analytical reviews.

Forex Technical Analysis & Forecast 09.03.2021

Article By RoboForex.com

EURUSD, “Euro vs US Dollar”

EURUSD is forming a new consolidation range above 1.1840. If later the price breaks this range to the upside, the market may resume trading upwards with the first target at 1.1983.

EURUSD
Risk Warning: the result of previous trading operations do not guarantee the same results in the future

GBPUSD, “Great Britain Pound vs US Dollar”

GBPUSD is consolidating around 1.3830. If later the price breaks this range to the upside, the market may grow to break 1.3895 and then continue trading upwards with the target at 1.4000.

GBPUSD
Risk Warning: the result of previous trading operations do not guarantee the same results in the future

USDRUB, “US Dollar vs Russian Ruble”

USDRUB is forming a wide consolidation range around 74.00. If later the price breaks this range to the downside at 73.50, the market may form a new descending structure with the target at 72.50; if to the upside at 74.74 – resume growing to reach 75.50.

USDRUB
Risk Warning: the result of previous trading operations do not guarantee the same results in the future

USDJPY, “US Dollar vs Japanese Yen”

After extending the ascending wave up to 109.20, USDJPY is expected to fall towards 108.10, thus forming a new consolidation range between these two levels. After that, the instrument may break the range to the downside and continue trading downwards with the first target at 106.90.

USDJPY
Risk Warning: the result of previous trading operations do not guarantee the same results in the future

USDCHF, “US Dollar vs Swiss Franc”

USDCHF has completed the ascending structure towards 0.9370 and may later fall to reach 0.9250, thus forming a new consolidation rang between these two levels. After that, the instrument may break the range to the downside and resume trading downwards with the first target at 0.9131.

USDCHF
Risk Warning: the result of previous trading operations do not guarantee the same results in the future

AUDUSD, “Australian Dollar vs US Dollar”

AUDUSD is still consolidating below 0.7719. Possibly, the pair may expand the range down to 0.7600. Later, the market may break the range to the downside and form one more descending structure with the target at 0.7425.

AUDUSD
Risk Warning: the result of previous trading operations do not guarantee the same results in the future

BRENT

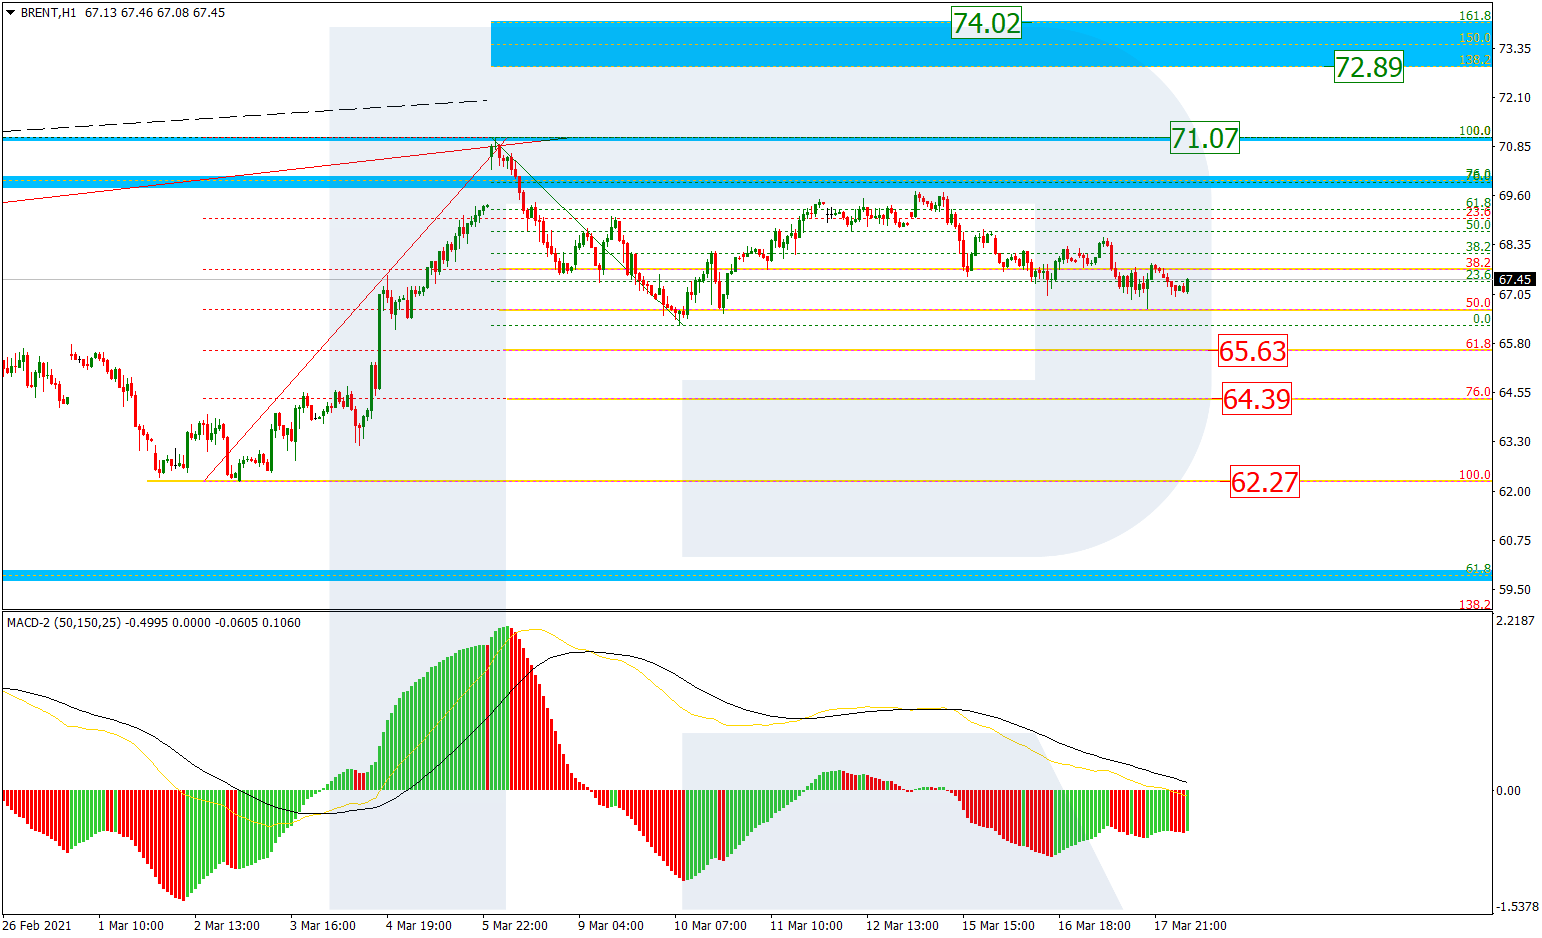
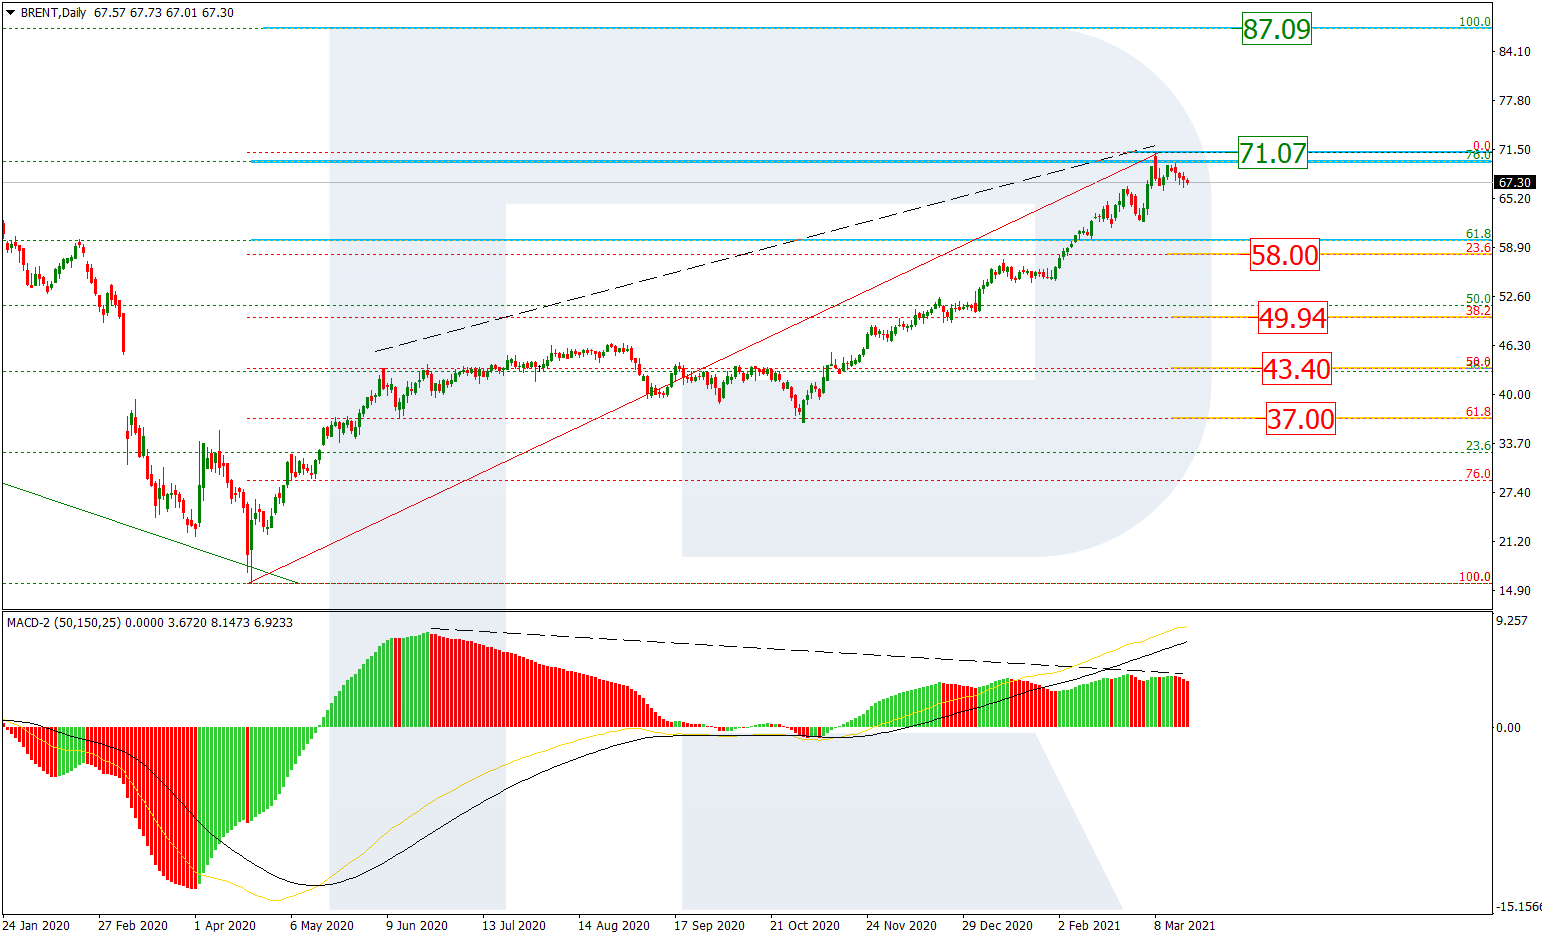
Brent has finished the correction at 67.67. Possibly, today the asset may later grow to break 70.10 and then continue trading upwards to reach 73.10. However, if the price falls and breaks 67.50, the market may resume falling with the target at 62.50.

BRENT
Risk Warning: the result of previous trading operations do not guarantee the same results in the future

XAUUSD, “Gold vs US Dollar”

Gold is still falling. Today, the metal may reach 1673.00 and then start a new growth towards 1707.00, thus forming a reversal pattern not far from these two levels. Later, the market may start a new growth with the target at 1744.55.

GOLD
Risk Warning: the result of previous trading operations do not guarantee the same results in the future

S&P 500

After completing the ascending wave at 3879.0, the S&P index is expected to correct towards 3792.2, thus forming a new consolidation range between these two levels. If later the price breaks this range to the upside, the market may resume trading upwards with the target at 3973.0; if to the downside – start a decline to reach 3660.0.

S&P 500

Article By RoboForex.com

Attention!
Forecasts presented in this section only reflect the author’s private opinion and should not be considered as guidance for trading. RoboForex LP bears no responsibility for trading results based on trading recommendations described in these analytical reviews.

The Analytical Overview of the Main Currency Pairs on 2021.03.09

by JustForex

The EUR/USD currency pair

Technical indicators of the currency pair:
  • Prev Open: 1.1917
  • Prev Close: 1.1846
  • % chg. over the last day: -0.60%

The European currency has dropped below 1.1952 for the first time since February 5, as the dollar is rapidly growing after the past week’s events. The fundamental background is putting significant pressure on the pair. The German-US 10-year bond yield spread fell to -184.8%, 200 basis points higher than in February.

Trading recommendations
  • Support levels: 1.1799, 1.1746
  • Resistance levels: 1.1952, 1.2113

The main scenario for trading EUR/USD is selling. The ADX shows strong bearish pressure on higher timeframes H4 and D1. There is a slight decrease in pressure on H1, which may signal a slight pullback. This is also indicated by the MACD, showing a divergence. But the main direction will remain south as long as the price is below 1.1952.

Alternative scenario: if the price manages to gain a foothold above the level of 1.1952, the pair may return to growth up to 1.2113.

EUR/USD
News feed for 2021.03.09:
  • – The Eurozone GDP (q/q) (4q) at 12:00 (GMT+2).

The GBP/USD currency pair

Technical indicators of the currency pair:
  • Prev Open: 1.3814
  • Prev Close: 1.3817
  • % chg. over the last day: -0.02%

The sterling is showing a less rapid decline against the dollar than the euro. The expectations regarding the monetary policy of the Bank of England are approximately equal to those of the Fed. Investors are betting on the completion of the easing policy, while the option contracts for tightening are growing. This provides some support for the British currency.

Trading recommendations
  • Support levels: 1.3775, 1.3680
  • Resistance levels: 1.3869, 1.3997

The main scenario for GBP/USD is trading sideways between 1.3869 and 1.3775. The ADX declined after Monday’s sideways movement. The MACD dropped to zero. At the same time, the price is close to the moving averages. This indicates that the decline has stopped, but the medium-term direction remains south.

Alternative scenario: if the pair consolidates above 1.3869, the pair may resume its growth. A breakdown of 1.3775 could trigger a further decline.

GBP/USD
There is no news feed for today.

The USD/JPY currency pair

Technical indicators of the currency pair:
  • Prev Open: 108.34
  • Prev Close: 108.88
  • % chg. over the last day: +0.50%

Fundamental factors point to further growth of the pair in the medium term, but in the short term, there are factors that can provoke a temporary pullback. The yield on 10-year US bonds fell below 1.60%, while the stock market is below February values.

Trading recommendations
  • Support levels: 107.08, 106.12
  • Resistance levels: 109.34, 109.86

The main scenario is cautious buying. In the short term, the pair may pull back, as the ADX began to decline after hitting the short-term overbought area. The MACD shows divergence. These are initial signs of an impending southern pullback, but buying on a decline looks safe now.

An alternative scenario implies the price-fixing below 107.95. In this case, the pair may return to the decline to 107.08.

USD/JPY
News feed for 2021.03.09:
  • – The GDP of Japan (q/q) (4q) at 01:50 (GMT+2).

The USD/CAD currency pair

Technical indicators of the currency pair:
  • Prev Open: 1.2652
  • Prev Close: 1.2662
  • % chg. over the last day: +0.08%

This currency pair continues to remain in a narrow sideways range. Despite the pullback in the oil market, the oil price remains above the February highs. This is supporting the Canadian currency. At the same time, the growth of the US dollar prevents the pair from falling. As a result, a weekly flat is observed.

Trading recommendations
  • Support levels: 1.2592, 1.2467
  • Resistance levels: 1.2745, 1.2763

The main scenario is trading in the sideways range between 1.2673 and 1.2592. The ADX stopped reacting to any price change. The MACD is near zero, and the price is between the moving averages. This indicates the continuation of trading in a narrow sideways range.

Alternative scenario: if the price manages to gain a foothold above 1.2673, the pair may resume growth to 1.2745. A breakdown of 1.2592 will strengthen the southern movement.

USD/CAD
There is no news feed for today.

by JustForex


This article reflects a personal opinion and should not be interpreted as an investment advice, and/or offer, and/or a persistent request for carrying out financial transactions, and/or a guarantee, and/or a forecast of future events.