Archive for Forex and Currency News – Page 300

Japanese Candlesticks Analysis 16.03.2021 (USDCAD, AUDUSD, USDCHF)

Article By RoboForex.com

USDCAD, “US Dollar vs Canadian Dollar”

As we can see in the H4 chart, the asset is still moving sideways. After forming a Hammer reversal pattern not far from the support level, USDCAD may reverse and correct towards the resistance area at 1.2555. After the correction, the price may resume falling to reach the next downside target at 1.2425. After that, the asset may continue forming the descending impulse.

USDCAD
Risk Warning: the result of previous trading operations do not guarantee the same results in the future

AUDUSD, “Australian Dollar vs US Dollar”

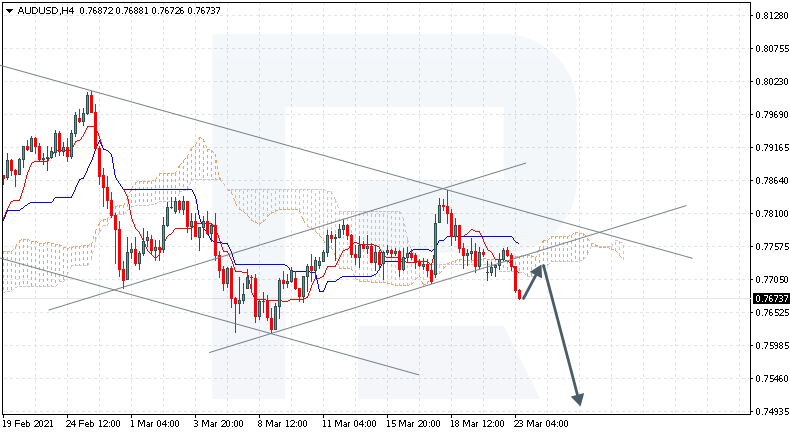
As we can see in the H4 chart, after forming several reversal patterns, such as Hammer, not far from the support area, the pair may reverse and resume growing to reach the resistance level at 0.7925. After testing it, the instrument may continue moving upwards. At the same time, an opposite scenario implies that the price may correct towards the next support level at 0.7645 before resuming its growth.

AUDUSD
Risk Warning: the result of previous trading operations do not guarantee the same results in the future

USDCHF, “US Dollar vs Swiss Franc”

As we can see in the H4 chart, the correction within the uptrend continues. At the moment, after forming a Harami reversal pattern not far from the resistance area, USDCHF is reversing and correcting. In this case, the correctional target is the support level at 0.9220. Still, there might be an alternative scenario, according to which the asset may continue growing to reach 0.9400 without testing the rising channel’s downside border.

USDCHF

Article By RoboForex.com

Attention!
Forecasts presented in this section only reflect the author’s private opinion and should not be considered as guidance for trading. RoboForex LP bears no responsibility for trading results based on trading recommendations described in these analytical reviews.

Fibonacci Retracements Analysis 16.03.2021 (EURUSD, USDJPY)

Article By RoboForex.com

EURUSD, “Euro vs US Dollar”

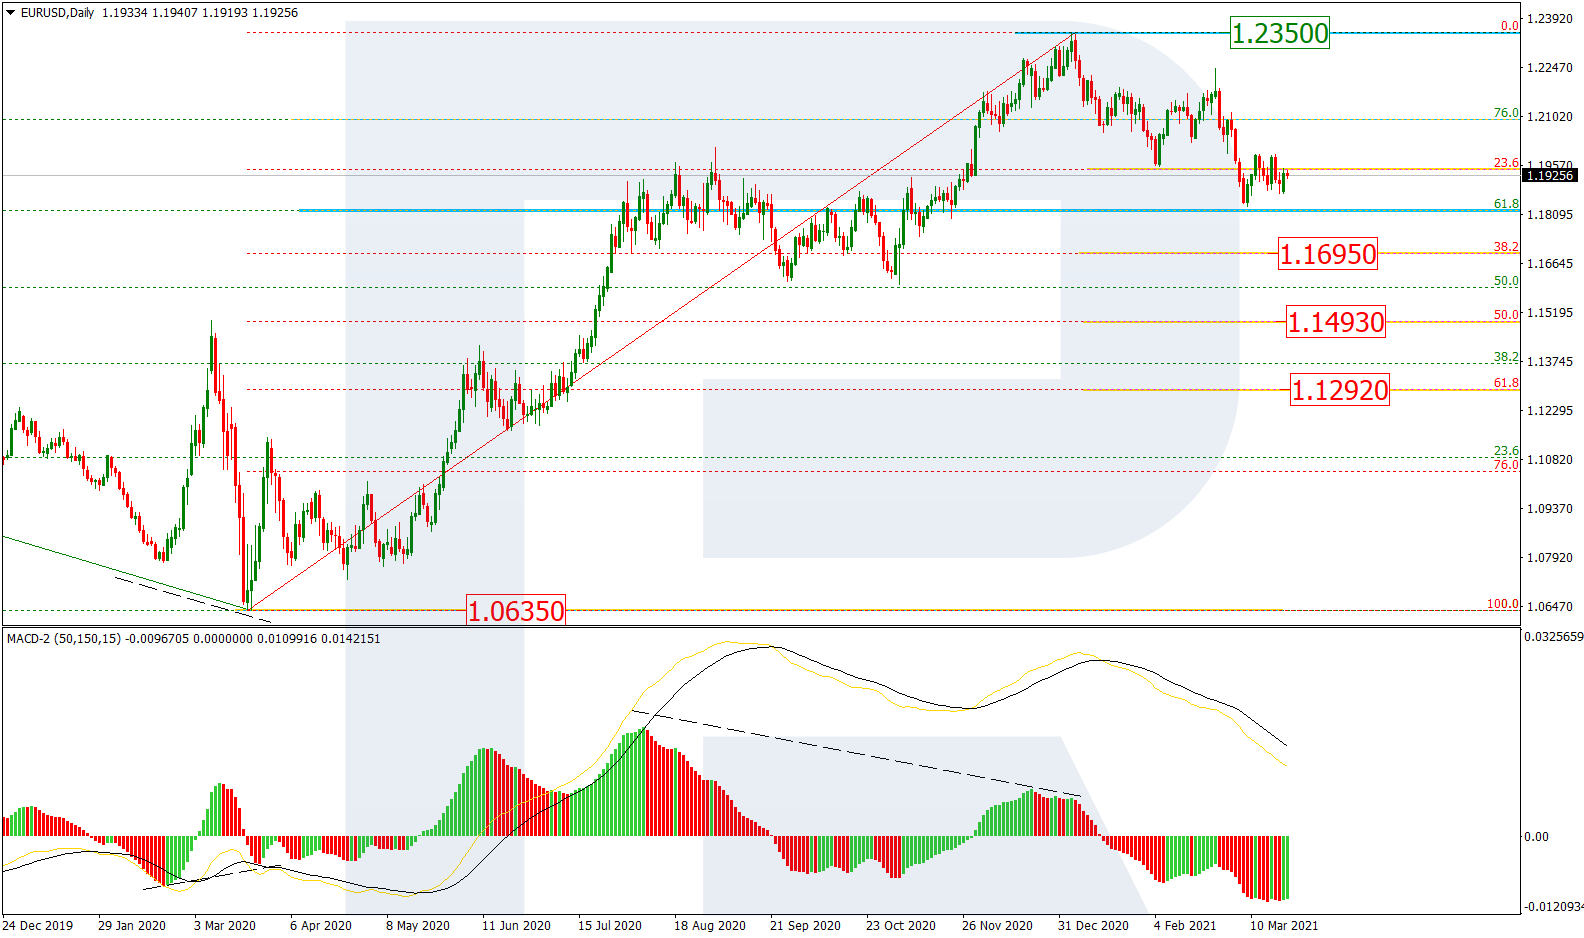
As we can see in the daily chart, the asset continues the “bearish” phase after a divergence on MACD. After falling and reaching 23.6% fibo, the pair has started a new pullback, which may be over quite soon. In this case, EURUSD may resume falling towards 38.2%, 50.0%, and 61.8% fibo at 1.1695, 1.1493, and 1.1292 respectively. The key resistance remains at the high at 1.2350.

EURUSD_D1
Risk Warning: the result of previous trading operations do not guarantee the same results in the future

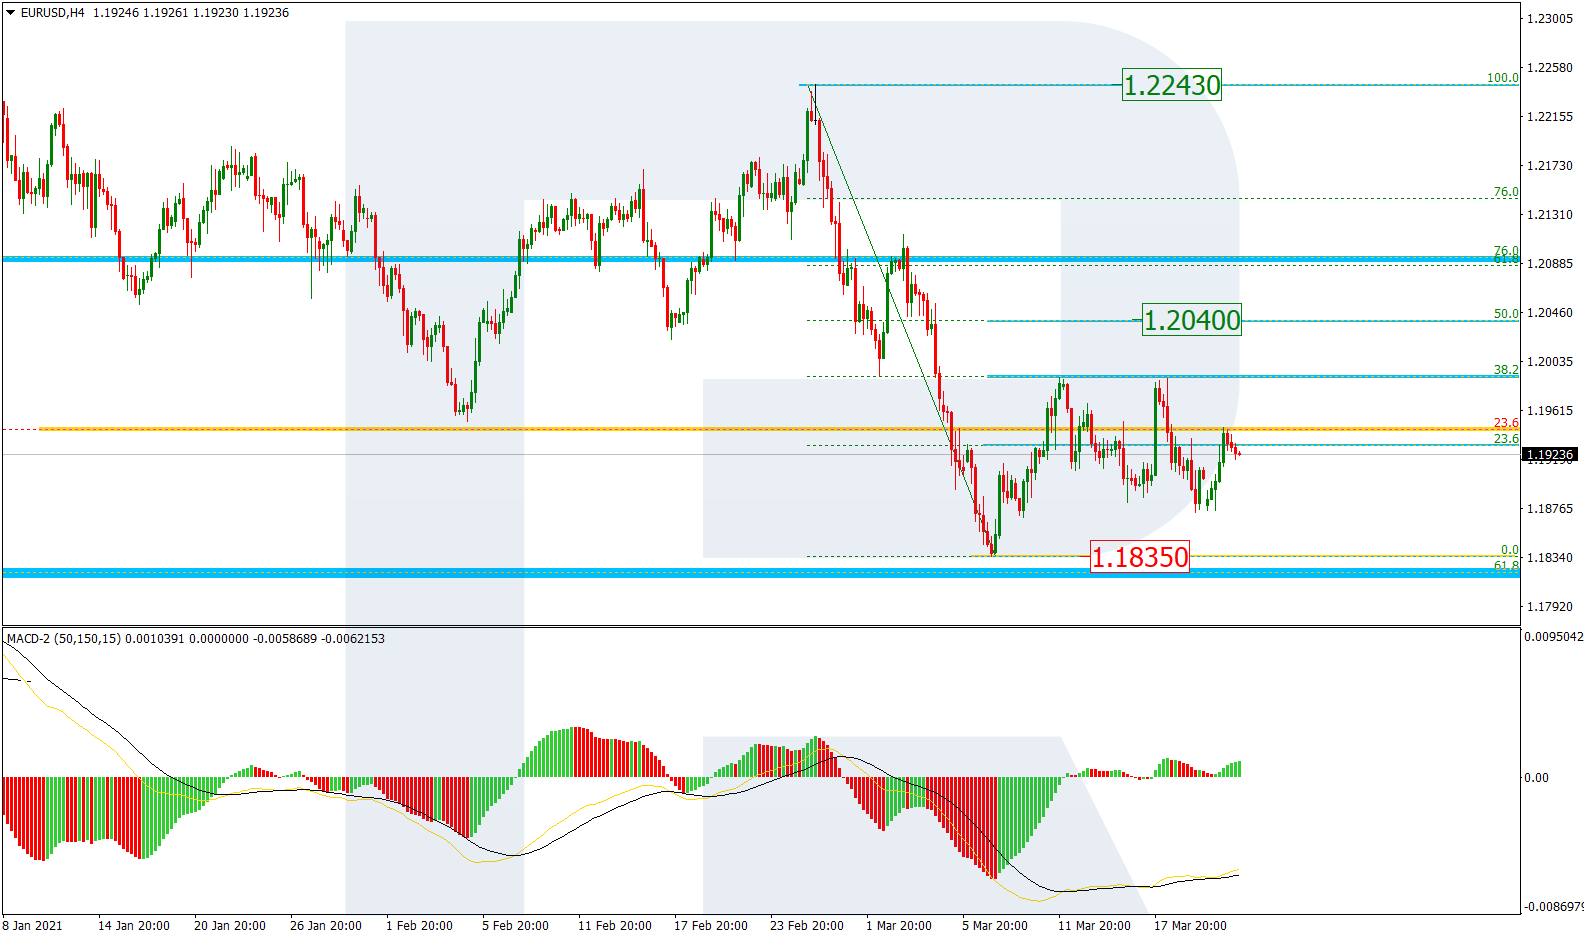
The H4 chart shows a more detailed structure of the current short-term correction after the previous descending impulse, which has already reached 38.2% fibo and may yet continue towards 50.0% fibo at 1.2040. After finishing the correction, the asset may resume falling to reach and break the low at 1.1835. The mid-term resistance is the fractal high at 1.2243.

EURUSD_H4
Risk Warning: the result of previous trading operations do not guarantee the same results in the future

USDJPY, “US Dollar vs. Japanese Yen”

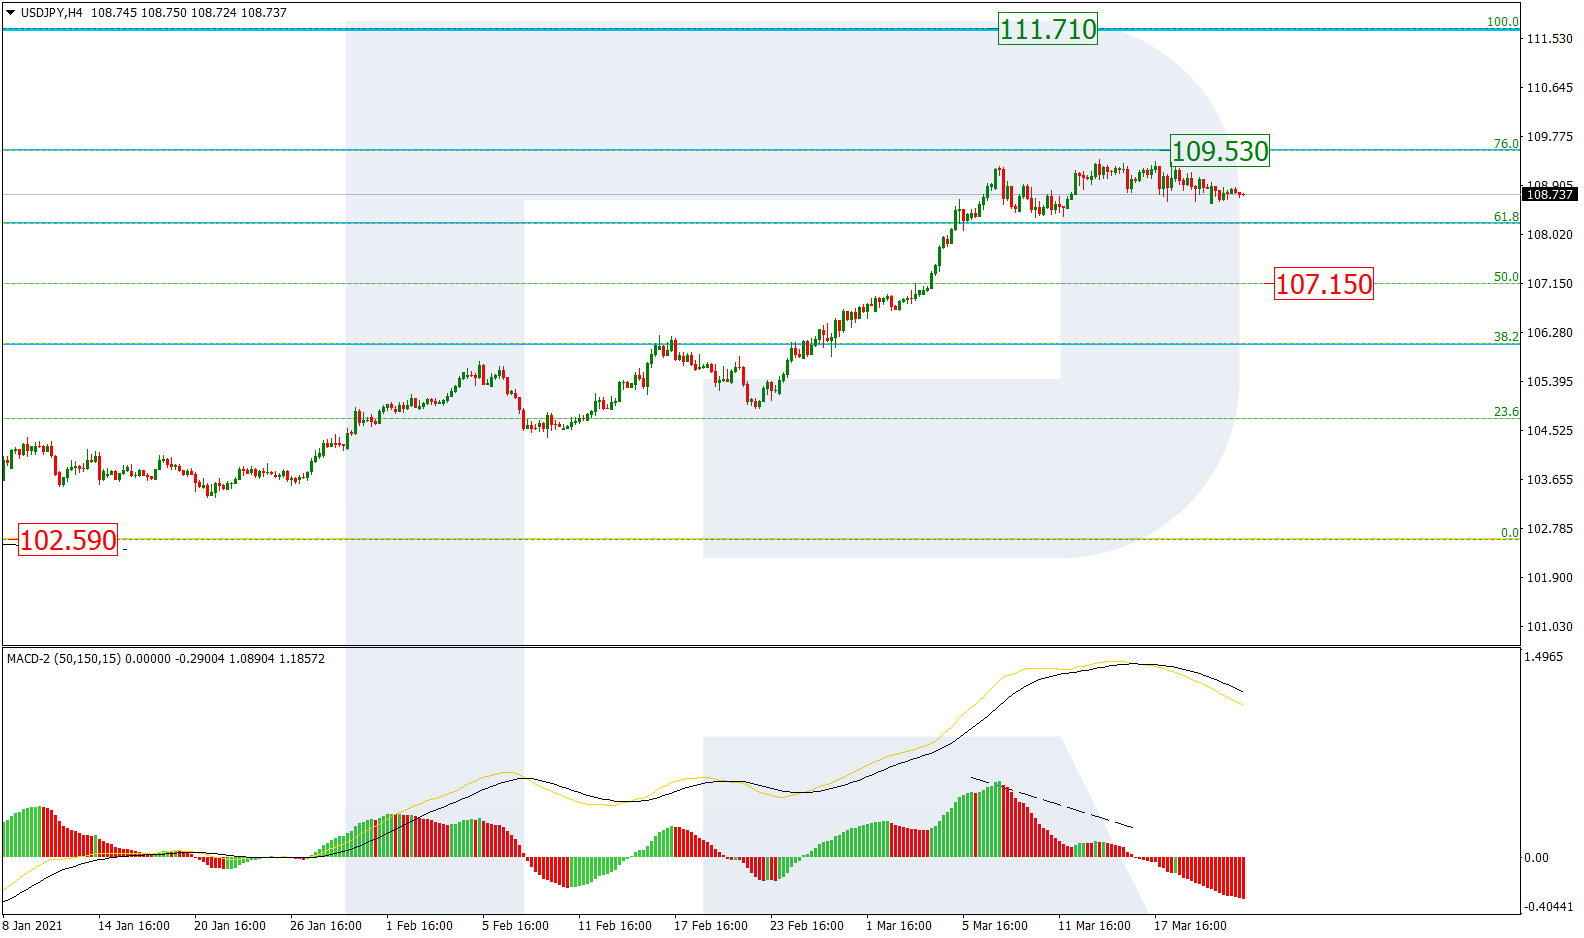
As we can see in the H4 chart, the stable uptrend continues. After breaking 61.8% fibo, USDJPY is heading towards 76.0% fibo at 109.53. After breaking the latter level, the pair may continue growing to reach the long-term fractal high at 111.71. However, there is a divergence on MACD, which says that the pair may correct downwards before attacking the high.

USDJPY_H4
Risk Warning: the result of previous trading operations do not guarantee the same results in the future

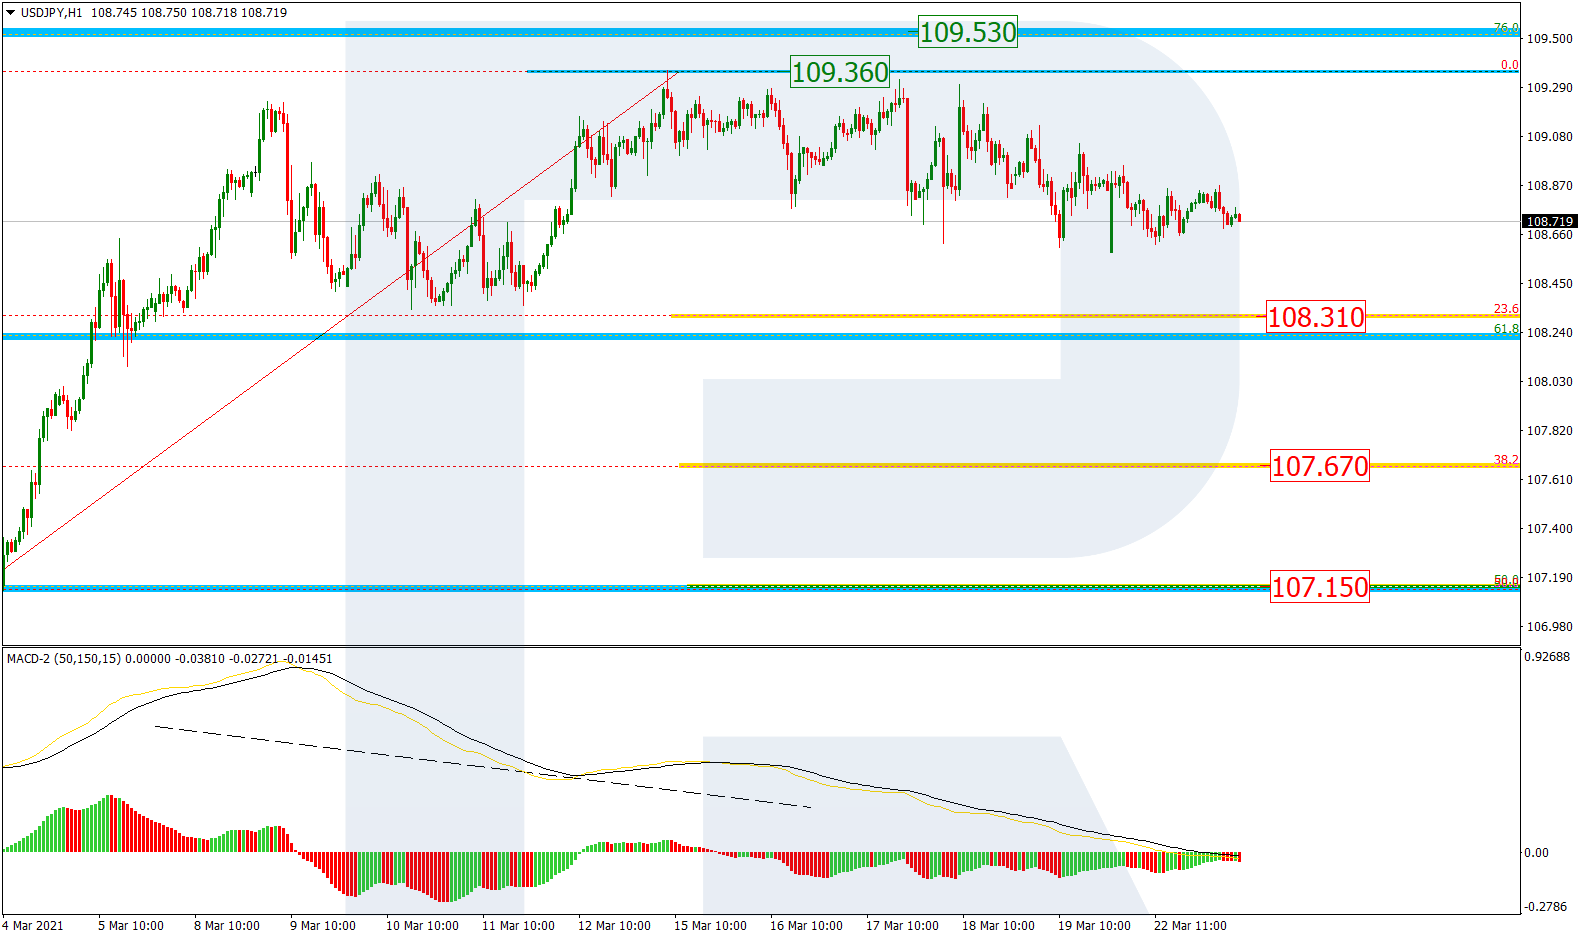
In the H1 chart, USDJPY is correcting to the downside and may reach 23.6, 38.2%, and 50.0% fibo at 108.31, 107.67, and 107.15 respectively. A breakout of the current high at 109.36 may complete the correction.

USDJPY_H1

Article By RoboForex.com

Attention!
Forecasts presented in this section only reflect the author’s private opinion and should not be considered as guidance for trading. RoboForex LP bears no responsibility for trading results based on trading recommendations described in these analytical reviews.

The Analytical Overview of the Main Currency Pairs on 2021.03.16

by JustForex

The EUR/USD currency pair

Technical indicators of the currency pair:
  • Prev Open: 1.1948
  • Prev Close: 1.1926
  • % chg. over the last day: -0.18%

The euro continues to decline gradually, but at the same time, it does not go beyond the boundaries of the sideways range. The decrease in volatility is explained both by the lack of important economic news and the expectation of the announcement of the two-day Fed meeting results, which will begin today.

Trading recommendations
  • Support levels: 1.1834, 1.1746
  • Resistance levels: 1.1967, 1.1990

The main scenario for trading EUR/USD is selling. Despite low volatility, the ADX continues to react to any southern movement. The MACD has failed to enter the positive area on the upward price pullback, which indicates a high probability of the pair returning to 1.1834.

Alternative scenario: if the price gains a foothold above the level of 1.1990, the pair may return to growth to 1.2113.

EUR/USD
News feed for 2021.03.16:
  • – The ZEW Indicator of Economic Sentiment for Germany (Mar) at 12:00 (GMT+2);
  • – The ZEW Indicator of Economic Sentiment for Eurozone (Mar) at 12:00 (GMT+2);
  • – The US Retail Sales (m/m) (Feb) at 14:30 (GMT+2).

The GBP/USD currency pair

Technical indicators of the currency pair:
  • Prev Open: 1.3916
  • Prev Close: 1.3898
  • % chg. over the last day: -0.13%

The sterling has shown a smaller intraday decline against the dollar, and the price is holding slightly above the first support level. Fundamentally, this is a positive signal as traders are awaiting hints from the Bank of England to start scaling back the stimulus program.

Trading recommendations
  • Support levels: 1.3857, 1.3775
  • Resistance levels: 1.3997, 1.4224

The main scenario for GBP/USD is selling. Any decline in the pair, even a minimal one, triggers a strong ADX reaction, which indicates an increased likelihood of a breakdown of the support level. The MACD has consolidated below zero, and the price is below the moving averages. It indicates a high probability of the continuation of the bearish scenario for the sterling.

Alternative scenario: if the pair consolidates above 1.3997, it may resume growth to the year’s highs.

GBP/USD
There is no news feed for today.

The USD/JPY currency pair

Technical indicators of the currency pair:
  • Prev Open: 109.00
  • Prev Close: 109.13
  • % chg. over the last day: +0.12%

The rise in risky assets and bond yields continues to support the bulls in the dollar-yen. The upward bias of the dollar index is an additional bullish driver. Medium-term expectations for growth are strengthening from a fundamental point of view.

Trading recommendations
  • Support levels: 108.35, 107.08
  • Resistance levels: 109.34, 109.86

The main scenario is buying. Although the ADX has declined to its minimum values on the hourly timeframe, it shows significant bullish pressure on the H4 and D1. It indicates the likelihood of an early resumption of the pair’s growth.

An alternative scenario implies the price-fixing below 108.35. In this case, the pair may return to the decline to 107.08.

USD/JPY
News feed for 2021.03.16:
  • – The US Retail Sales (m/m) (Feb) at 14:30 (GMT+2).

The USD/CAD currency pair

Technical indicators of the currency pair:
  • Prev Open: 1.2474
  • Prev Close: 1.2476
  • % chg. over the last day: +0.02%

A slight correction in the oil market helped the price close above the support level. A Doji candlestick has formed on the daily chart, which may indicate a new wave of the northern correction. An additional signal for a corrective pullback is a false breakout of 1.2467.

Trading recommendations
  • Support levels: 1.2519, 1.2467
  • Resistance levels: 1.2592, 1.2745

The main scenario is buying. The ADX indicates the predominance of bullish potential in the pair in the short term. The MACD has returned to zero, and the price has broken the SMA 50 moving average. It indicates the likelihood of further growth towards SMA 100 in the 1.2550 area.

Alternative scenario: if the price manages to consolidate below 1.2467, the pair may resume its decline to 1.2400.

USD/CAD
News feed for 2021.03.16:
  • – The US Retail Sales (m/m) (Feb) at 14:30 (GMT+2).

by JustForex


This article reflects a personal opinion and should not be interpreted as an investment advice, and/or offer, and/or a persistent request for carrying out financial transactions, and/or a guarantee, and/or a forecast of future events.

The suspension of vaccination with the drug from AstraZeneca in Europe and the expectation of the results of the Fed meeting

by JustForex

Intraday volatility decreased in the foreign exchange market, and the stock market slowed down. Investors are looking forward to Wednesday evening when the Fed’s economic forecasts will be updated and the results of the two-day meeting will be announced. The market is still looking to the future with caution, suggesting an imminent reduction in stimulus measures.

European currencies, especially the sterling, have come under pressure after the reports on the suspension of vaccination with the drug from AstraZeneca. The slow progress of vaccination in Europe may be further slowed after Germany, France, and Italy coordinated to suspend the use of the vaccine. Now, the pace of vaccinations in the European Union depends in part on the results of the European Medicines Agency (EMA), which plans to make a decision regarding further steps on Thursday. AstraZeneca Plc, in its turn, is insistent on the safety of the vaccine.

It’s not the right time for problems with AstraZeneca, as some European countries are at risk of returning to isolation again. Italy has already introduced tougher measures. There is a rise in the number of infections in some regions of Germany, prompting medical experts to call for tighter restrictions, that is threatening a rapid economic recovery in the second quarter.

In addition, the safety issues of the British vaccine have contributed an additional dose of negativity to the European troubled relationship with the UK government. The trade dispute remains unresolved, which negatively affects the sterling.

The market is trying to ignore the vaccination problems in Europe, considering them as short-term ones. Investors remain focused on a quick economic recovery. However, the growth of the major stock indices has stalled. The S&P 500 struggled to break the annual high of 3.950 and is slowly declining since the opening.

Main market quotes:

S&P 500 (F) 3,958.38 +0.13 (+0.00%)

Dow Jones 32,953.46 +174.82 (+0.53%)

DAX 14,541.95 +80.53 (+0.56%)

FTSE 100 6,782.25 +32.55 (+0.48%)

USD Index 91.922 +0.090 (+0.10%)

Important events:
  • – Germany ZEW Economic Sentiment Index (Mar) at 12:00 (GMT+2);
  • – Eurozone ZEW Economic Sentiment Index (Mar) at 12:00 (GMT+2);
  • – US Retail Sales (m/m) (Feb) at 14:30 (GMT+2).

by JustForex


This article reflects a personal opinion and should not be interpreted as an investment advice, and/or offer, and/or a persistent request for carrying out financial transactions, and/or a guarantee, and/or a forecast of future events.

Technical Outlook: GBPUSD knocking on the 1.38 door

By Lukman Otunuga Research Analyst, ForexTime

It has been a while since we have taken a deep dive into the world of the British Pound.

The currency remains in a position of power due to the massive reduction in Brexit-related uncertainty, improving economic outlook, and vaccine rollouts. Sterling is up against almost every single G10 currency since December 24th, 2020 – when the EU and UK reached a post-Brexit deal.


However, things have been shaky for Sterling since the final week of February.


An appreciating Dollar certainly played a role in the Pound’s decline as surging Treasury yields sent investors sprinting towards the world’s reserve currency.


But the fundamentals remain in favour of the Pound. It not only remains heavily supported by growing hopes of recovery but falling Covid-19 cases and optimism over Rishi Sunak’s budget plan. However, the technicals are singing a different tune.

GBPUSD eyes 1.3800 

Yesterday, we discussed the possibility of the GBPUSD descending towards the 1.3800 support level with a breakout on the horizon. Prices are trading below the daily 20 Simple Moving Average while the MACD is in the process of crossing to the downside. A solid daily close below 1.3800 may open the doors towards 1.3750 and 1.3620. 


Same story on the weekly

There have been consistently higher highs and higher lows on the weekly timeframe. A technical pullback towards 1.3610 could be on the cards once prices break below 1.3800. 


What about the Bank of England meeting?

The Bank of England (BoE) is widely expected to leave monetary policy unchanged on Thursday. 


While the European Central Bank (ECB) is concerned over the surge in bond yields, the BoE views it as a sign of optimism that the economy is about to rebound! With interest rates at a record low of 0.1%, much of the focus will be directed towards the BOE’s asset purchase program, which is buying £150 billion of bonds this year. It will be interesting to see if any adjustments are made given the BoE’s views on the surge in bond yields. 

Should the central bank express further optimism over the UK economy, this could offer Sterling a boost. 

Back to the technicals

Things are still looking bullish on the monthly timeframe but February’s candlestick looks, suspect. The sharp rejection from the 1.4240 level could be an early signal that the bears are back in the game. It’s all about the 1.3800 support level and whether a monthly close below this key point is achieved. While there have been consistently higher highs and higher lows, a move back below 1.3560 may threaten the uptrend as this is below the most recent higher low.


Disclaimer: The content in this article comprises personal opinions and should not be construed as containing personal and/or other investment advice and/or an offer of and/or solicitation for any transactions in financial instruments and/or a guarantee and/or prediction of future performance. ForexTime (FXTM), its affiliates, agents, directors, officers or employees do not guarantee the accuracy, validity, timeliness or completeness, of any information or data made available and assume no liability as to any loss arising from any investment based on the same.


Forex-Time-LogoArticle by ForexTime

ForexTime Ltd (FXTM) is an award winning international online forex broker regulated by CySEC 185/12 www.forextime.com

Technical Outlook: Breakouts & Fakeouts

By Lukman Otunuga Research Analyst, ForexTime

There was an uneasy calm in the FX markets today.

Most G10 currencies struggled for direction as investors braced for another eventful week.

As the tumbleweed rolled across the trading session, we decided to identify potential breakout opportunities in the week ahead. 

What is a breakout?

When the price of an asset moves above a resistance level or below a support level. Breakouts are important because they signal the start of a potential trend in the direction of the breach.

What is a fakeout?

A false break above a resistance level or below a support level. Fakeouts can be painful. Nobody likes being on the wrong side of a trade. Prices tend to reverse sharply after the false break higher or lower.

Now the basics have been covered, let’s get cracking!

Dollar eyes 92.10 

It’s the same old story for the Dollar

Bulls are drawing support from the recent rise in U.S. Treasury yields while caution ahead of key central bank meetings is boosting appetite for the safe-haven currency.

The technical outlook remains bullish on the daily charts with bulls eyeing 92.10. A solid breakout above this intraday resistance may open the doors towards 92.50 and 93.00. Should the 91.35 level prove to be unreliable support, the Dollar Index may descend back towards 90.75.


EURUSD trapped below 1.1990?

The chart says it all. Euro bears are in the building and seem to have an appetite for 1.1900 and lower.

There have been consistently lower lows and lower highs while prices remain in a bearish channel. Sustained weakness below 1.1960 could open the doors towards 1.1900 and 1.1835, respectively. A breakout back above 1.1990 could swing open the doors towards 1.2080 and 1.2100.


GBPUSD breakout on the horizon?

Here is a great example of a clean breakout setup on the GBPUSD.

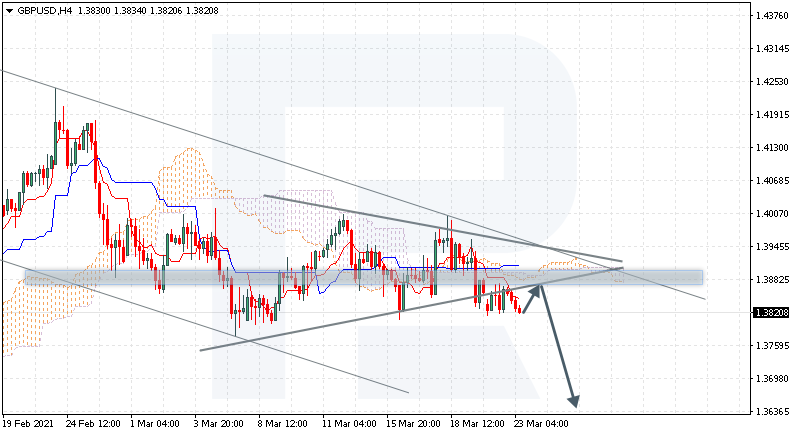
Resistance can be found at 1.4000 and support is seen at 1.3800. A solid breakout below 1.3800 could open the doors towards 1.3750 and 1.3620. Should 1.3800 prove to be reliable support, this may trigger a rebound back towards the 1.4000 level. 

Over the past few months, it has felt like the GBPUSD was waiting for a catalyst. This may come in the form of the Bank of England policy meeting on Thursday.


USDJPY wobbles above 109.00

I smell a fakeout on the USDJPY. Prices are struggling to keep above the 109.00 resistance level despite the firmly bullish trend. Are bulls taking a breather before pushing prices higher or is this just a classic case of running on empty and running on fumes?

A move back below 109.00 could signal a decline towards the 108.30 higher low.


Commodity spotlight – Gold 

It’s all about the $1730 level when looking at Gold prices. 

This is a pivotal level that may determine whether bulls or bears win the tug of war this week!

A solid breakout above $1730 may inspire bulls to march towards $1772. Alternatively, sustained weakness below $1730 is likely to trigger a decline towards $1700 and $1675, respectively. Where the metal concludes this week may be influenced by the Federal Reserve meeting and bond markets.

Disclaimer: The content in this article comprises personal opinions and should not be construed as containing personal and/or other investment advice and/or an offer of and/or solicitation for any transactions in financial instruments and/or a guarantee and/or prediction of future performance. ForexTime (FXTM), its affiliates, agents, directors, officers or employees do not guarantee the accuracy, validity, timeliness or completeness, of any information or data made available and assume no liability as to any loss arising from any investment based on the same.

Forex-Time-LogoArticle by ForexTime

ForexTime Ltd (FXTM) is an award winning international online forex broker regulated by CySEC 185/12 www.forextime.com

Ichimoku Cloud Analysis 15.03.2021 (EURUSD, XAUUSD, USDCAD)

Article By RoboForex.com

EURUSD, “Euro vs US Dollar”

EURUSD is trading at 1.1928; the instrument is moving inside Ichimoku Cloud, thus indicating a sideways tendency. The markets could indicate that the price may test the cloud’s upside border at 1.1945 and then resume moving downwards to reach 1.1825. Another signal in favor of a further downtrend will be a rebound from the rising channel’s downside border. However, the bearish scenario may be canceled if the price breaks the cloud’s upside border and fixes above 1.1975. In this case, the pair may continue growing towards 1.2065. To confirm further decline, the asset must break the support area and fix below 1.1905 – as we can see, the pair rebounded from this level several times in the past.

EURUSD
Risk Warning: the result of previous trading operations do not guarantee the same results in the future

XAUUSD, “Gold vs US Dollar”

XAUUSD is trading at 1722.00; the instrument is moving inside Ichimoku Cloud, thus indicating a sideways tendency. The markets could indicate that the price may test the resistance area at 1725.00 and then resume moving downwards to reach 1655.00. Another signal in favor of a further downtrend will be a rebound from the descending channel’s upside border. However, the bearish scenario may no longer be valid if the price breaks the cloud’s upside border and fixes above 1755.00. In this case, the pair may continue growing towards 1795.00. To confirm further decline, the asset must break the neckline of a Head & Shoulders reversal pattern and fix below 1690.00.

XAUUSD
Risk Warning: the result of previous trading operations do not guarantee the same results in the future

USDCAD, “US Dollar vs Canadian Dollar”

USDCAD is trading at 1.2558; the instrument is moving below Ichimoku Cloud, thus indicating a descending tendency. The markets could indicate that the price may test Tenkan-Sen and Kijun-Sen at 1.2505 and then resume moving downwards to reach 1.2395. Another signal in favor of a further downtrend will be a rebound from descending channel’s upside border. However, the bearish scenario may no longer be valid if the price breaks the cloud’s upside border and fixes above 1.2605. In this case, the pair may continue growing towards 1.2695.

USDCAD

Article By RoboForex.com

Attention!
Forecasts presented in this section only reflect the author’s private opinion and should not be considered as guidance for trading. RoboForex LP bears no responsibility for trading results based on trading recommendations described in these analytical reviews.

Forex Technical Analysis & Forecast 15.03.2021

Article By RoboForex.com

EURUSD, “Euro vs US Dollar”

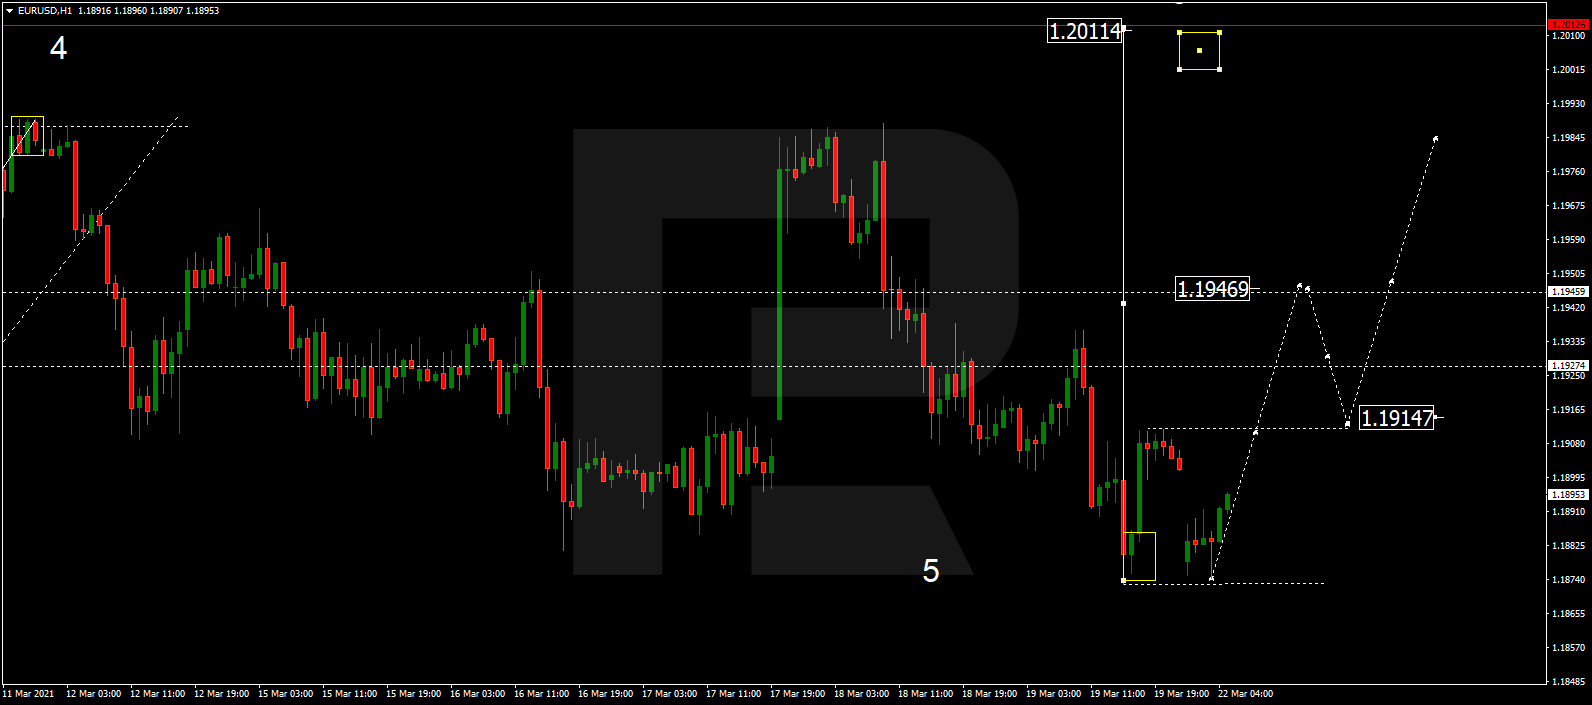
After finishing the correction at 1.1910, EURUSD has started another growth towards 1.2000; right now, it is forming a new consolidation range around 1.1960 as an upside continuation pattern. Possibly, the pair may reach 1.2000 and then start a new correction to return to 1.1960.

EURUSD
Risk Warning: the result of previous trading operations do not guarantee the same results in the future

GBPUSD, “Great Britain Pound vs US Dollar”

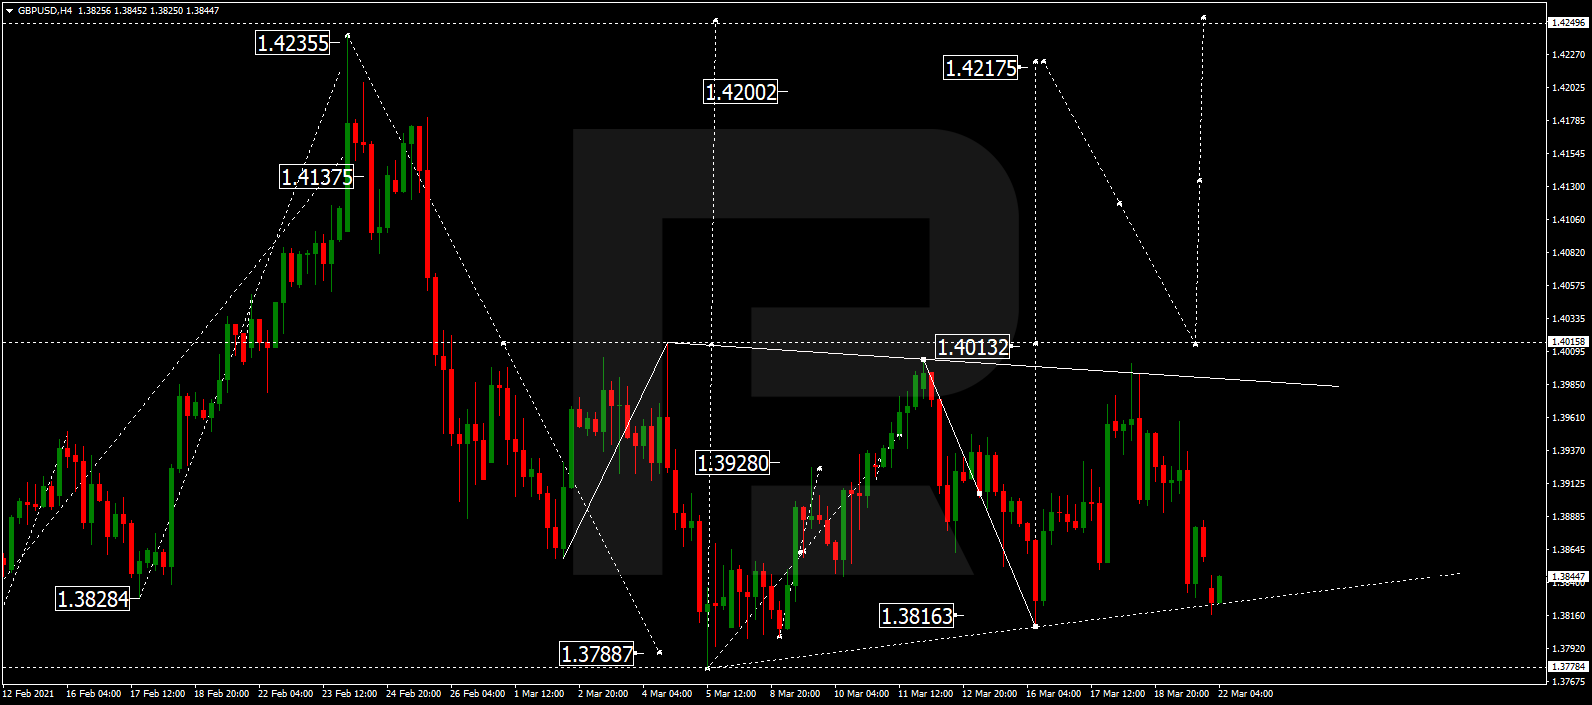
After completing the correction at 1.3864, GBPUSD has started another wave to the upside; right now, it is forming a new consolidation range around 1.3935. If later the price breaks this range to the upside, the market may resume trading upwards with the target at 1.4015.

GBPUSD
Risk Warning: the result of previous trading operations do not guarantee the same results in the future

USDRUB, “US Dollar vs Russian Ruble”

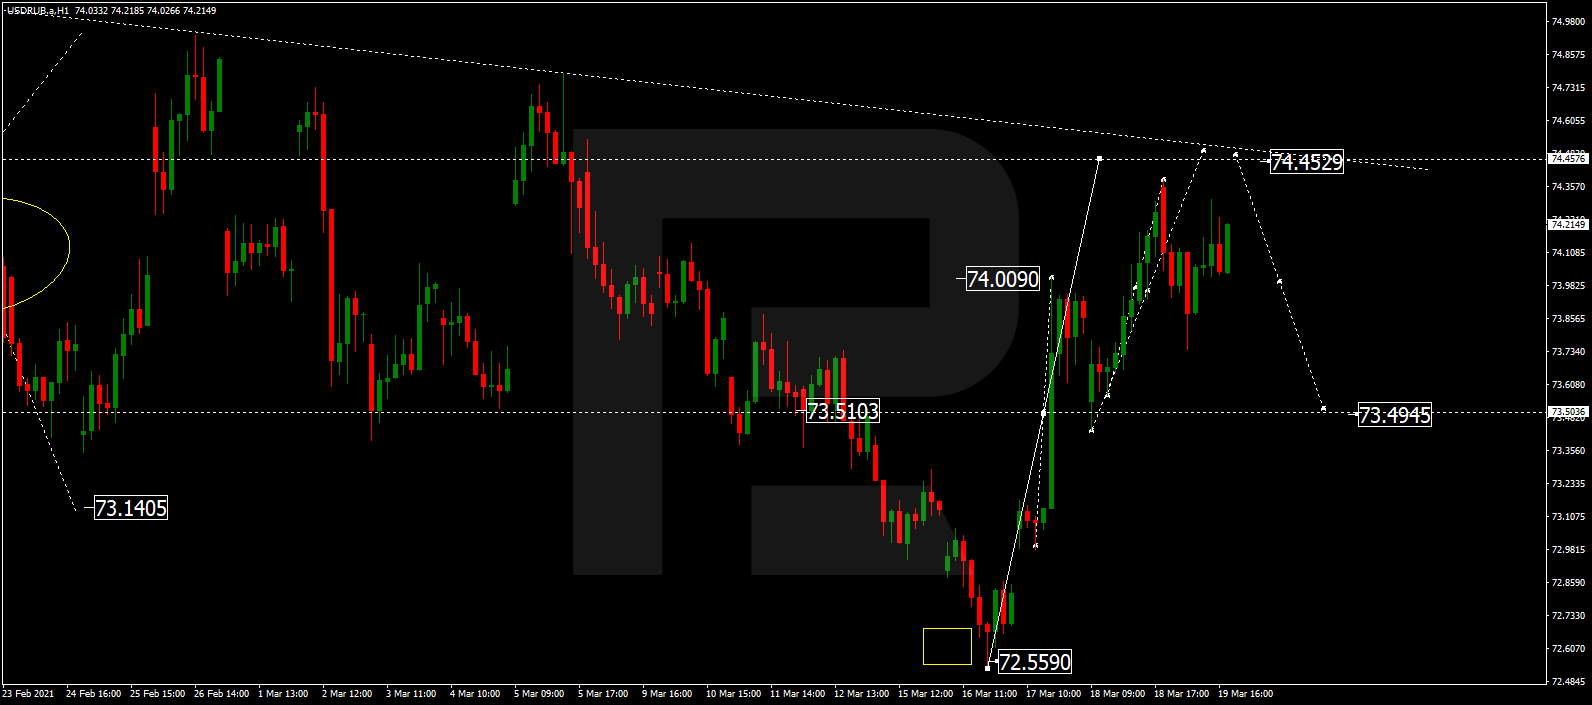
USDRUB is still consolidating around 73.50. Possibly, the pair may expand the range down to 73.15 and then start a new correction with the target at 73.66.

USDRUB
Risk Warning: the result of previous trading operations do not guarantee the same results in the future

USDJPY, “US Dollar vs Japanese Yen”

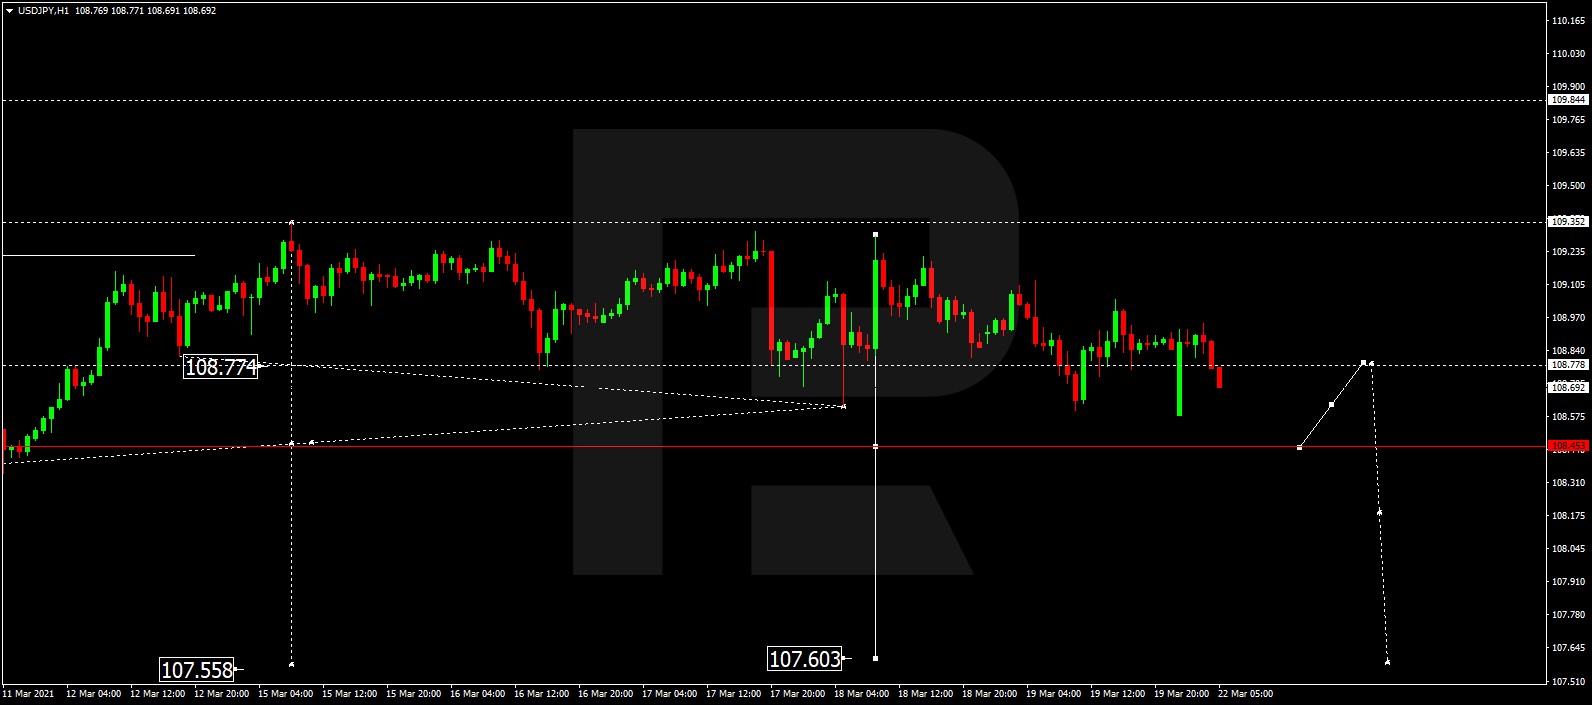
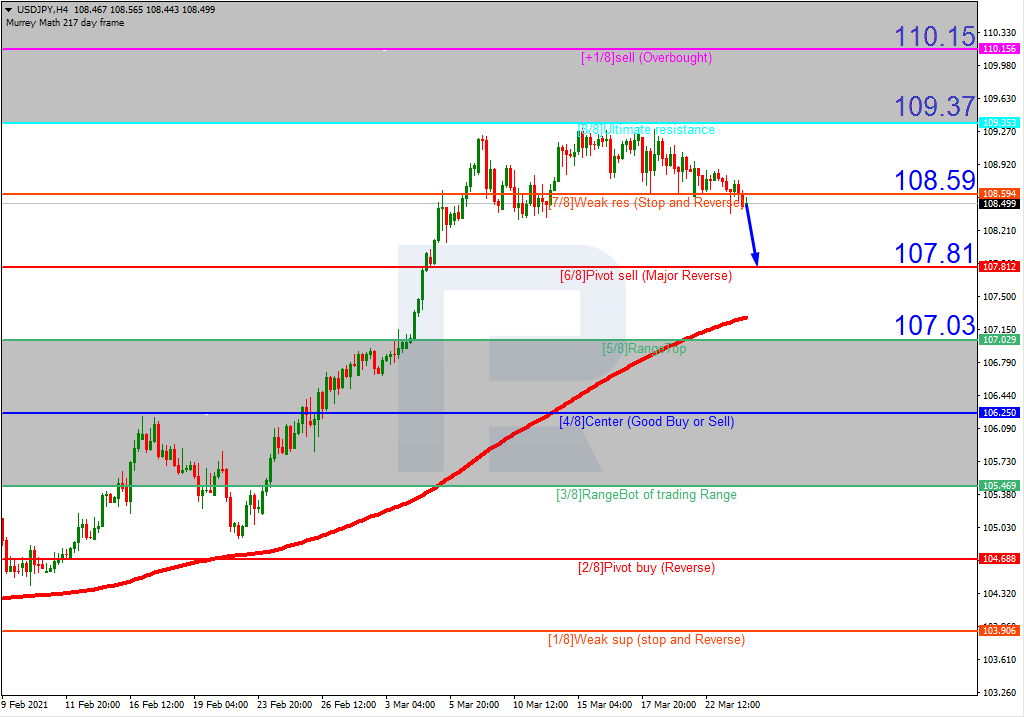
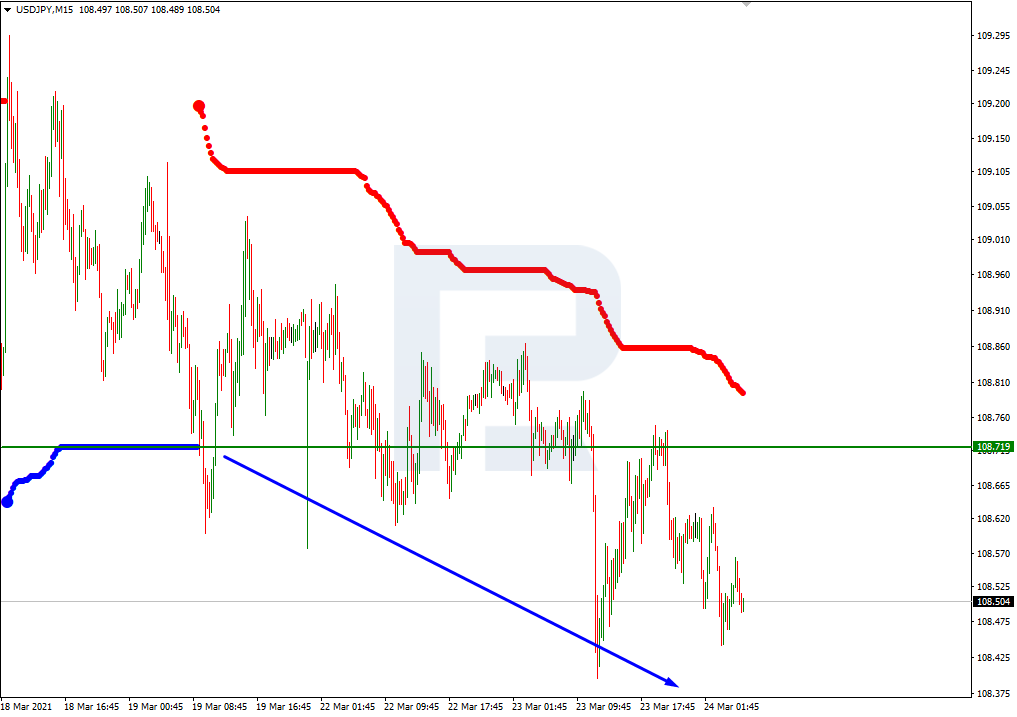
USDJPY is still consolidating around 108.88. Today, the pair may expand the range up to 109.40 and then resume trading downwards with the target at 108.40.

USDJPY
Risk Warning: the result of previous trading operations do not guarantee the same results in the future

USDCHF, “US Dollar vs Swiss Franc”

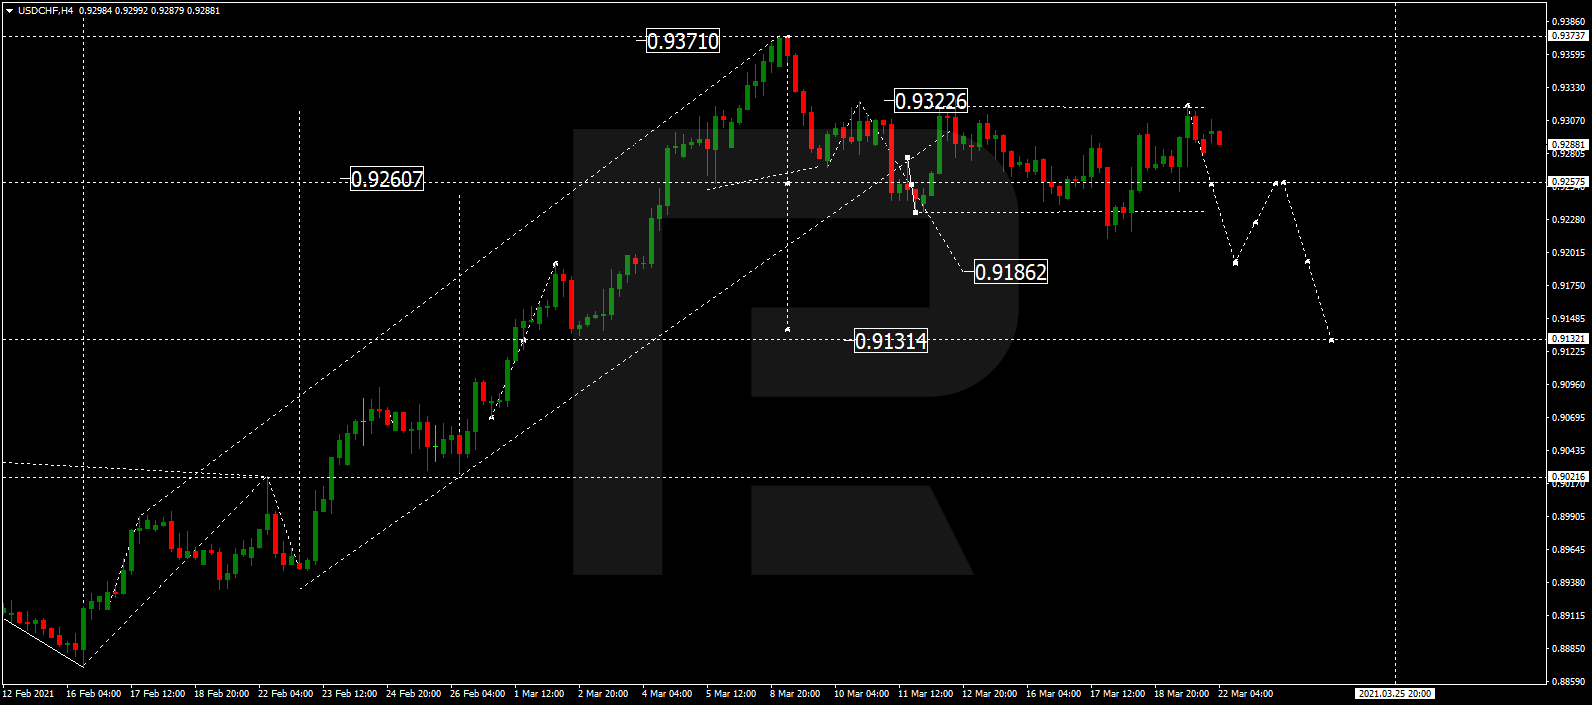
After completing the descending structure at 0.9233, USDCHF has finished the correction towards 0.9327. Today, the pair may continue falling towards 0.9186. Later, the market may start a new correction to reach 0.9270 and then resume trading downwards with the target at 0.9023.

USDCHF
Risk Warning: the result of previous trading operations do not guarantee the same results in the future

AUDUSD, “Australian Dollar vs US Dollar”

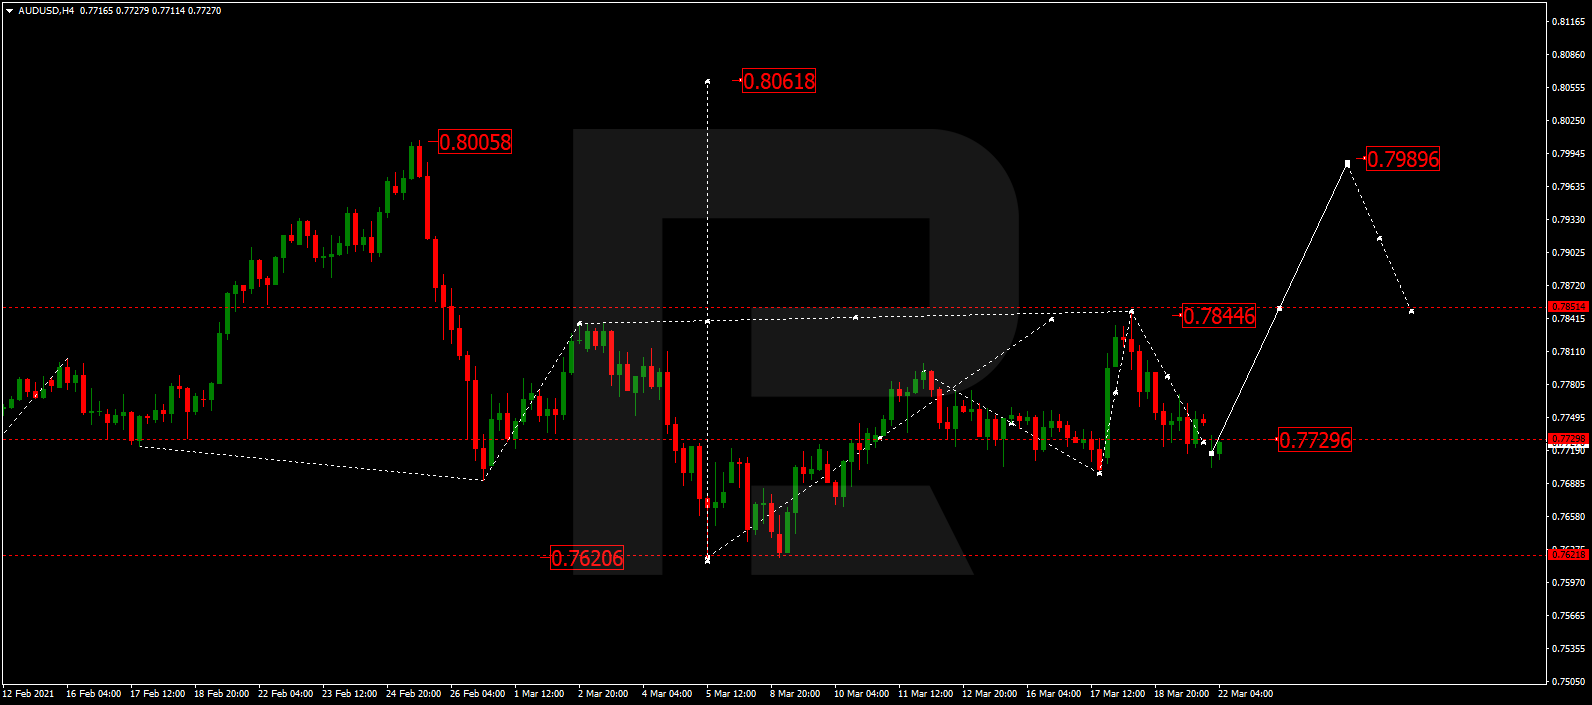
After finishing the ascending structure at 0.7800 along with the descending wave towards 0.7740, AUDUSD is expected to grow and reach 0.7860. Later, the market may start another correction with the target at 0.7740.

AUDUSD
Risk Warning: the result of previous trading operations do not guarantee the same results in the future

BRENT

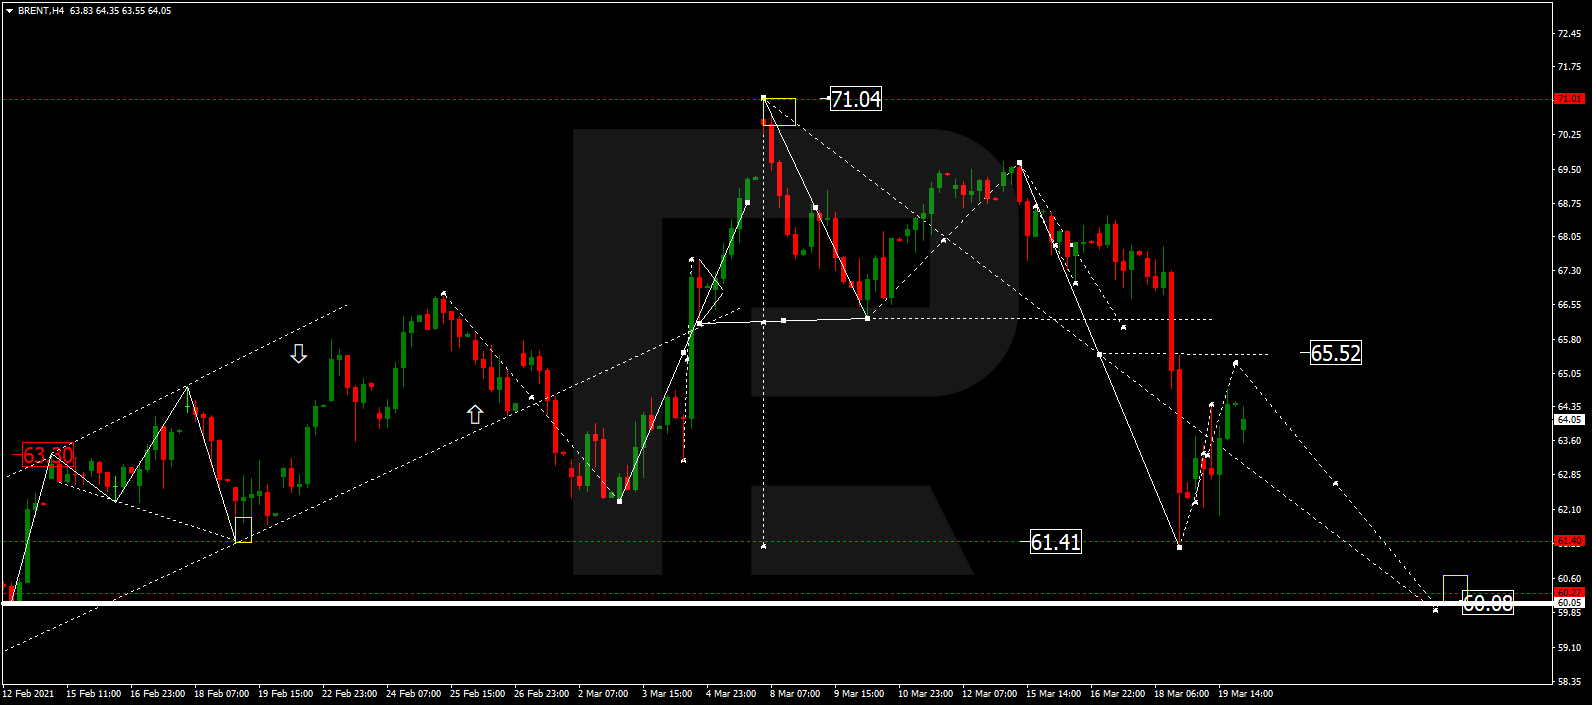
Brent has formed a new consolidation range around 68.86. Possibly, today the asset may break it to the upside and reach 70.80. After that, the instrument may start a new decline towards 68.85 and then form one more ascending structure with the target at 71.20.

BRENT
Risk Warning: the result of previous trading operations do not guarantee the same results in the future

XAUUSD, “Gold vs US Dollar”

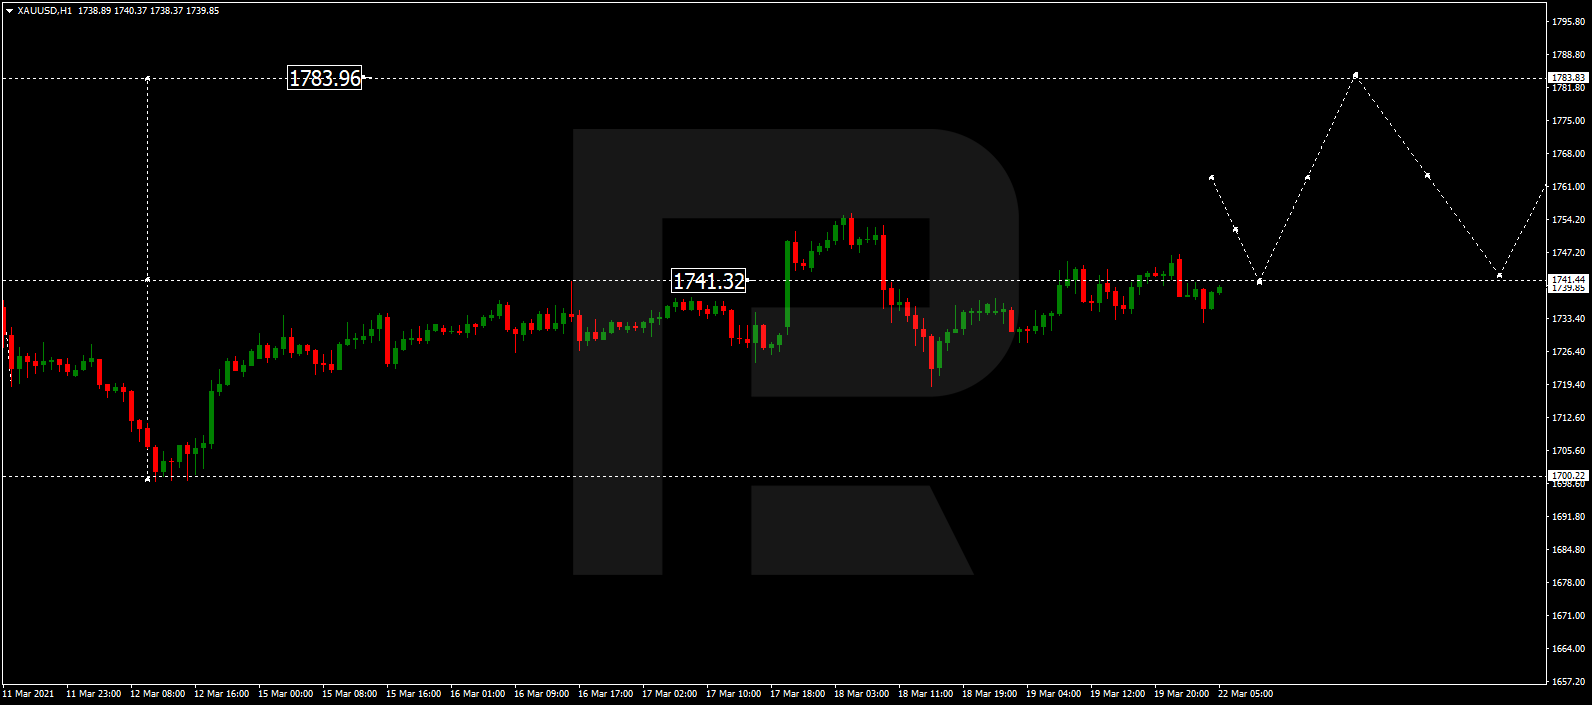
After completing the correction at 1700.44, Gold is expected to grow towards 1743.15 and may later correct to reach 1721.72. After that, the instrument may form one more ascending structure with the target at 1772.50.

GOLD
Risk Warning: the result of previous trading operations do not guarantee the same results in the future

S&P 500

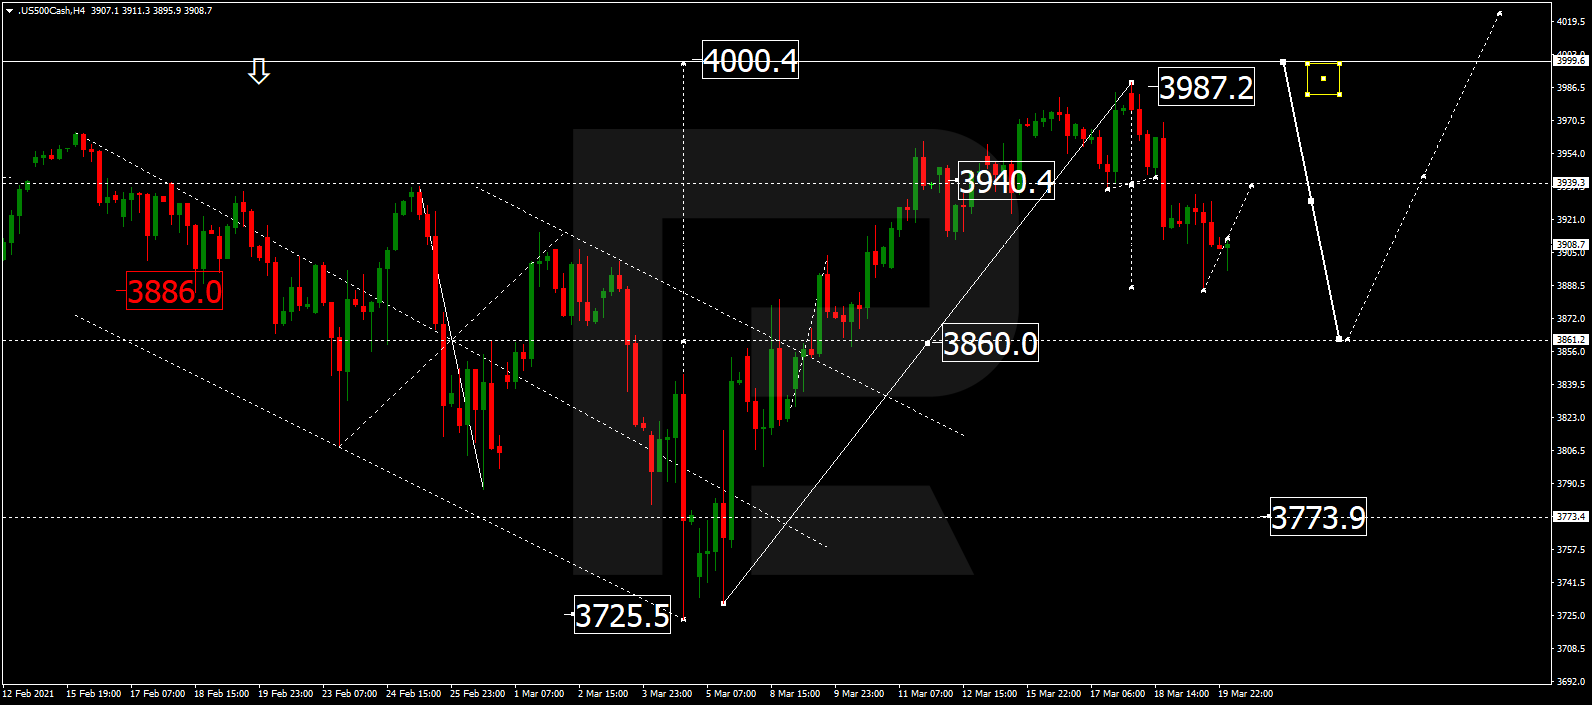
The S&P index is trading to reach 4000.0. Later, the market may correct towards 3850.0 and then resume moving upwards with the target at 4126.0.

S&P 500

Article By RoboForex.com

Attention!
Forecasts presented in this section only reflect the author’s private opinion and should not be considered as guidance for trading. RoboForex LP bears no responsibility for trading results based on trading recommendations described in these analytical reviews.

The Analytical Overview of the Main Currency Pairs on 2021.03.15

by JustForex

The EUR/USD currency pair

Technical indicators of the currency pair:
  • Prev Open: 1.1984
  • Prev Close: 1.1952
  • % chg. over the last day: -0.27%

On Friday, the euro made a slight pullback after rising within the week. Positive statistics in the US continue to put pressure on EUR/USD in the medium term. In the absence of important macroeconomic data, calm trading is expected today.

Trading recommendations
  • Support levels: 1.1834, 1.1746
  • Resistance levels: 1.1967, 1.1990

The main scenario for EUR/USD is selling. Despite the low volatility, the ADX continues to react to any southern movement. The MACD failed to enter the positive area on the upward price pullback, which indicates a high probability of the pair returning to 1.1834.

Alternative scenario: if the price manages to gain a foothold above the level of 1.1990, the pair may return to growth to 1.2113.

EUR/USD
There is no news feed for today.

The GBP/USD currency pair

Technical indicators of the currency pair:
  • Prev Open: 1.3987
  • Prev Close: 1.3918
  • % chg. over the last day: -0.49%

In addition to the dollar growth, the pair is still under pressure from trade disputes between the EU and the UK. Investors are wary of developments at the British border, where transport companies face delays in the transportation of goods.

Trading recommendations
  • Support levels: 1.3857, 1.3775
  • Resistance levels: 1.3997, 1.4224

The main scenario for GBP/USD is selling. The pair’s decline on Friday triggered a strong ADX reaction. The MACD has consolidated below zero, and the price is below the moving averages. It indicates a high probability of the continuation of the bearish scenario for the sterling.

Alternative scenario: if the pair consolidates above 1.3997, it may resume growth to the year’s highs.

GBP/USD
There is no news feed for today.

The USD/JPY currency pair

Technical indicators of the currency pair:
  • Prev Open: 108.48
  • Prev Close: 109.01
  • % chg. over the last day: +0.49%

The rise in risky assets and bond yields continues to support the bulls in the dollar-yen. The upward bias of the dollar index is an additional bullish driver. Medium-term expectations for the growth of the instrument are increasingly strengthening from a fundamental point of view.

Trading recommendations
  • Support levels: 108.35, 107.08
  • Resistance levels: 109.34, 109.86

The main scenario is buying. In the Asian session, the price rises, but the ADX shows a decline in bullish potential. The MACD is fixed above zero. It indicates moderate northerly movement with frequent southerly pullbacks.

An alternative scenario implies the price-fixing below 108.35. In this case, the pair may return to the decline to 107.08.

USD/JPY
There is no news feed for today.

The USD/CAD currency pair

Technical indicators of the currency pair:
  • Prev Open: 1.2528
  • Prev Close: 1.2472
  • % chg. over the last day: -0.45%

The Canadian currency continued to fall in light of rising oil prices and reached its lowest levels this year. Given the fact that the oil price is about $14 higher than at the beginning of the year, the pressure on the pair may continue. The probability of consolidation below 1.2467 is still high.

Trading recommendations
  • Support levels: 1.2519, 1.2467
  • Resistance levels: 1.2592, 1.2745

The main scenario is selling. The ADX showed a decrease in the southern movement’s potential, but convergence formed on the MACD. A stop near a strong support level indicates the likelihood of a pullback, which is safer to use to build up short positions.

Alternative scenario: if the price gains a foothold above 1.2528, the pair may go for a correction to 1.2592.

USD/CAD
There is no news feed for today.

by JustForex


This article reflects a personal opinion and should not be interpreted as an investment advice, and/or offer, and/or a persistent request for carrying out financial transactions, and/or a guarantee, and/or a forecast of future events.

The dollar and the stock market continue to show a tendency towards growth

by JustForex

On Friday, the dollar index resumed its growth on the back of positive macroeconomic data and rising Treasury yields. The latter consolidated above 1.60% after the publication of PPI data. US producer prices rose the most in February since October 2018 which is a testament to rising inflation in the manufacturing sector as the country begins to emerge from the pandemic.

According to the National Bureau of Statistics, the PPI increased by 2.8% on an annualized basis since February last year, accelerating by 1.1%. Without considering food and energy prices, the so-called core PPI increased by 2.5% over the previous year.

Investors and economists differed in their opinions regarding inflation forecasts, with some predicting that price pressures will continue to rise amid higher demand and government stimulus, while others predict short-term inflation.

Despite the rising PPI in February, the US Consumer Confidence rose in March. The University of Michigan preliminary Sentiment Index surged to 83 from 76.8 in February. That figure beat economists’ mid-point forecast of 78.5 and set a new annual high as an increase in vaccinations and tax breaks boosted optimism about the economic outlook.

University of Michigan study manager Richard Curtin said that the data indicated significant growth in consumer spending in the coming year, with the largest percentage gains in services. In early March, half of all consumers surveyed reported favorable economic development, while the majority of them are that optimistic because of being hired.

Against this background, the dollar index resumed its growth after a three-day correction. The S&P 500 is near annual maximum.

Main market quotes:

S&P 500 (F) 3,938.88 +6.13 (+0.16%)

Dow Jones 32,778.64 +293.05 (+0.90%)

DAX 14,567.25 +64.86 (+0.45%)

FTSE 100 6,801.20 +39.73 (+0.59%)

USD Index 91.752 +0.075 (+0.08%)

There is no news feed for today.

by JustForex


This article reflects a personal opinion and should not be interpreted as an investment advice, and/or offer, and/or a persistent request for carrying out financial transactions, and/or a guarantee, and/or a forecast of future events.