Archive for Forex and Currency News – Page 292

Japanese Candlesticks Analysis 05.04.2021 (GOLD, NZDUSD, GBPUSD)

Article By RoboForex.com

XAUUSD, “Gold vs US Dollar”

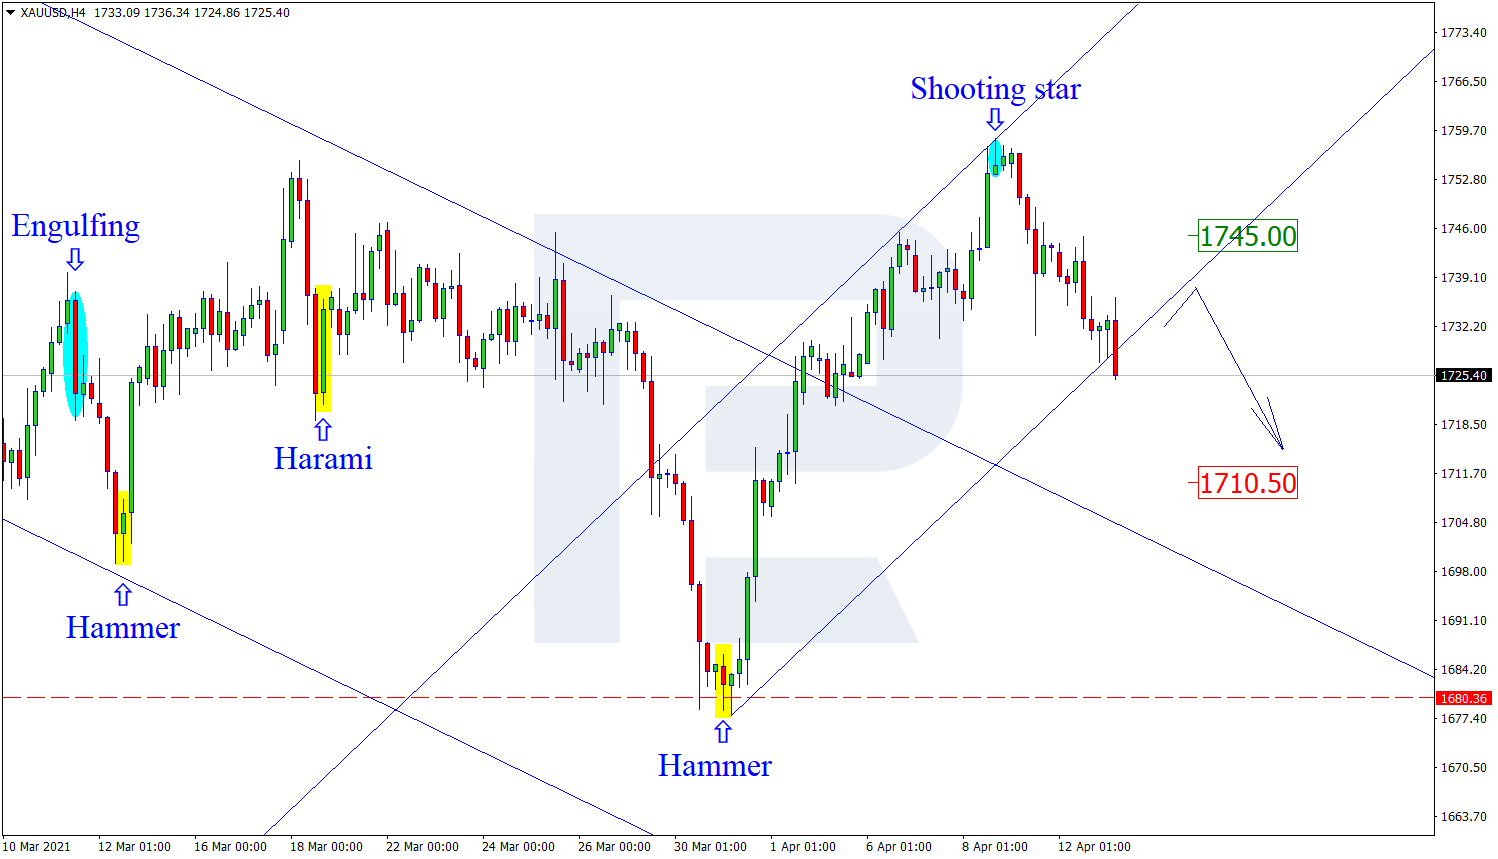
The pair is completing a correction. AT the resistance level, gold has formed several reversal patterns including a Doji. Going by the reversal patterns, the price might continue the downtrend, aiming at 1700.00. However, the quotations might sill grow to 1735.00, skipping the reversal patterns.

XAUUSD
Risk Warning: the result of previous trading operations do not guarantee the same results in the future

NZDUSD, “New Zealand Dollar vs US Dollar”

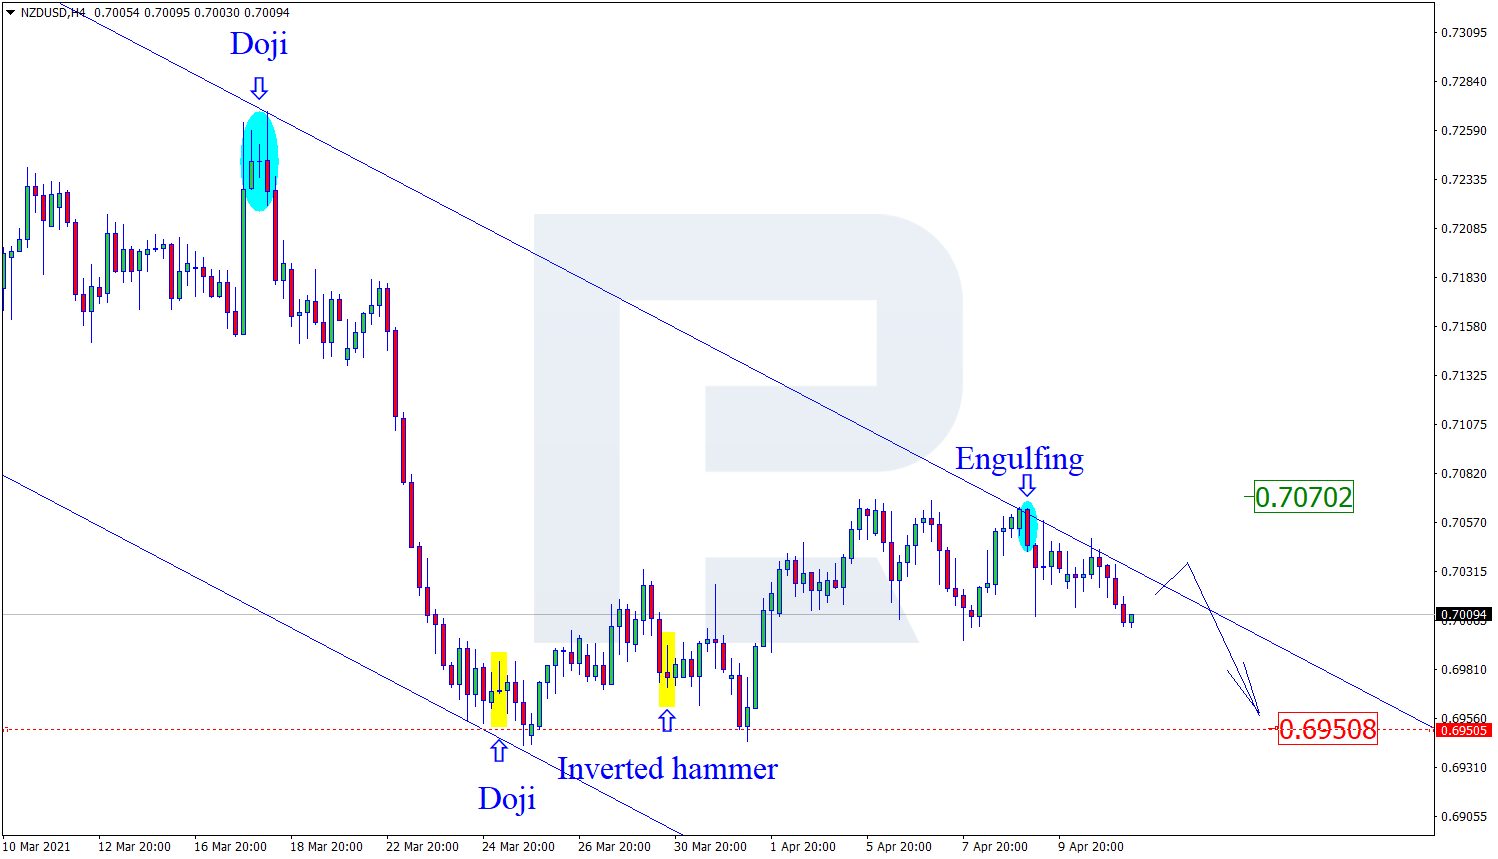
On H4, the pair keeps developing a correction. At the resistance level, the pair has formed several reversal patterns, including the Engulfing pattern. The aim of the decline is 0.6915. After testing the support level, the pair might break through the level and go on declining. However, the quotations might still grow to 0.7070, skipping the reversal patterns.

NZDUSD
Risk Warning: the result of previous trading operations do not guarantee the same results in the future

GBPUSD, “Great Britain Pound vs US Dollar”

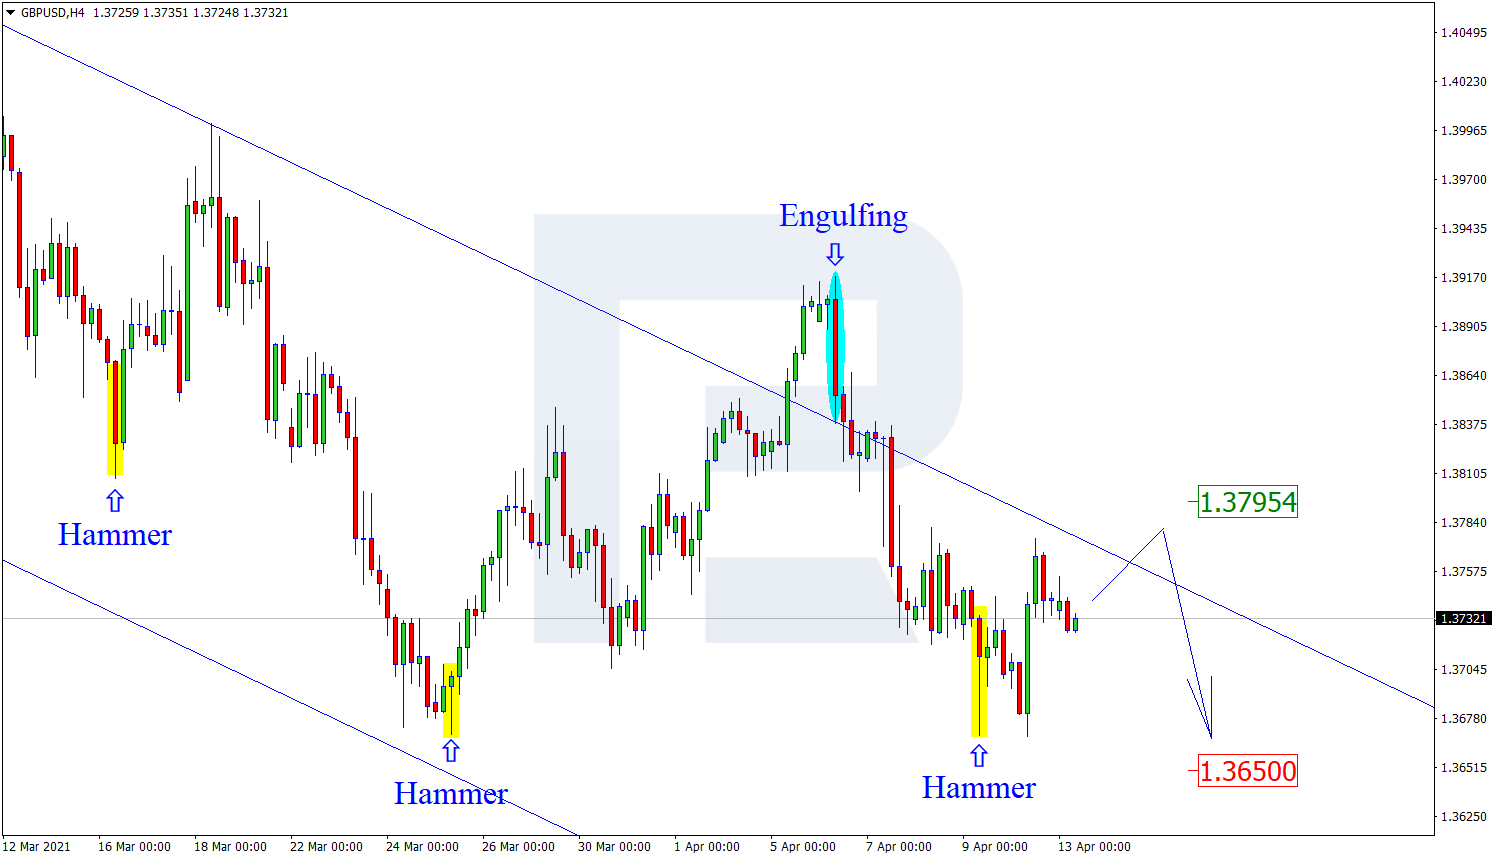
On H4, the pair is completing a correction in a downtrend. At the resistance line, the pair has formed several reversal patterns, including the Engulfing pattern. Going by the patterns, the pair might currently continue the descending impulse, aiming at 1.3730. Then, breaking through the support level, the quotations might enforce the descending dynamics. However, the price might grow to 1.3880 before further falling.

GBPUSD

Article By RoboForex.com

Attention!
Forecasts presented in this section only reflect the author’s private opinion and should not be considered as guidance for trading. RoboForex LP bears no responsibility for trading results based on trading recommendations described in these analytical reviews.

The stock market and the dollar are growing amid positive data on the US labor market

by JustForex

On Monday, most Asian stocks have increased in line with S&P 500 futures amid an unexpectedly positive US employment report. Bonds are recovering from last week’s losses on the credit market, while the dollar is showing an upward trend.

US businesses created 916,000 jobs in March, beating economists’ forecast of 660,000. March figures were even higher than some economists’ highest expectations of 800,000. The unemployment rate fell to 6%, in line with the forecast, while the share of the economically active population rose to 61.5%. And while unemployment figures are still close to the great depression of the 1970s, Fed Chairman Jerome Powell described them as “very encouraging.”

Most of Asia’s regional stock indices have risen. The Indian stock market became an exception, where stocks fell the most in just five weeks as more than 100,000 new cases of Covid-19 were recorded in the last 24 hours. Many financial centers were closed for the holidays, including China and Hong Kong, as well as the major part of Europe. S&P 500 futures have been rising since Friday.

Treasury yields also continue to rise amid expectations for global economic growth following the US recovery. Treasury yield stabilized at 1.72%. US 2-year bonds yield rose unexpectedly to 0.18%. These securities haven’t responded to the strong reports for a long time and now talks on the Fed earlier rate hike may return.

Oil remains under pressure after OPEC+ leaders decided to increase production, and the increase in the number of infected in India and Europe increases risks to energy demand. Commodity currencies came under pressure following oil prices, while the dollar index rose.

Main market quotes:

S&P 500 (F) 4,024.12 +14.12 (+0.35%)

Dow Jones 33,153.21 +171.66 (+0.52%)

DAX 15,107.17 +98.83 (+0.66%)

FTSE 100 6,737.30 +23.67 (+0.35%)

USD Index 93.097 +0.046 (+0.05%)

Important events:
  • – US ISM Non-Manufacturing PMI (Mar) at 17:00 (GMT+3).

by JustForex


This article reflects a personal opinion and should not be interpreted as an investment advice, and/or offer, and/or a persistent request for carrying out financial transactions, and/or a guarantee, and/or a forecast of future events.

The Analytical Overview of the Main Currency Pairs on 2021.04.05

by JustForex

The EUR/USD currency pair

Technical indicators of the currency pair:
  • Prev Open: 1.1777
  • Prev Close: 1.1761
  • % chg. over the last day: -0.14%

The corrective northern pullback in the euro was interrupted by positive data on the US labor market. The pair closed the day in the red, and the government bond yield spread between German Bonds and American T-Notes indicates a possible continuation of the euro-dollar pair’s decline.

Trading recommendations
  • Support levels: 1.1688, 1.1601
  • Resistance levels: 1.1889, 1.1990

The main scenario for EUR/USD is trading in a sideways range. Technical indicators show the likely continuation of the flat trading since the MACD is near zero, and the price is between the moving averages. The ADX hardly reacted to the southern movement on Friday. But it should be noted that the fundamental data indicate a greater likelihood of a price decline.

Alternative scenario: if the price manages to gain a foothold above the level of 1.1815, the pair may start a corrective rise to 1.1889. A breakdown of 1.1688 will indicate the resumption of the southern movement.

EUR/USD
News feed for 2021.04.05:
  • – The US ISM Non-Manufacturing Purchasing Managers’ Index (Mar) at 17:00 (GMT+3).

The GBP/USD currency pair

Technical indicators of the currency pair:
  • Prev Open: 1.3830
  • Prev Close: 1.3823
  • % chg. over the last day: -0.05%

The pound-dollar pair remained almost unchanged on Friday. The reaction to the NFP data was significantly less than in the euro-dollar, which is partly due to a decrease in trading volume. But at the same time, the pound shows the strength of the bulls, as the price remains close to the weekly range’s upper level.

Trading recommendations
  • Support levels: 1.3705, 1.3680
  • Resistance levels: 1.3846, 1.3929

The main scenario for GBP/USD is trading sideways between 1.3846 and 1.3780. At the end of the week, technical indicators showed an increase in bullish pressure on the H1 timeframe. But with the opening of the Asian session on Monday, further gains were called into question, as the ADX fell to its lowest levels. The MACD fell to zero, and the price is between the moving averages.

Alternative scenario: if the pair consolidates above 1.3846, the pound may resume its growth to 1.3929. A breakdown of 1.3780 could trigger a further drop to 1.3705.

GBP/USD
News feed for 2021.04.05:
  • – The US ISM Non-Manufacturing Purchasing Managers’ Index (Mar) at 17:00 (GMT+3).

The USD/JPY currency pair

Technical indicators of the currency pair:
  • Prev Open: 110.61
  • Prev Close: 110.68
  • % chg. over the last day: +0.06%

The dollar-yen pair has maintained a northern direction. The stock market rallied on Friday, with the S&P 500 breaking records and bond yields continuing to rise. The dollar is also inclined to rise. All these factors provide strong support to the pair.

Trading recommendations
  • Support levels: 109.38, 108.35
  • Resistance levels: 111.71, 112.24

The main scenario is buying. Almost all technical indicators are in equilibrium. The MACD shows zero values, and the ADX is at the minimum. But as long as the price is above the moving averages, the likelihood of renewed growth in the pair increases.

An alternative scenario implies price fixing below 110.30. In this case, the pair could drop to 109.38.

USD/JPY
News feed for 2021.04.05:
  • – The US ISM Non-Manufacturing Purchasing Managers’ Index (Mar) at 17:00 (GMT+3).

The USD/CAD currency pair

Technical indicators of the currency pair:
  • Prev Open: 1.2543
  • Prev Close: 1.2570
  • % chg. over the last day: +0.22%

The Canadian dollar is showing a downward bias as the rise in oil prices has stopped. In the Asian session on Monday, WTI futures lost about $0.90, supporting the bulls in USD/CAD.

Trading recommendations
  • Support levels: 1.2574, 1.2446
  • Resistance levels: 1.2629, 1.2745

The main scenario is buying. The ADX shows the rise in bullish pressure, which increases the likelihood of a breakout of the first resistance level. The MACD has consolidated above zero, while the price is above the moving averages.

Alternative scenario: if the price manages to consolidate below 1.2560, the pair may resume its decline to 1.2466.

USD/CAD
News feed for 2021.04.05:
  • – The US ISM Non-Manufacturing Purchasing Managers’ Index (Mar) at 17:00 (GMT+3).

by JustForex


This article reflects a personal opinion and should not be interpreted as an investment advice, and/or offer, and/or a persistent request for carrying out financial transactions, and/or a guarantee, and/or a forecast of future events.

Key events this week: How will the Fed react to bumper US jobs report?

By Han Tan Market Analyst, ForexTime

Although several major markets are still closed today due to the Easter weekend (Australia, UK, Europe, Hong Kong), the markets that are open are offering their reaction to this past Friday’s bumper US non-farm payrolls report. The US economy added 916,000 jobs in March, which far exceeded economists’ expectations for 660,000. The US unemployment rate has now dropped to 6%, compared to 6.2% in the month prior.

This stellar piece of economic data justifies investors’ optimism surrounding the US economic recovery, which is set to further encourage the reflation trade.

Asian stocks are in the green with Japan’s Nikkei 225 gaining by more than one percent at the open. US equity futures are climbing as well, which potentially paves the way for a new record high for the Dow Jones index and the S&P 500. Note that the latter index closed above the psychologically-important 4,000 mark for the first time in history before the long Easter weekend.

Once that stellar NFP print has been digested, global investors will have more key economic data and market events to ponder upon over the coming days:

Monday, April 5:

  • IMF and World Bank spring meetings begin
  • US factory orders

Tuesday, April 6:

  • RBA policy decision
  • China Caixin services PMI
  • Eurozone unemployment
  • IMF releases updated World Economic Outlook
  • US Treasury Secretary Janet Yellen to speak on IMF spring meeting panel

Wednesday, April 7:

  • FOMC meeting minutes
  • Fed speak: Chicago Fed President Charles Evans, Dallas Fed President Robert Kaplan
  • Eurozone services PMI

Thursday, April 8:

  • Fed Chair Jerome Powell to speak on IMF spring meeting panel
  • Fed speak: St. Louis Fed President James Bullard, Minneapolis Fed President Neel Kashkari
  • ECB meeting minutes
  • Germany factory orders


Markets to keep fighting the Fed?

10-year Treasury yields are now trading about 10-basis points higher compared to levels around the FOMC’s last meeting on March 16-17. With every basis point it climbs, it potentially lowers the bar for the Federal Reserve to intervene.

If or when the Fed decides to bat down Treasury yields, such an act may trigger a massive bout of volatility across broad asset classes.

With so much at stake, investors and traders are expected to pay close attention to this week’s commentary out of Fed officials, including the Fed Chair himself, along with the Wednesday release of the FOMC March meeting minutes. The meeting minutes could help offer more insights into policymakers’ views surrounding US inflation, and their biases as to how the Fed should eventually respond. As things stand, benchmark interest rates remain near zero while the central bank continues lapping up $120 billion in bonds per month to help support financial markets.

Fed Chair Powell has long iterated that the US economy remains a long way from a full recovery and that the central bank doesn’t yet see a need to tamper down rocketing Treasury yields.

It remains to be seen whether Powell, and the other Fed officials, might tweak their tune this week following the latest jobs report. The slightest suggestion that the Fed is ready to curb the surge in Treasury yields, or that they are more comfortable raising interest rates sooner than later, may unwind some of the dollar’s recent gains.

Dollar defiant

The US dollar has received a boost this year from surging Treasury yields, defying market expectations for a weaker greenback in 2021. The dollar index (DXY) has instead gained by 3.33% so far this year, though it has moderated below the psychologically-important 93 mark as yields soften at the time of writing.

From a technical perspective, the DXY’s 50-day simple moving average crossed above its 100-day counterpart on 26 March, with the index then adding about 0.2% since forming that ‘golden cross’. And with its 14-day relative strength index pulling away from overbought levels, coupled with the momentum indicator that still rings bullish, the DXY may now have line of sight of the November high of 94.31 sometime in Q2.

Such an upward trajectory for the greenback assumes that the Fed will still tolerate higher Treasury yields, while the US economic recovery and its vaccination efforts can continue at a faster clip compared to Europe, noting that the euro currency accounts for 57.6% of the DXY.


Disclaimer: The content in this article comprises personal opinions and should not be construed as containing personal and/or other investment advice and/or an offer of and/or solicitation for any transactions in financial instruments and/or a guarantee and/or prediction of future performance. ForexTime (FXTM), its affiliates, agents, directors, officers or employees do not guarantee the accuracy, validity, timeliness or completeness, of any information or data made available and assume no liability as to any loss arising from any investment based on the same.


Forex-Time-LogoArticle by ForexTime

ForexTime Ltd (FXTM) is an award winning international online forex broker regulated by CySEC 185/12 www.forextime.com

The US dollar continues its upward trend

By Admiral Markets

For the third consecutive week, the dollar index grew compared to its main competitors, continuing the upward trend in the dollar index that began after marking lows at $89.21 on January 6.

As we mentioned last month, the US dollar has been supported by the increase in the yield of US bonds which, together with the strength shown by the US labour market during the months of February and March, have led this index to exceed 93.00 USD.

Specifically, despite last week being atypical due to the Easter holidays, on Friday we learned the employment data for the month of March, which were not only better than expected, but far exceeded the Market expectations, as the NFPs showed the creation of 916,000 jobs compared to the 647,000 expected. On the other hand, the data from last February was also revised, showing an additional increase of 89,000 jobs, reaching a total of 468,000.

EURUSD analysis

For yet another week, the EURUSD continued its downward trend as the pandemic and lack of vaccines delay recovery in Europe despite the macroeconomic positives during the past week.

Technically speaking, after bouncing back to the downside after facing its 18-session average forming a double top, the price returned to its 200-session average breaking down at the end of March. The break of this important support level in the red, has led the price to seek its important long-term trend line in the red where it made a bullish rebound.

The loss of this level could endanger the uptrend and confirm a change in trend, leading the price to seek its next support level in the lower red band or even at the level of 1.15. As long as the price is not able to rise again to its 18-session black average, the sentiment will be bearish.

Source: EURUSD daily chart from Admiral Markets MetaTrader 5 platform from December 18, 2019 to April 4, 2021. Taken on April 4 at 18:50 CEST. Note: Past performance is not a reliable indicator of future results, or future performance.

Price evolution of the last 5 years:

  • 2020 = + 8.93%
  • 2019 = -2.21%
  • 2018 = -4.47%
  • 2017 = + 14.09%
  • 2016 = -3.21%


GBPUSD analysis

In the GBPUSD, we can see that the pair is following a very clear uptrend since it marked lows on March 20, 2020 around the level of 1.14100 until almost reaching the level of 1.42366, which has led it to exceed its long-term downtrend line (in red dotted) .

As we can see in the weekly chart, after marking highs last February, the price, as in the EURUSD, has started with a correction that has led it to lose the important level of 1.40 to 1.38205.

This downward movement can cause the price to seek its current support levels at the uptrend line and the 18-session black average, thus alleviating the accumulated overbought of recent weeks. As long as the price does not lose either of these two levels, the feeling will continue to be bullish. The loss of these levels would open the doors to a further correction to the previous resistance level in red.

Source: GBPUSD weekly chart from Admiral Markets MetaTrader 5 platform from September 7, 2014 to April 4, 2021. Taken on April 4 at 19:00 CET Note: Past performance is not a reliable indicator of future results, or future performance.

Price evolution of the last 5 years:

  • 2020 = + 3.10%
  • 2019 = + 3.95%
  • 2018 = -5.54%
  • 2017 = + 9.43%
  • 2016 = -16.26%


USDJPY Analysis

Finally, if we look at the USDJPY, we can see how the Japanese Yen is one of the big losers from the rises in the dollar, and has lost a lot of ground after its last rebound.

As we can see in the weekly chart, after facing its important support level represented by the red band for a long time, the price has definitely bounced above the 200 average in red. The break of this level has triggered a strong upward momentum that has led it to exceed its downtrend line and to reach the 110,650 level again.

As we mentioned last March, exceeding this level could open the doors to a bullish rally until reaching the upper part of the lateral channel in green.

Source: Admiral Markets MetaTrader 5 platform USDJPY weekly chart from November 2, 2014 to March 8, 2021. Taken on March 8 at 1:05 PM CET. Note: Past performance is not a reliable indicator of future results, or future performance.

Price evolution of the last 5 years:

  • 2020 = -4.95%
  • 2019 = -0.88%
  • 2018 = -2.76%
  • 2017 = -3.59%
  • 2016 = -2.85%

With the Admiral Markets Trade.MT5 account, you can trade Contracts for Differences (CFDs) on the EUR/USD and more than 3000 stocks! CFDs allow traders to try to profit from the bull and bear markets, as well as the use of leverage. Click on the following banner to open an account today:

Trade With MetaTrader 5

INFORMATION ABOUT ANALYTICAL MATERIALS:

The given data provides additional information regarding all analysis, estimates, prognosis, forecasts, market reviews, weekly outlooks or other similar assessments or information (hereinafter “Analysis”) published on the websites of Admiral Markets investment firms operating under the Admiral Markets trademark (hereinafter “Admiral Markets”) Before making any investment decisions please pay close attention to the following:

  1. This is a marketing communication. The content is published for informative purposes only and is in no way to be construed as investment advice or recommendation. It has not been prepared in accordance with legal requirements designed to promote the independence of investment research, and that it is not subject to any prohibition on dealing ahead of the dissemination of investment research.
  2. Any investment decision is made by each client alone whereas Admiral Markets shall not be responsible for any loss or damage arising from any such decision, whether or not based on the content.
  3. With view to protecting the interests of our clients and the objectivity of the Analysis, Admiral Markets has established relevant internal procedures for prevention and management of conflicts of interest.
  4. The Analysis is prepared by an independent analyst, Roberto Rojas (analyst), (hereinafter “Author”) based on their personal estimations.
  5. Whilst every reasonable effort is taken to ensure that all sources of the content are reliable and that all information is presented, as much as possible, in an understandable, timely, precise and complete manner, Admiral Markets does not guarantee the accuracy or completeness of any information contained within the Analysis.
  6. Any kind of past or modeled performance of financial instruments indicated within the content should not be construed as an express or implied promise, guarantee or implication by Admiral Markets for any future performance. The value of the financial instrument may both increase and decrease and the preservation of the asset value is not guaranteed.
  7. Leveraged products (including contracts for difference) are speculative in nature and may result in losses or profit. Before you start trading, please ensure that you fully understand the risks involved.

By Admiral Markets

Hot topic: NFP smashes expectations

By Lukman Otunuga Research Analyst, ForexTime

916,000 was the number of jobs created by the US economy in March. This figure not only smashed the 660,000 forecast but was the strongest employment growth in seven months. The unemployment rate fell to 6% from 6.2% previously while average hourly earnings dropped -0.1% below expectations of 0.2% mom. Overall, today’s jobs report is certainly encouraging and suggests that economic activity is picking up in the world’s largest economy. As the vaccine distribution builds momentum and Biden’s $1.9 trillion stimulus offers support for businesses, the outlook for the US labour market continues to brighten.

Looking at the charts, the Dollar Index (DXY) remains bullish on the daily timeframe. There have been consistently highs and higher lows while the MACD trades above 0. A solid weekly close above 93.00 could open the doors towards 93.47.

It may be wise to keep an eye on the the Relative Strength Index (RSI) which is trading near overbought levels. This may invite bears to attack the DXY if 93.00 proves to be reliable resistance. A decline towards 92.50 could be on the cards if this scenario plays out.

Disclaimer: The content in this article comprises personal opinions and should not be construed as containing personal and/or other investment advice and/or an offer of and/or solicitation for any transactions in financial instruments and/or a guarantee and/or prediction of future performance. ForexTime (FXTM), its affiliates, agents, directors, officers or employees do not guarantee the accuracy, validity, timeliness or completeness, of any information or data made available and assume no liability as to any loss arising from any investment based on the same.


Forex-Time-LogoArticle by ForexTime

ForexTime Ltd (FXTM) is an award winning international online forex broker regulated by CySEC 185/12 www.forextime.com

COT Currency Futures Charts: Bitcoin, US Dollar Index, Euro, Japanese Yen & Mexican Peso

By CountingPips.comReceive our weekly COT Reports by Email 

Here are the latest charts and statistics for the Commitment of Traders (COT) data published by the Commodities Futures Trading Commission (CFTC).

The latest COT data is updated through Tuesday March 30 2021 and shows a quick view of how large traders (for-profit speculators and commercial entities) were positioned in the futures markets. All currency positions are in direct relation to the US dollar where, for example, a bet for the euro is a bet that the euro will rise versus the dollar while a bet against the euro will be a bet that the euro will decline versus the dollar.


US DOLLAR INDEX:

US DOLLAR INDEX StatisticsSPECULATORSCOMMERCIALSSMALL TRADERS
– Percent of Open Interest Longs:75.74.515.3
– Percent of Open Interest Shorts:61.528.06.0
– Net Position:5,726-9,5013,775
– Gross Longs:30,5131,7986,175
– Gross Shorts:24,78711,2992,400
– Long to Short Ratio:1.2 to 10.2 to 12.6 to 1
NET POSITION TREND:
– COT Index Score (3 Year Range Pct):35.758.868.2
– COT Index Reading (3 Year Range):BearishBullishBullish
NET POSITION MOVEMENT INDEX:
– 6-Week Change in Strength Index:34.5-36.424.8


EURO Currency:

EURO Currency StatisticsSPECULATORSCOMMERCIALSSMALL TRADERS
– Percent of Open Interest Longs:30.254.514.2
– Percent of Open Interest Shorts:18.873.36.8
– Net Position:73,739-121,32847,589
– Gross Longs:194,763351,29291,621
– Gross Shorts:121,024472,62044,032
– Long to Short Ratio:1.6 to 10.7 to 12.1 to 1
NET POSITION TREND:
– COT Index Score (3 Year Range Pct):57.641.474.0
– COT Index Reading (3 Year Range):BullishBearishBullish
NET POSITION MOVEMENT INDEX:
– 6-Week Change in Strength Index:-20.320.5-10.8


BRITISH POUND STERLING:

BRITISH POUND StatisticsSPECULATORSCOMMERCIALSSMALL TRADERS
– Percent of Open Interest Longs:33.841.224.5
– Percent of Open Interest Shorts:15.963.819.7
– Net Position:24,959-31,5806,621
– Gross Longs:47,22257,58434,194
– Gross Shorts:22,26389,16427,573
– Long to Short Ratio:2.1 to 10.6 to 11.2 to 1
NET POSITION TREND:
– COT Index Score (3 Year Range Pct):84.917.578.4
– COT Index Reading (3 Year Range):Bullish-ExtremeBearish-ExtremeBullish
NET POSITION MOVEMENT INDEX:
– 6-Week Change in Strength Index:1.93.4-21.3


JAPANESE YEN:

JAPANESE YEN StatisticsSPECULATORSCOMMERCIALSSMALL TRADERS
– Percent of Open Interest Longs:14.972.911.3
– Percent of Open Interest Shorts:50.724.224.2
– Net Position:-59,48180,881-21,400
– Gross Longs:24,724121,11518,838
– Gross Shorts:84,20540,23440,238
– Long to Short Ratio:0.3 to 13.0 to 10.5 to 1
NET POSITION TREND:
– COT Index Score (3 Year Range Pct):33.672.915.3
– COT Index Reading (3 Year Range):BearishBullishBearish-Extreme
NET POSITION MOVEMENT INDEX:
– 6-Week Change in Strength Index:-58.355.1-37.6


SWISS FRANC:

SWISS FRANC StatisticsSPECULATORSCOMMERCIALSSMALL TRADERS
– Percent of Open Interest Longs:37.639.822.0
– Percent of Open Interest Shorts:27.616.555.3
– Net Position:4,2699,957-14,226
– Gross Longs:16,08617,0129,414
– Gross Shorts:11,8177,05523,640
– Long to Short Ratio:1.4 to 12.4 to 10.4 to 1
NET POSITION TREND:
– COT Index Score (3 Year Range Pct):80.039.426.9
– COT Index Reading (3 Year Range):BullishBearishBearish
NET POSITION MOVEMENT INDEX:
– 6-Week Change in Strength Index:-6.425.5-54.4


CANADIAN DOLLAR:

CANADIAN DOLLAR StatisticsSPECULATORSCOMMERCIALSSMALL TRADERS
– Percent of Open Interest Longs:29.541.628.0
– Percent of Open Interest Shorts:25.562.311.3
– Net Position:6,518-34,05127,533
– Gross Longs:48,46268,22846,055
– Gross Shorts:41,944102,27918,522
– Long to Short Ratio:1.2 to 10.7 to 12.5 to 1
NET POSITION TREND:
– COT Index Score (3 Year Range Pct):60.426.088.3
– COT Index Reading (3 Year Range):BullishBearishBullish-Extreme
NET POSITION MOVEMENT INDEX:
– 6-Week Change in Strength Index:-1.4-0.33.2


AUSTRALIAN DOLLAR:

AUSTRALIAN DOLLAR StatisticsSPECULATORSCOMMERCIALSSMALL TRADERS
– Percent of Open Interest Longs:48.530.920.0
– Percent of Open Interest Shorts:39.644.515.4
– Net Position:12,263-18,6376,374
– Gross Longs:66,60742,45027,517
– Gross Shorts:54,34461,08721,143
– Long to Short Ratio:1.2 to 10.7 to 11.3 to 1
NET POSITION TREND:
– COT Index Score (3 Year Range Pct):95.55.671.1
– COT Index Reading (3 Year Range):Bullish-ExtremeBearish-ExtremeBullish
NET POSITION MOVEMENT INDEX:
– 6-Week Change in Strength Index:16.8-3.7-23.3


NEW ZEALAND DOLLAR:

NEW ZEALAND DOLLAR StatisticsSPECULATORSCOMMERCIALSSMALL TRADERS
– Percent of Open Interest Longs:51.529.814.5
– Percent of Open Interest Shorts:40.546.29.2
– Net Position:4,046-6,0171,971
– Gross Longs:18,94510,9715,351
– Gross Shorts:14,89916,9883,380
– Long to Short Ratio:1.3 to 10.6 to 11.6 to 1
NET POSITION TREND:
– COT Index Score (3 Year Range Pct):66.430.975.3
– COT Index Reading (3 Year Range):BullishBearishBullish
NET POSITION MOVEMENT INDEX:
– 6-Week Change in Strength Index:-13.815.4-19.6


MEXICAN PESO:

MEXICAN PESO StatisticsSPECULATORSCOMMERCIALSSMALL TRADERS
– Percent of Open Interest Longs:42.652.14.7
– Percent of Open Interest Shorts:53.643.12.6
– Net Position:-15,11312,2742,839
– Gross Longs:58,08971,0956,389
– Gross Shorts:73,20258,8213,550
– Long to Short Ratio:0.8 to 11.2 to 11.8 to 1
NET POSITION TREND:
– COT Index Score (3 Year Range Pct):7.292.255.1
– COT Index Reading (3 Year Range):Bearish-ExtremeBullish-ExtremeBullish
NET POSITION MOVEMENT INDEX:
– 6-Week Change in Strength Index:-8.39.0-7.6


BRAZIL REAL:

BRAZIL REAL StatisticsSPECULATORSCOMMERCIALSSMALL TRADERS
– Percent of Open Interest Longs:16.578.04.1
– Percent of Open Interest Shorts:55.039.74.0
– Net Position:-25,30925,21990
– Gross Longs:10,88851,3422,709
– Gross Shorts:36,19726,1232,619
– Long to Short Ratio:0.3 to 12.0 to 11.0 to 1
NET POSITION TREND:
– COT Index Score (3 Year Range Pct):42.959.272.3
– COT Index Reading (3 Year Range):BearishBullishBullish
NET POSITION MOVEMENT INDEX:
– 6-Week Change in Strength Index:-11.713.7-15.6


RUSSIAN RUBLE:

RUSSIAN RUBLE StatisticsSPECULATORSCOMMERCIALSSMALL TRADERS
– Percent of Open Interest Longs:33.160.86.0
– Percent of Open Interest Shorts:10.084.25.7
– Net Position:6,784-6,87288
– Gross Longs:9,71417,8311,746
– Gross Shorts:2,93024,7031,658
– Long to Short Ratio:3.3 to 10.7 to 11.1 to 1
NET POSITION TREND:
– COT Index Score (3 Year Range Pct):29.469.845.6
– COT Index Reading (3 Year Range):BearishBullishBearish
NET POSITION MOVEMENT INDEX:
– 6-Week Change in Strength Index:17.3-15.5-19.1


BITCOIN FUTURES:

BITCOIN StatisticsSPECULATORSCOMMERCIALSSMALL TRADERS
– Percent of Open Interest Longs:60.95.327.8
– Percent of Open Interest Shorts:84.62.27.3
– Net Position:-2,2152951,920
– Gross Longs:5,6764982,596
– Gross Shorts:7,891203676
– Long to Short Ratio:0.7 to 12.5 to 13.8 to 1
NET POSITION TREND:
– COT Index Score (3 Year Range Pct):41.676.252.9
– COT Index Reading (3 Year Range):BearishBullishBullish
NET POSITION MOVEMENT INDEX:
– 6-Week Change in Strength Index:19.119.8-27.3


Article By CountingPips.comReceive our weekly COT Reports by Email

*COT Report: The COT data, released weekly to the public each Friday, is updated through the most recent Tuesday (data is 3 days old) and shows a quick view of how large speculators or non-commercials (for-profit traders) were positioned in the futures markets.

The CFTC categorizes trader positions according to commercial hedgers (traders who use futures contracts for hedging as part of the business), non-commercials (large traders who speculate to realize trading profits) and nonreportable traders (usually small traders/speculators).

Find CFTC criteria here: (http://www.cftc.gov/MarketReports/CommitmentsofTraders/ExplanatoryNotes/index.htm).

Intraday Market Analysis – Rally Overheated

By Orbex

USDCHF sees rally over-stretched

usdchf

The US dollar tanked after an increase in US jobless claims tempered market optimism. The pair has met stiff selling pressure at 0.9470 since last July.

The RSI has repeatedly ventured into the overbought area and suggested that the rally could have overextended itself.

0.9400 is the immediate support and a bearish breakout could trigger a broader sell-off to 0.9350. Below that, a deeper pullback may lead the price action towards the medium-term support level at 0.9220 on the daily chart.

AUDUSD bounces back to resistance

audusd

The Aussie has found support from better-than-expected retail sales of -0.8% versus a consensus of -1.1%.

Following the pair’s fall below the daily trendline and the key floor at 0.7580, the market has turned into a consolidation mood.

An oversold RSI has triggered some short-covering, but the current rebound may attract more sellers in the supply zone around 0.7660.

A bullish breakout could raise offers to 0.7750. Failing that, the price action would remain in a downward trajectory and test 0.7530 once again.

EURNZD looks for Fibonacci support

eurnzd

The euro is struggling to keep its balance between upbeat PMI and new lockdowns.

The pair has been trying to rebound from last March’s bottom near 1.6330. After establishing a base around 1.65 the price action has surged with solid momentum.

The current retracement is testing the 50% Fibonacci level (1.6730). A deeper correction would test the 61.8% level.

1.6890 is a critical resistance on the upside, and if buyers succeed in clearing the way the euro could extend the rally above the psychological level of 1.7.

By Orbex

Fibonacci Retracements Analysis 02.04.2021 (AUDUSD, USDCAD)

Article By RoboForex.com

AUDUSD, “Australian Dollar vs US Dollar”

As we can see in the H4 chart, the “bearish” correctional wave has failed to reach 50.0% fibo at 0.7500 for the second time. At the same time, there was a new convergence on MACD to indicate another ascending correctional movement, which may later transform into a proper rising wave to reach the high at 0.8007 and the post-correctional extension area between 138.2% and 161.8% fibo at 0.8175 and 0.8281 respectively. Otherwise, the instrument may continue its mid-term decline towards 50.0% and 61.8% fibo at 0.7500 and 0.7380 respectively.

AUDUSD_H4
Risk Warning: the result of previous trading operations do not guarantee the same results in the future

The H1 chart shows a more detailed structure of the current ascending correction after a convergence with the targets at 23.6%, 38.2%, 50.0%, 61.8%, and 76.0% fibo at 0.7644, 0.7714, 0.7769, 0.7826, and 0.7893 respectively. A breakout of the support at 0.7532 will lead to a further mid-term downtrend.

AUDUSD_H1
Risk Warning: the result of previous trading operations do not guarantee the same results in the future

USDCAD, “US Dollar vs Canadian Dollar”

In the H4 chart, USDCAD is correcting downwards after completing the first wave to the upside and reaching 50.0% fibo. Later, the pair may soon resume growing towards 61.8% and 76.0% fibo at 1.2683 and 1.2757 respectively. The support remains at the low at 1.2365.

USDCAD_H4
Risk Warning: the result of previous trading operations do not guarantee the same results in the future

The H1 chart shows a bearish trend, which has already reached 38.2% fibo and may later continue towards 50.0% and 61.8% fibo at 1.2506 and 1.2473 respectively. The resistance is the high at 1.2647.

USDCAD_H1

Article By RoboForex.com

Attention!
Forecasts presented in this section only reflect the author’s private opinion and should not be considered as guidance for trading. RoboForex LP bears no responsibility for trading results based on trading recommendations described in these analytical reviews.

Ichimoku Cloud Analysis 02.04.2021 (GBPNZD, USDJPY, NZDUSD)

Article By RoboForex.com

GBPNZD, “Great Britain Pound vs New Zealand Dollar”

GBPNZD is trading at 1.9684; the instrument is moving above Ichimoku Cloud, thus indicating an ascending tendency. The markets could indicate that the price may test the cloud’s upside border at 1.9665 and then resume moving upwards to reach 1.9975. Another signal in favor of a further uptrend will be a rebound from the downside border of the Triangle pattern. However, the bullish scenario may no longer be valid if the price breaks the cloud’s downside border and fixes below 1.9425. In this case, the pair may continue falling towards 1.9335. To confirm further growth, the asset must break the pattern’s upside border and fix above below 1.9830.

GBPNZD
Risk Warning: the result of previous trading operations do not guarantee the same results in the future

USDJPY, “US Dollar vs Japanese Yen”

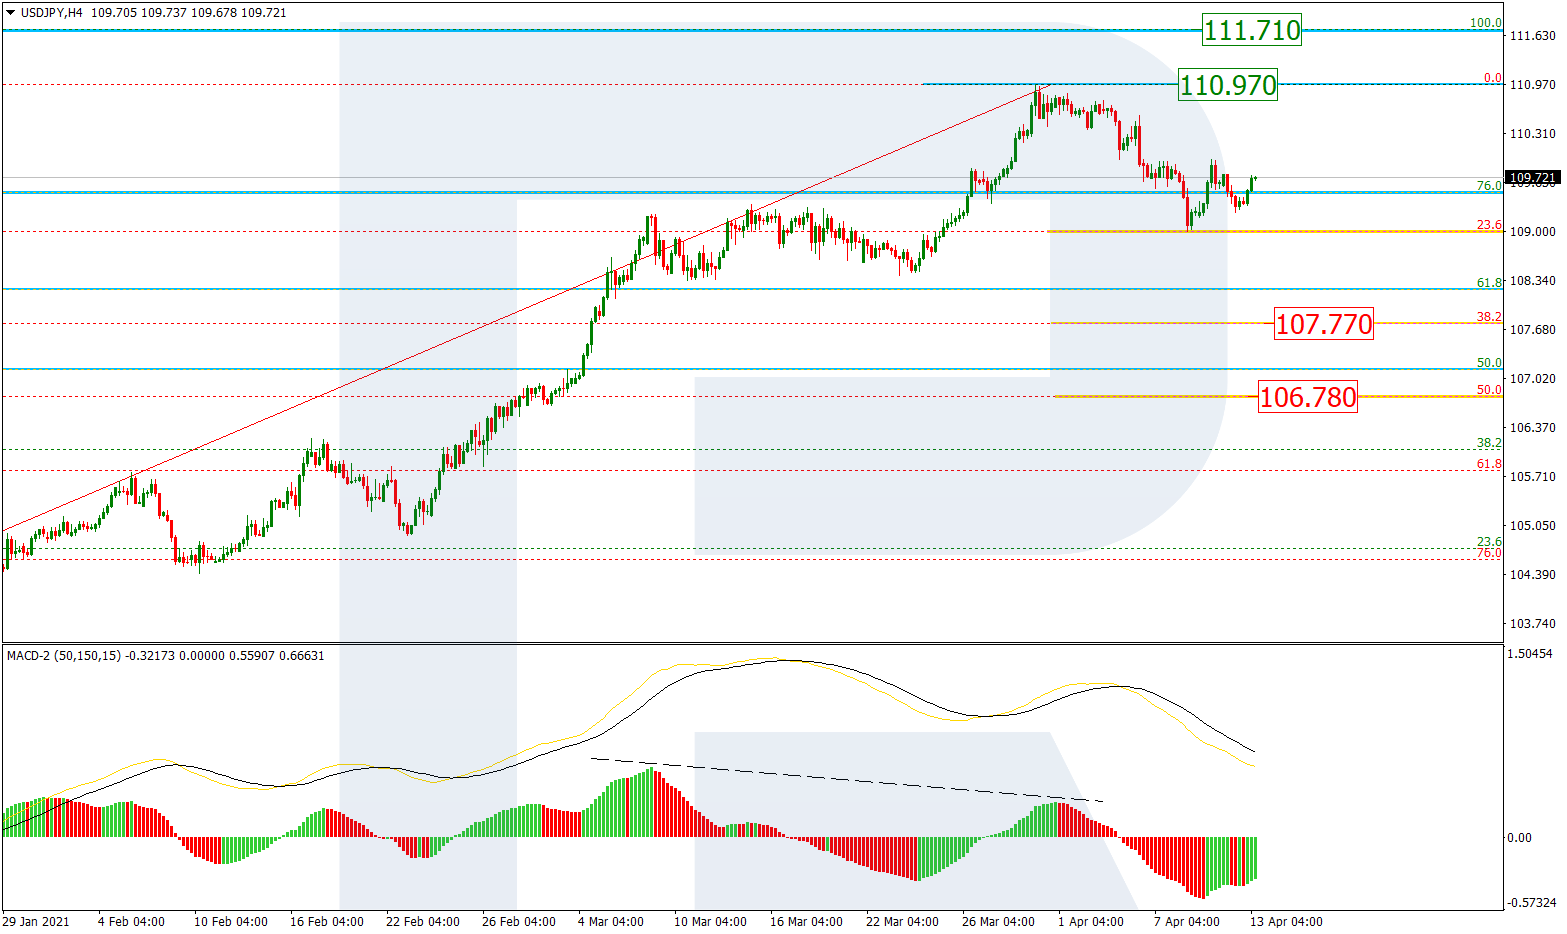
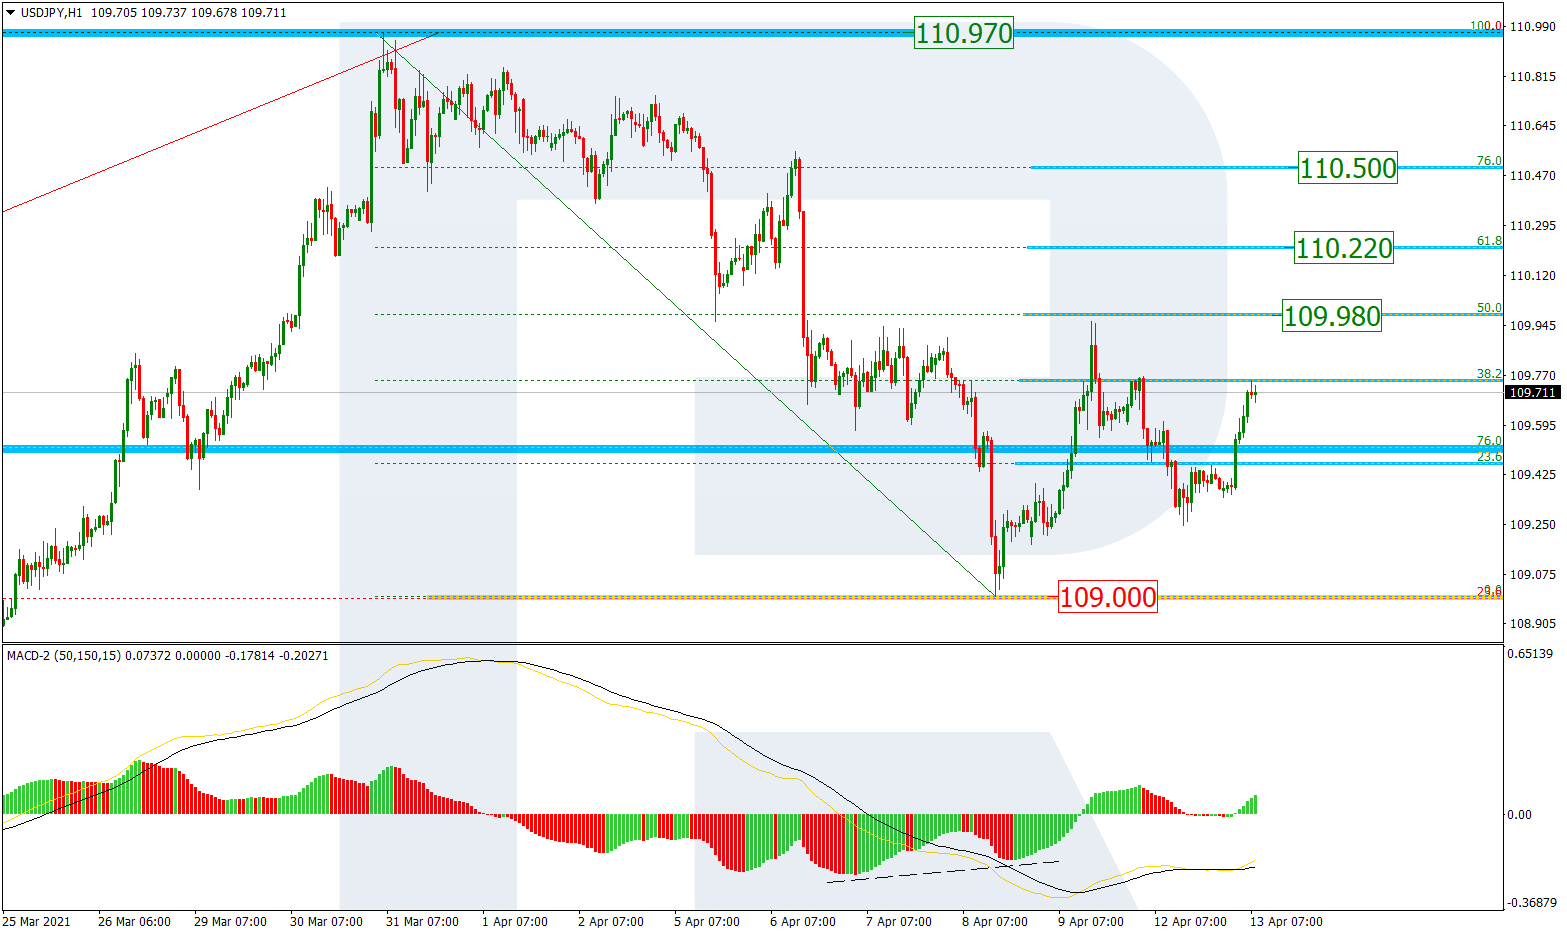
USDJPY is trading at 110.51; the instrument is moving above Ichimoku Cloud, thus indicating an ascending tendency. The markets could indicate that the price may test the cloud’s upside border at 109.80 and then resume moving upwards to reach 111.80. Another signal in favor of a further uptrend will be a rebound from the support level. However, the bullish scenario may no longer be valid if the price breaks the cloud’s downside border and fixes below 108.75. In this case, the pair may continue falling towards 107.85.

USDJPY
Risk Warning: the result of previous trading operations do not guarantee the same results in the future

NZDUSD, “New Zealand Dollar vs US Dollar”

NZDUSD is trading at 0.7030; the instrument is moving inside Ichimoku Cloud, thus indicating a sideways tendency. The markets could indicate that the price may test the cloud’s upside border at 0.7060 and then resume moving downwards to reach 0.6845. Another signal in favor of a further downtrend will be a rebound from the descending channel’s upside border. However, the bearish scenario may be canceled if the price breaks the cloud’s upside border and fixes above 0.7135. In this case, the pair may continue growing towards 0.7225. To confirm further decline, the asset must break the rising channel’s downside border and fix below 0.6935.

NZDUSD

Article By RoboForex.com

Attention!
Forecasts presented in this section only reflect the author’s private opinion and should not be considered as guidance for trading. RoboForex LP bears no responsibility for trading results based on trading recommendations described in these analytical reviews.