
Article By RoboForex.com
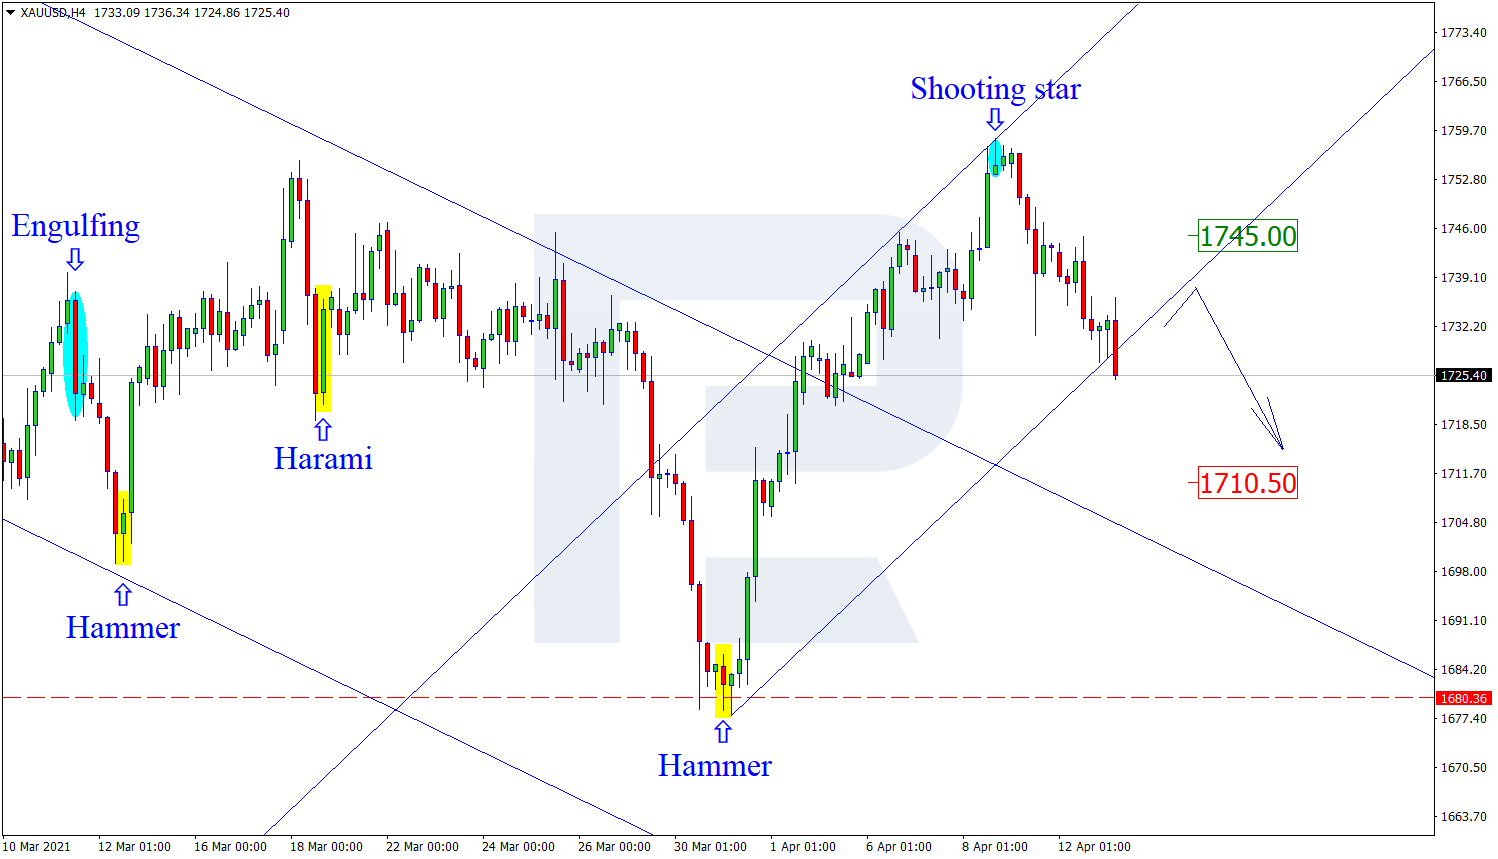
XAUUSD, “Gold vs US Dollar”
As we can see in the H4 chart, the ascending tendency continues. After forming several reversal patterns, such as Shooting Star, close to the resistance level, XAUUSD may reverse and start a new pullback towards the support area. In this case, the correctional target may be at 1710.50. At the same time, an opposite scenario implies that the price may continue growing to reach 1745.00 without testing the support level.

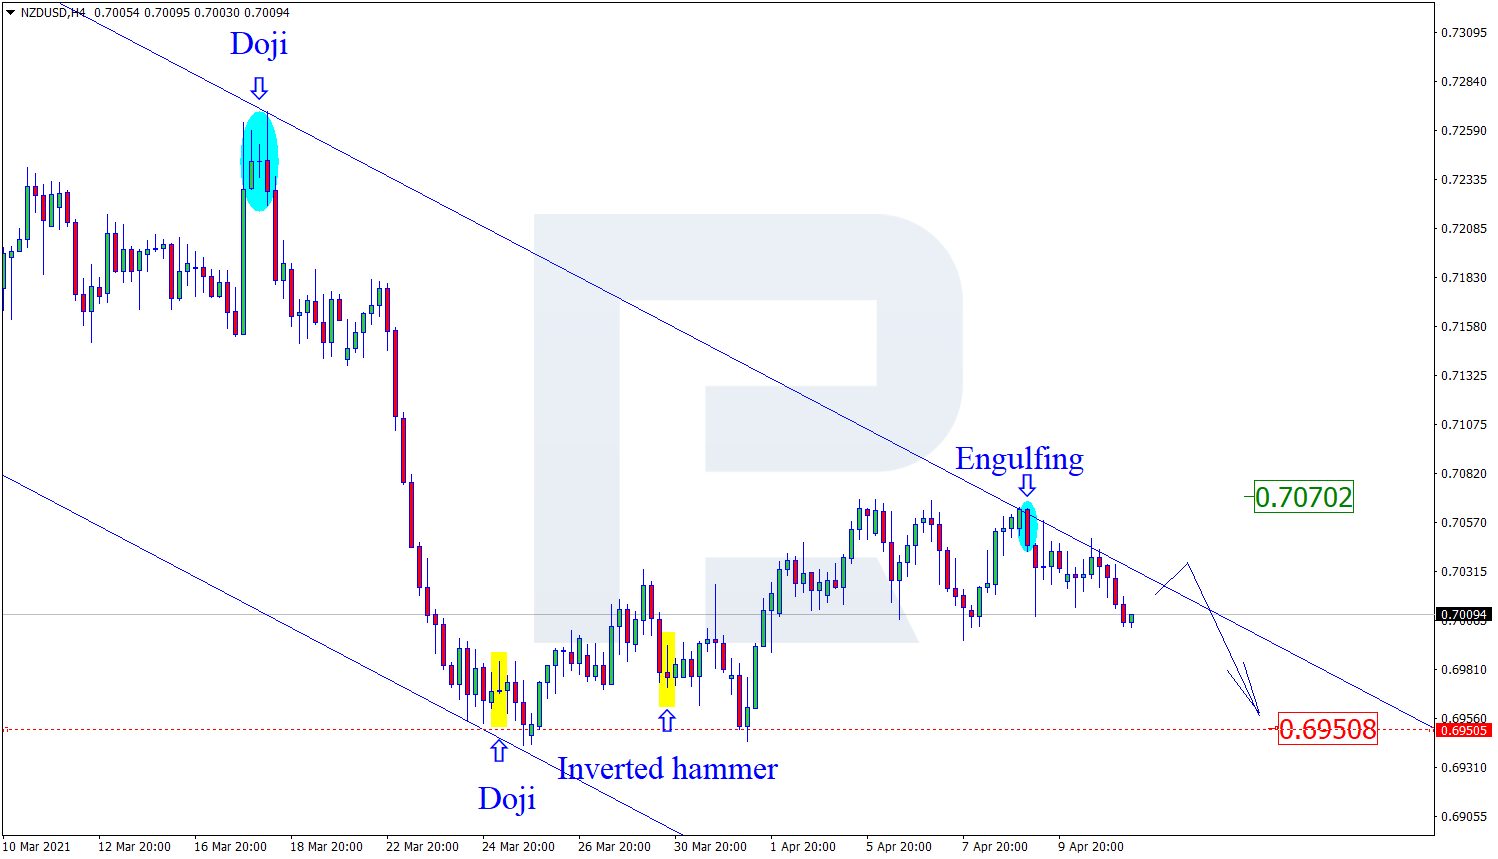
NZDUSD, “New Zealand vs US Dollar”
As we can see in the H4 chart, the pair is still moving sideways. By now, NZDUSD has formed several reversal patterns, such as Engulfing, close to the resistance level. The next downside target may be at 0.6950. Later, the price may test the support area, break it, and continue moving downwards. However, an alternative scenario implies that the price may grow towards 0.7070 before resuming its decline.
Free Reports:
 Get our Weekly Commitment of Traders Reports - See where the biggest traders (Hedge Funds and Commercial Hedgers) are positioned in the futures markets on a weekly basis.
 Download Our Metatrader 4 Indicators – Put Our Free MetaTrader 4 Custom Indicators on your charts when you join our Weekly Newsletter
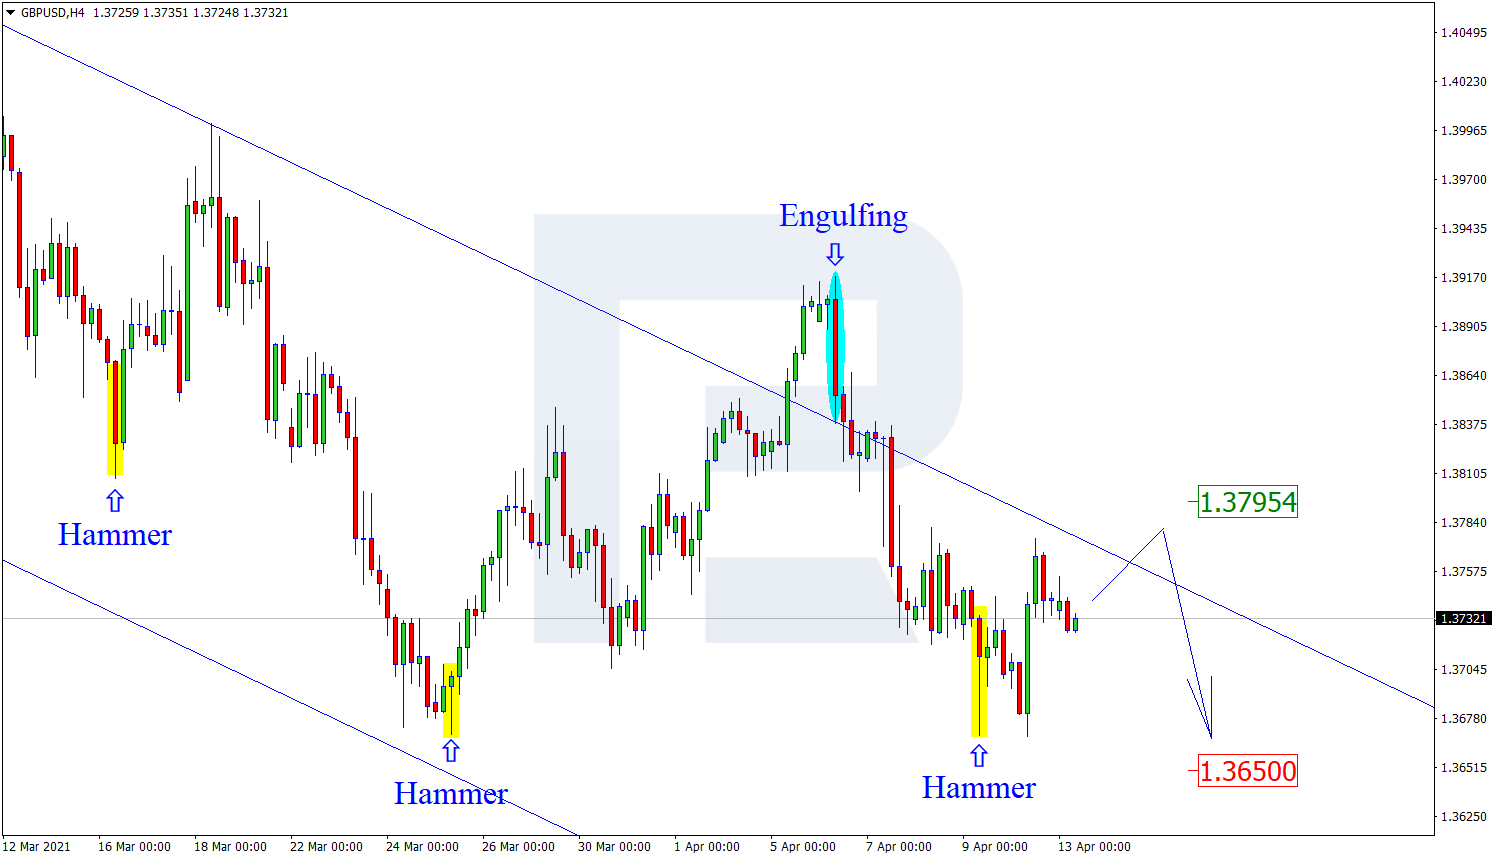
GBPUSD, “Great Britain Pound vs US Dollar”
As we can see in the H4 chart, the asset is forming another correction within the descending tendency. By now, GBPUSD has formed several reversal patterns, such as Hammer, not far from the support area. At the moment, the pair may reverse and resume growing. In this case, the upside target may be at 1.3795. After that, the instrument may rebound from the resistance area and resume the descending tendency. Still, there might be an alternative scenario, according to which the asset may continue falling towards 1.3650 without testing the resistance area.
Article By RoboForex.com
Attention!
Forecasts presented in this section only reflect the author’s private opinion and should not be considered as guidance for trading. RoboForex LP bears no responsibility for trading results based on trading recommendations described in these analytical reviews.

- The US introduces new import tariffs for 60 countries. Brent crude surpasses $100 per barrel Jul 24, 2026
- USD/JPY Breaks Records: Nothing Slows the Yen’s Decline Jul 24, 2026
- Oil prices reached a 6‑week high. The AUD strengthened on the back of a strong labor‑market report Jul 23, 2026
- EUR/USD Recovers as Dollar Weakens Jul 23, 2026
- Bitcoin rose to $66,000. The New Zealand dollar continues to strengthen Jul 22, 2026
- Inflationary pressure is easing in Canada. In New Zealand, on the contrary, inflation is rising Jul 21, 2026
- GBP/USD Falls After Cabinet Changes Jul 21, 2026
- Geopolitical and macroeconomic conditions continue to pressure market sentiment Jul 20, 2026
- USD/JPY Poised to Continue Gains as Expensive Oil and Lack of Support Weigh on Yen Jul 20, 2026
- COT Metals Charts: Weekly Speculator Bets led by Copper & Steel Jul 18, 2026