by JustForex
The EUR/USD currency pair
- Prev Open: 1.2179
- Prev Close: 1.2216
- % chg. over the last day: +0.30%
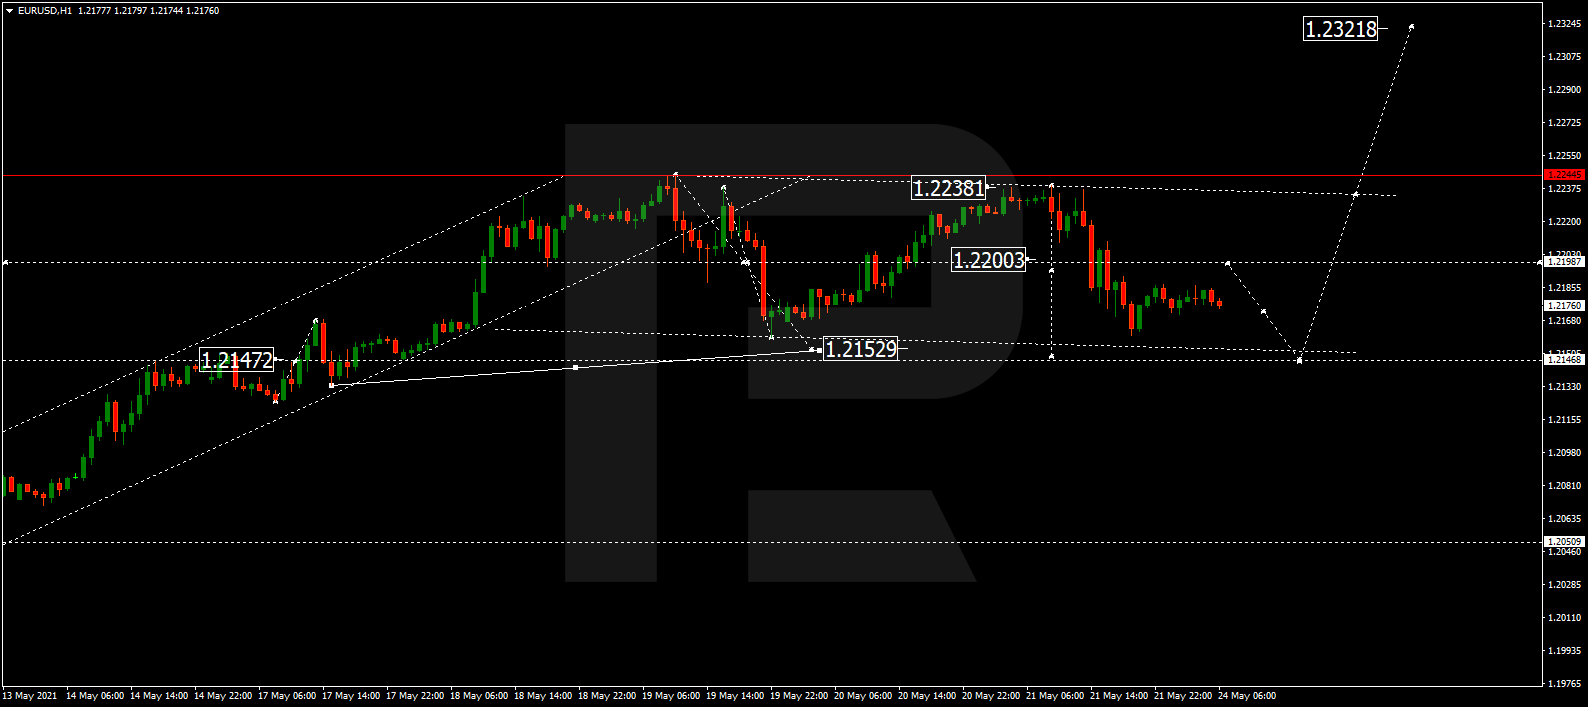
The situation with the EUR/USD currency pair has not changed much. The price is trading in a wide flat with the range of 1.2168-1.2243. The US Treasury Department is planning a Treasury bond redemption today, which may ultimately affect the weakening of the dollar index and the strengthening of the European currency.
- Support levels: 1.2168, 1.2138, 1.2115, 1.2074, 1.2026, 1.2002, 1.1957
- Resistance levels: 1.2243
The trend is still bullish. The price is above the change priority level of 1.2138. At the moment, the price is in front of the upper border of the corridor, but the MACD indicator is not active. Under such market conditions, traders can look for both buying from the lower border of the corridor and selling from the upper border of the flat range.
Alternative scenario: if the price breaks through the 1.2138 support level and fixes below, the general uptrend is likely to be broken.

- – German Business Climate (m/m) at 11:00 (GMT+3);
- – US CB Consumer Confidence (m/m) at 17:00 (GMT+3).
The GBP/USD currency pair
- Prev Open: 1.4147
- Prev Close: 1.4153
- % chg. over the last day: +0.04%
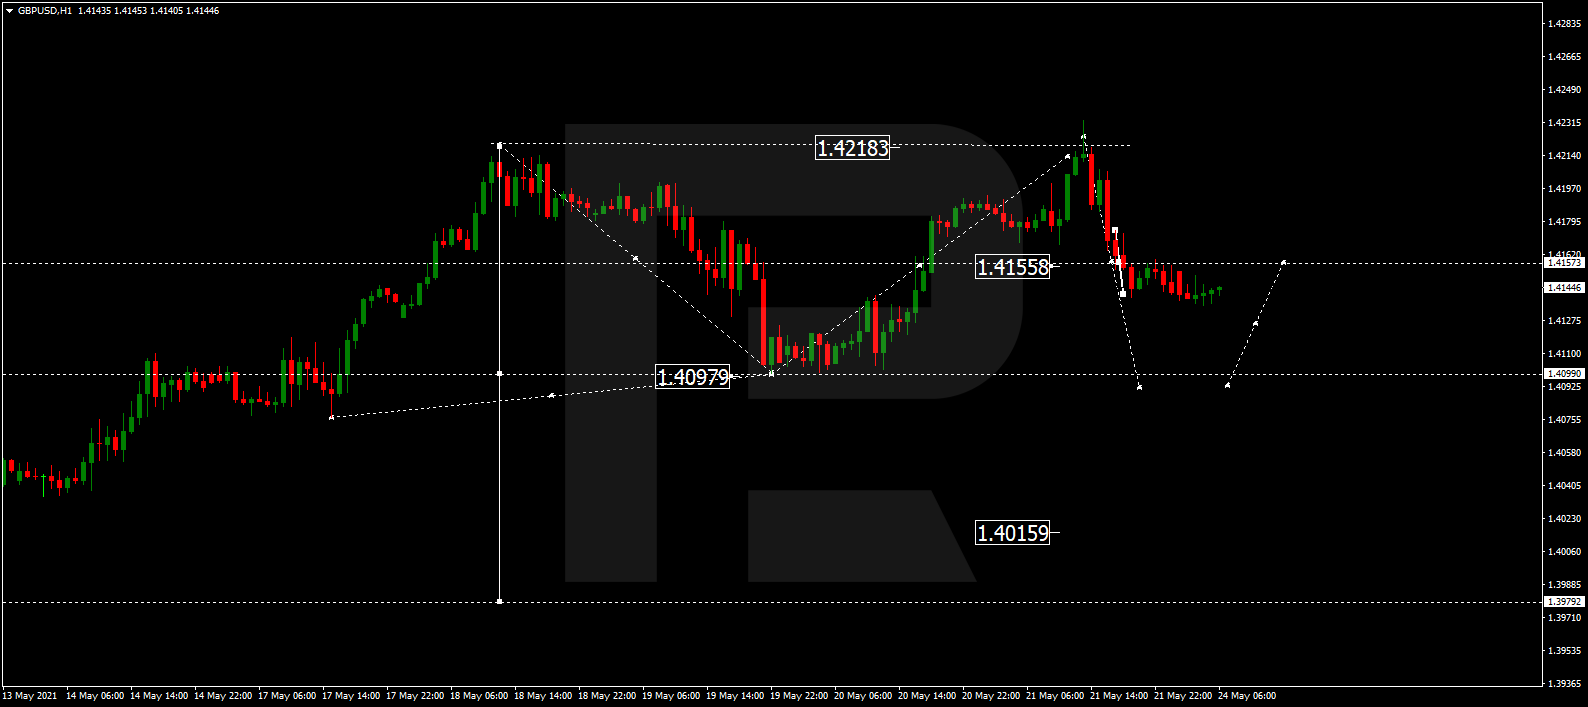
At the moment, the British pound is strongly correlated with the euro. The situation with the GBP/USD currency pair is symmetrical to EUR/USD. The price is trading in the middle of a wide flat with a range of 1.4110-1.4207. Business activity statistics in Britain are positive, so investors expect the continuation of the uptrend.
- Support levels: 1.4110, 1.4075, 1.3996, 1.3913,1.3835, 1.3801, 1.3756, 1.3690
- Resistance levels: 1.4207
The trend remains bullish. The price is above the moving average. The MACD indicator has become inactive. It is recommended for traders to look for long positions from the lower border of the range or look for sell positions from the resistance level of 1.4207, where sellers hold the defense well.
Alternative scenario: if the price breaks through the 1.4075 support level and consolidates below, the bullish scenario is likely to be canceled.

The USD/JPY currency pair
- Prev Open: 108.88
- Prev Close: 108.76
- % chg. over the last day: -0.11%
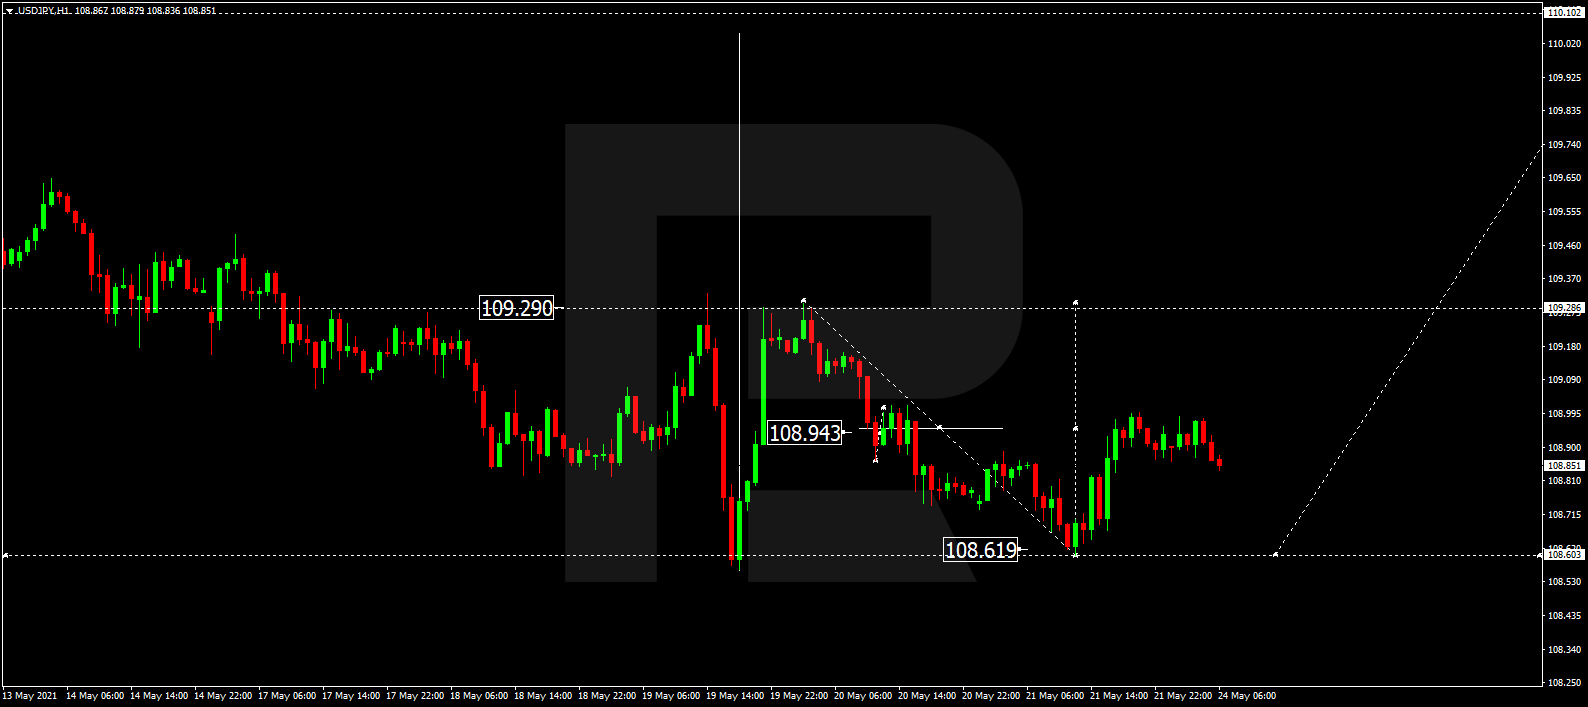
The psychological resistance level of 109 along with the moving line pushed the price lower. The price is slowly descending towards the nearest support level. If the dollar index continues to fall, the price of USD/JPY will also go down. However, the macro statistics on business activity in Japan are still very weak.
- Support levels: 108.66, 108.44, 108.19, 107.77, 107.47, 107.04
- Resistance levels: 109.00, 109.40, 109.64, 109.95, 110.51
On the H1 timeframe, the trend remains bearish, and the price is trading below the moving average. The MACD indicator is still inactive. Under such market conditions, traders are better to look for sell positions from the resistance levels. It is also possible to consider long positions, but only within an uptrend on the lower timeframes.
Alternative scenario: if the price rises above 109.40, the general uptrend is likely to resume.

The USD/CAD currency pair
- Prev Open: 1.2064
- Prev Close: 1.2043
- % chg. over the last day: -0.17%
The USD/CAD currency pair has formed a narrow flat, with sellers slowly moving the price lower to the support level of 1.2048. Considering the background of the dollar index fall, the downtrend may strengthen again.
- Support levels: 1.2048, 1.1944
- Resistance levels: 1.2093, 1.2137, 1.2251, 1.2321, 1.2388, 1.2414, 1.2519
The price is trading below the moving average, and the trend remains bearish. However, there are signs of divergence on the MACD indicator. At the moment, the best strategy for the USD/CAD currency pair is to wait. It is possible to sell within the trend, if the price consolidates below the support level of 1.2048 again. It is too early to look for long positions, since there is no significant initiative from the buyers.
Alternative scenario: if the price breaks out through the 1.2137 resistance level and fixes above, a local corrective uptrend is likely to form.

by JustForex
This article reflects a personal opinion and should not be interpreted as an investment advice, and/or offer, and/or a persistent request for carrying out financial transactions, and/or a guarantee, and/or a forecast of future events.