by JustForex
The EUR/USD currency pair
- Prev Open: 1.2249
- Prev Close: 1.2192
- % chg. over the last day: -0.46%
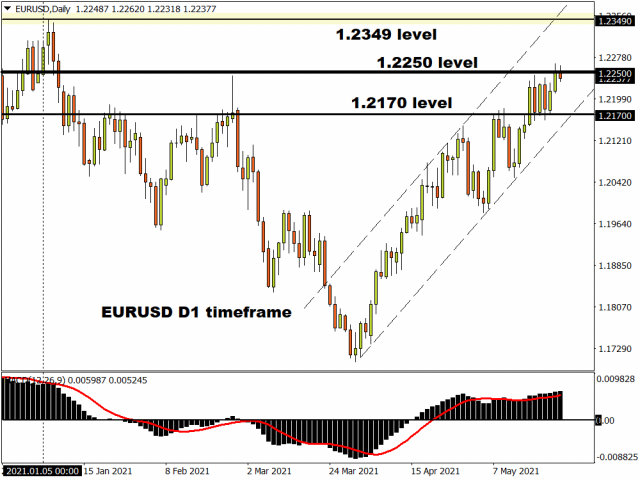
On Wednesday, the EUR/USD currency pair decreased by 0.46% and went back to a wide flat. A strong deviation from the average line played a key role. But the fundamental picture is not in favor of the US dollar, so investors are likely to redeem this corrective movement.
- Support levels: 1.2168, 1.2138, 1.2115, 1.2074, 1.2026, 1.2002, 1.1957
- Resistance levels: 1.2243, 1.2311
The trend is still bullish. The price is above the priority change level of 1.2168. The MACD indicator has shifted into the negative zone. Under such market conditions, it is better for traders to focus on long positions from the support levels.
Alternative scenario: if the price breaks down through the 1.2168 support level and fixes below, the general uptrend is likely to be broken.

- – US Prelim GDP (q/q) at 15:30 (GMT+3);
- – US Unemployment Claims (w/w) at 15:30 (GMT+3);
- – US Home Sales (m/m) at 17:00 (GMT+3).
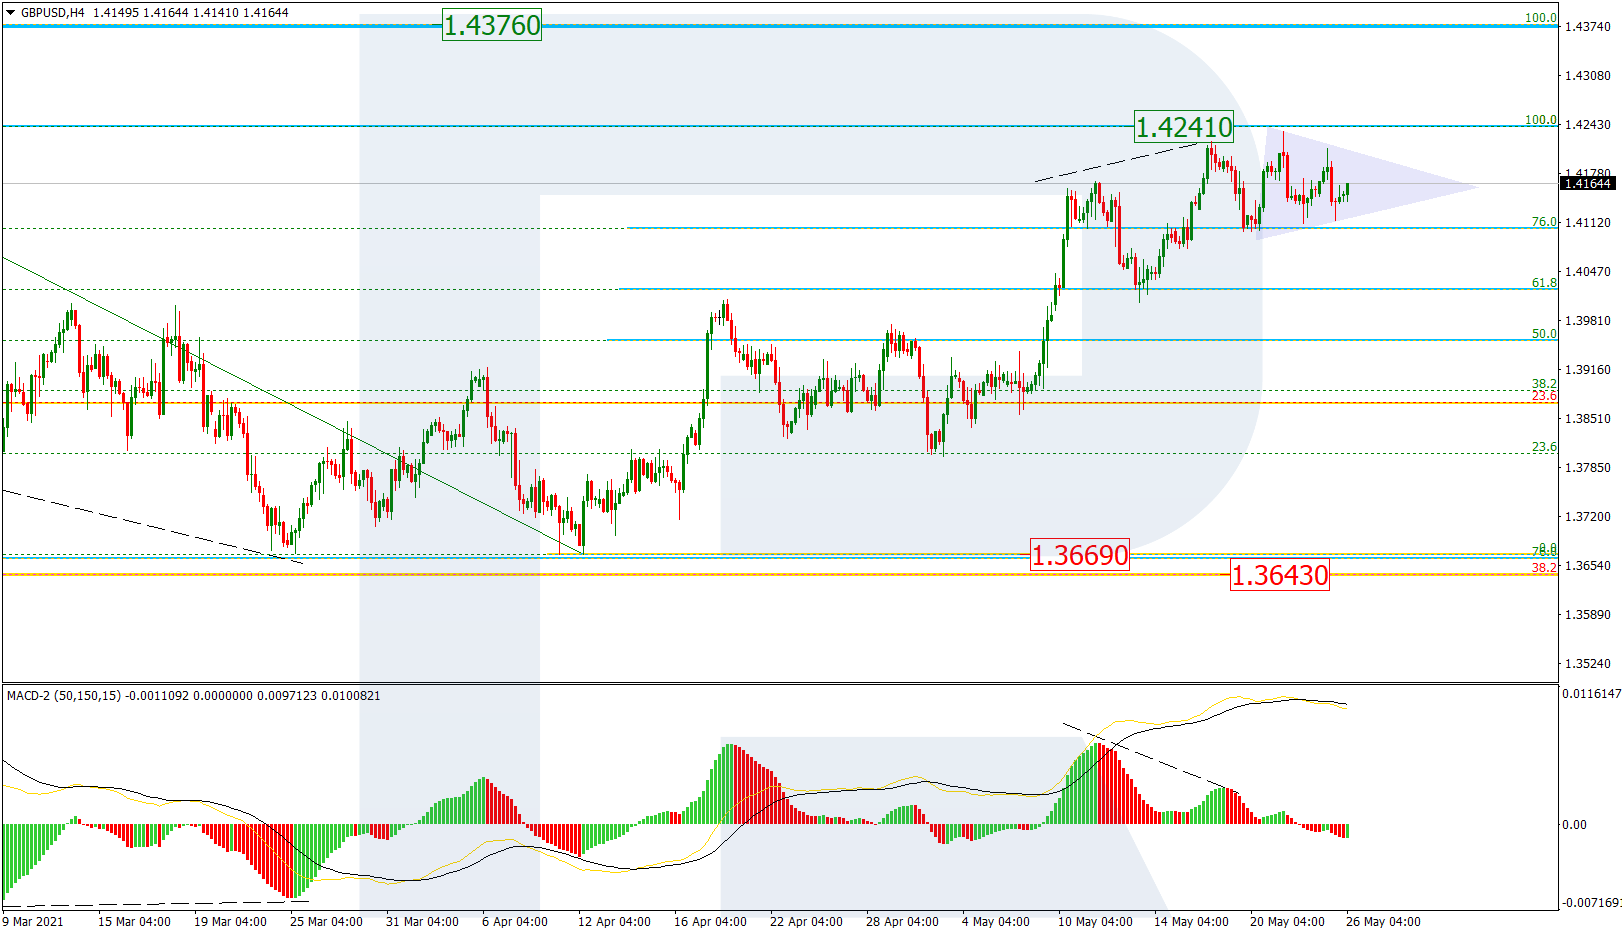
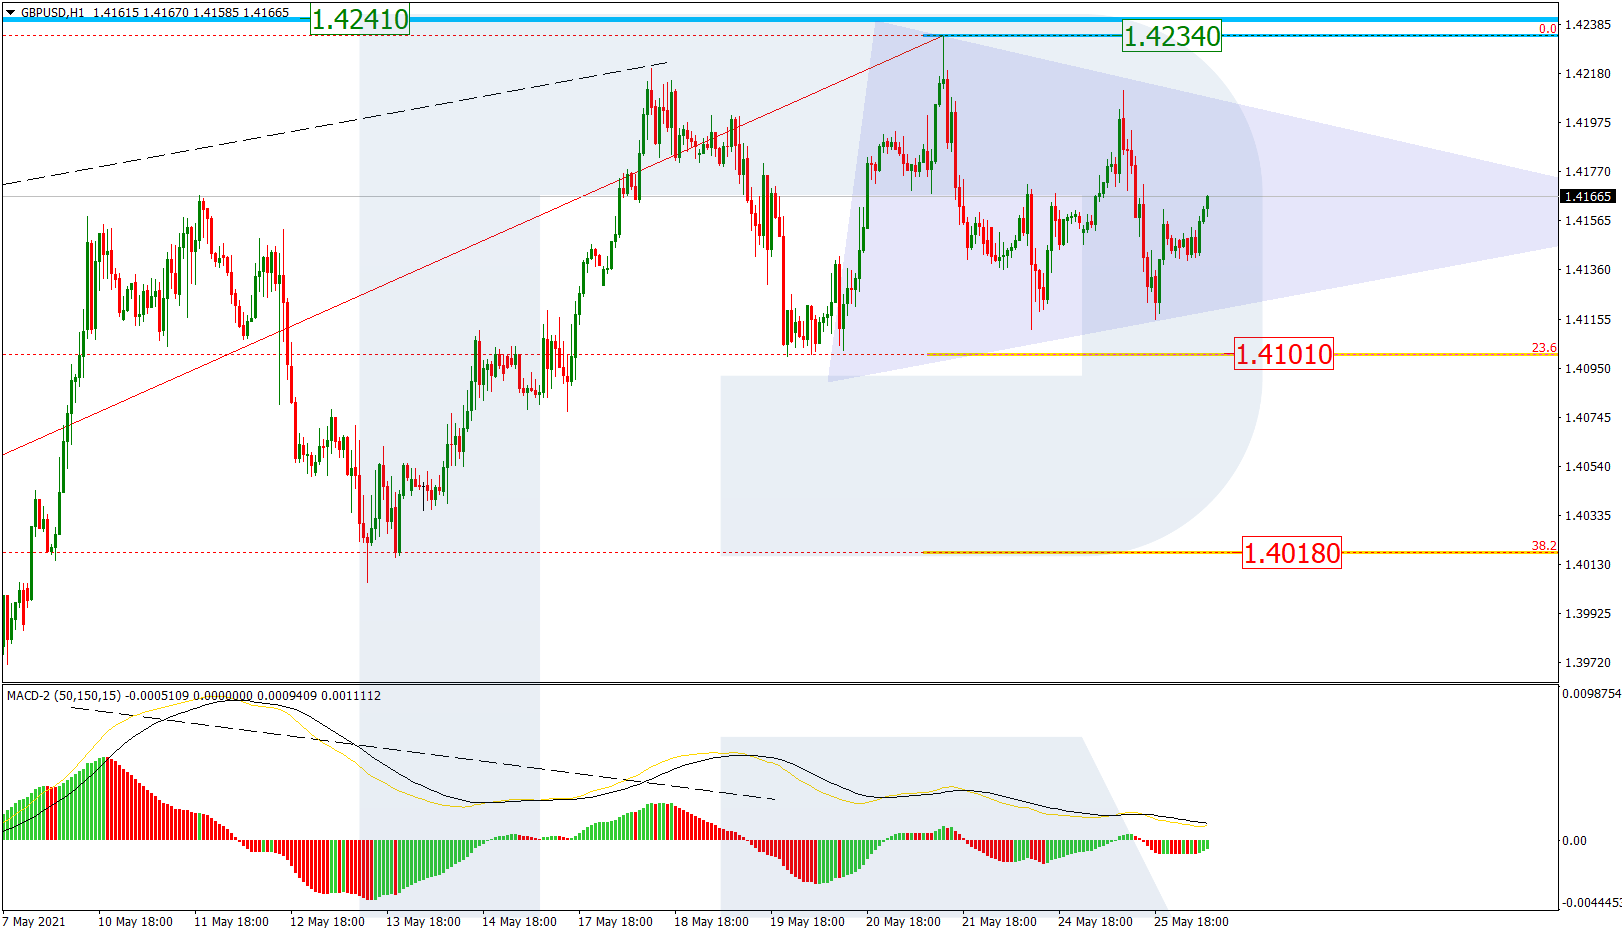
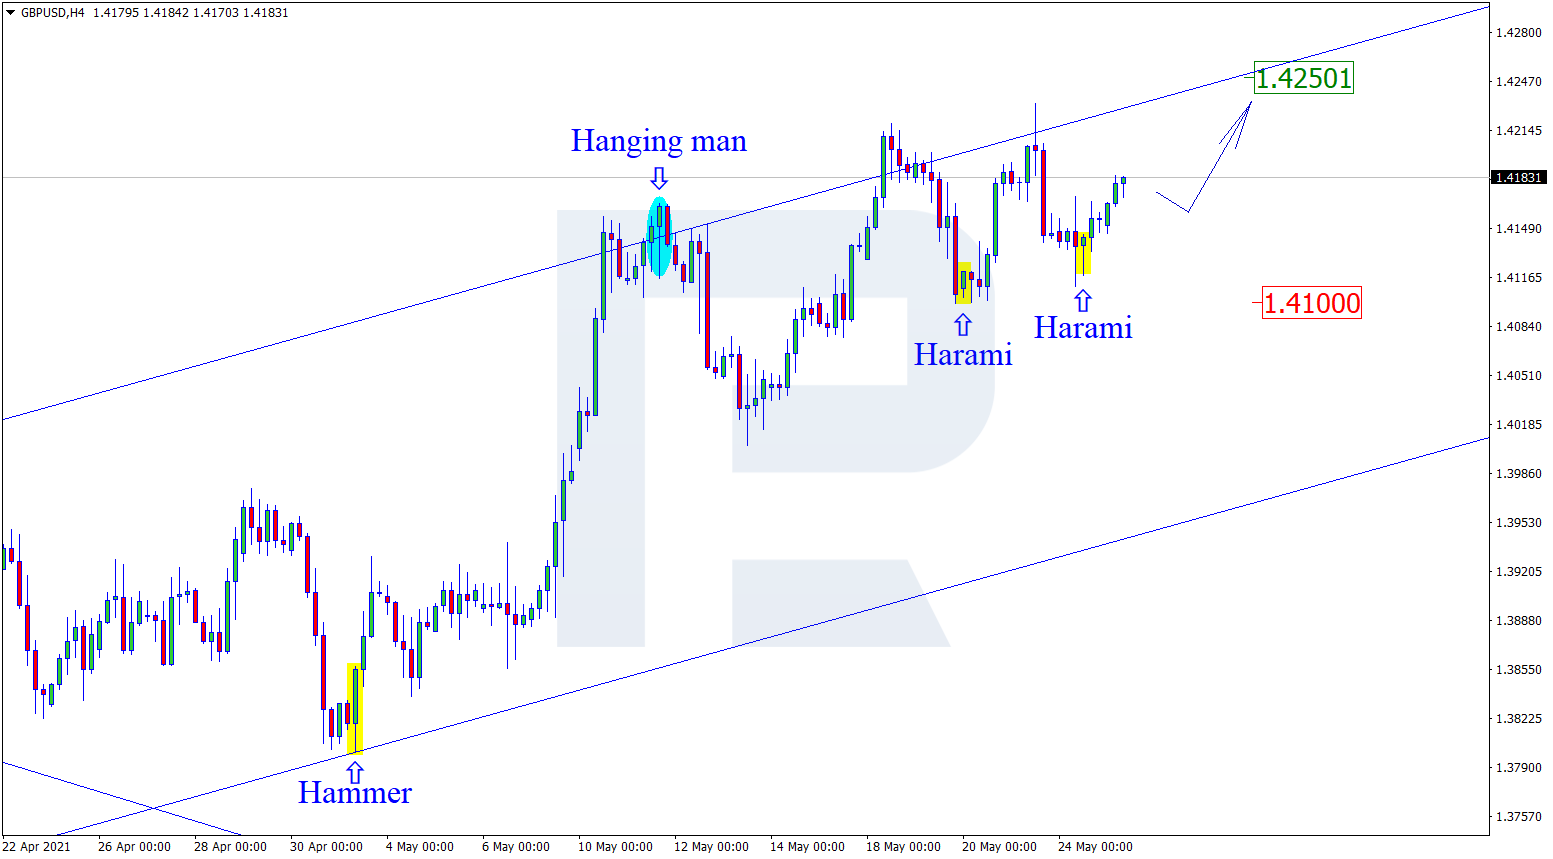
The GBP/USD currency pair
- Prev Open: 1.4148
- Prev Close: 1.4116
- % chg. over the last day: -0.22%
The British pound is still trading inside a wide flat with a range of 1.4110-1.4207. At the moment, the price decreased to the lower border of the corridor, but there was no significant reaction from the buyers.
- Support levels: 1.4110, 1.4075, 1.3996, 1.3913,1.3835, 1.3801, 1.3756, 1.3690
- Resistance levels: 1.4207
Despite the fact that the price is below the moving average and the MACD indicator is below zero, the trend remains bullish, because the price is above the priority change level of 1.4075. Traders are advised to look for long trades from the lower border of the range, but only after buyers show strong initiative.
Alternative scenario: if the price breaks down through the 1.4075 support level and consolidates below, the bullish scenario is likely to be canceled.

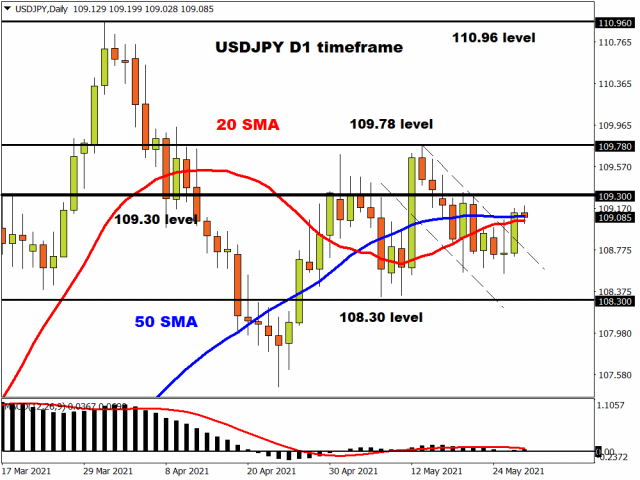
The USD/JPY currency pair
- Prev Open: 108.74
- Prev Close: 109.14
- % chg. over the last day: +0.37%
On Wednesday, the USD/JPY currency pair broke through and held above the 109.00 upper level of the range, increasing the probability of changing the priority on the H1 timeframe. However, the fundamental indicators play against the dollar index, and considering the high correlation between the US dollar and the Japanese yen, investors expect a further decline in the price.
- Support levels: 109.00, 108.66, 108.44, 108.19, 107.77, 107.47, 107.04
- Resistance levels: 109.32, 109.64, 109.95, 110.51
On the H1 timeframe, the trend remains bearish, but the buyers are much more aggressive, so this correction movement may turn into a full trend reversal. Under such market conditions, traders can look for both selling from the resistance levels and buying from the support levels. A test of the 109.00 psychological level is very likely.
Alternative scenario: if the price rises above 109.32, the general uptrend is likely to resume.

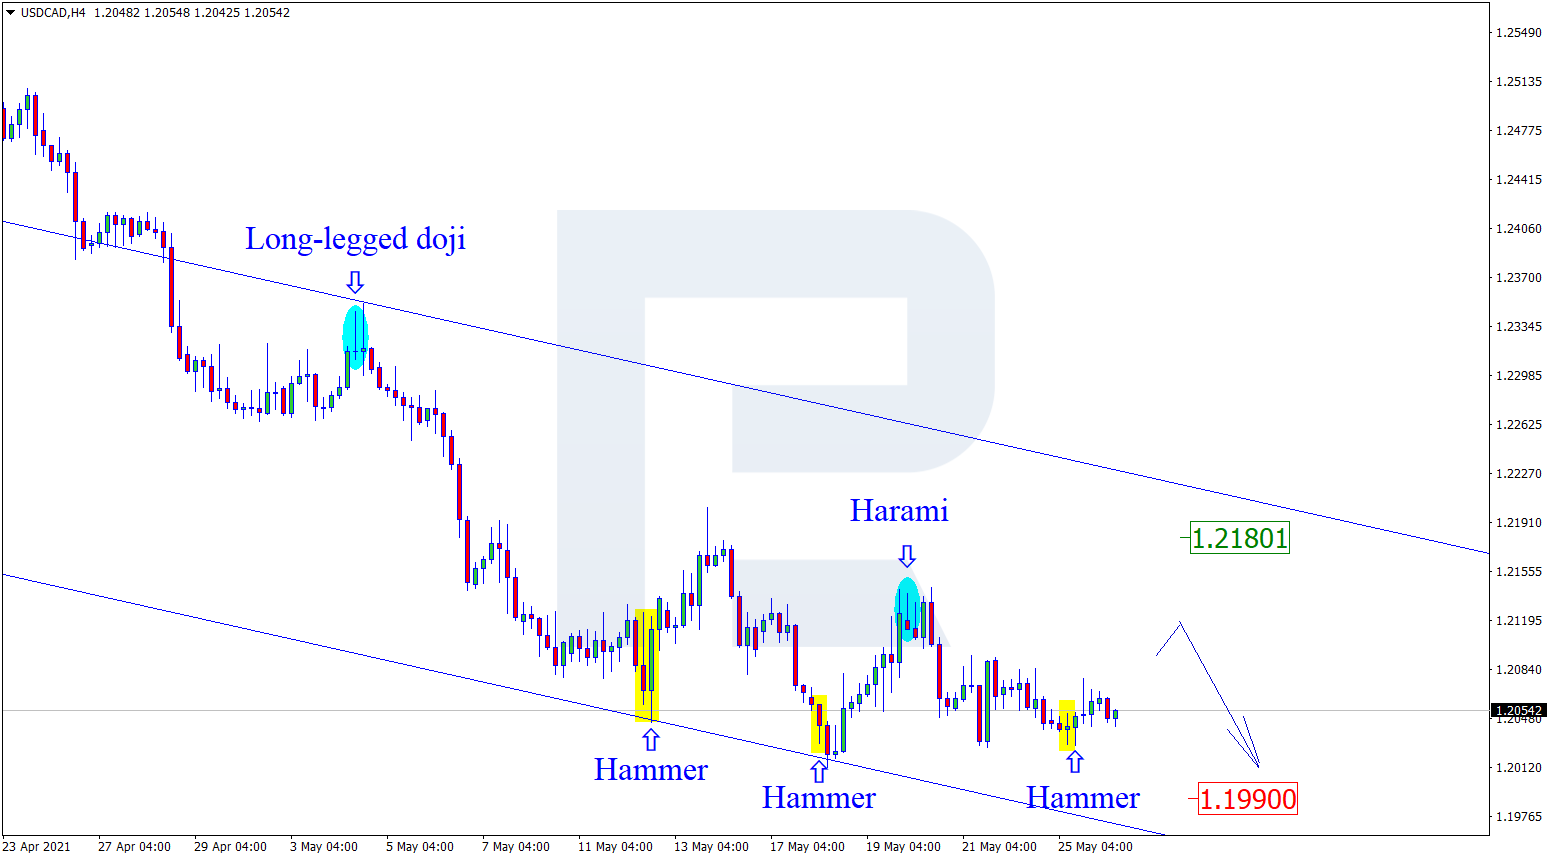
The USD/CAD currency pair
- Prev Open: 1.2065
- Prev Close: 1.2124
- % chg. over the last day: +0.49%
The USD/CAD currency pair rose by 0.49% by the end of Wednesday. The price broke out of the range and tested the priority change level of 1.2137. The movement was impulsive, and the price held above the moving average.
- Support levels: 1.2093, 1.2032, 1.1944
- Resistance levels: 1.2137, 1.2251, 1.2321, 1.2388, 1.2414, 1.2519
At the moment, the price is trading above the moving average, the MACD indicator is in the positive zone, but the price is still below the priority change level of 1.2137. Under such market conditions, traders can work both sides. As the buyer’s pressure is stronger now, it is better to sell from the resistance level after additional confirmations.
Alternative scenario: if the price breaks out through the 1.2137 resistance level and fixes above, a local corrective uptrend is likely to form.

by JustForex
This article reflects a personal opinion and should not be interpreted as an investment advice, and/or offer, and/or a persistent request for carrying out financial transactions, and/or a guarantee, and/or a forecast of future events.