
Article By RoboForex.com
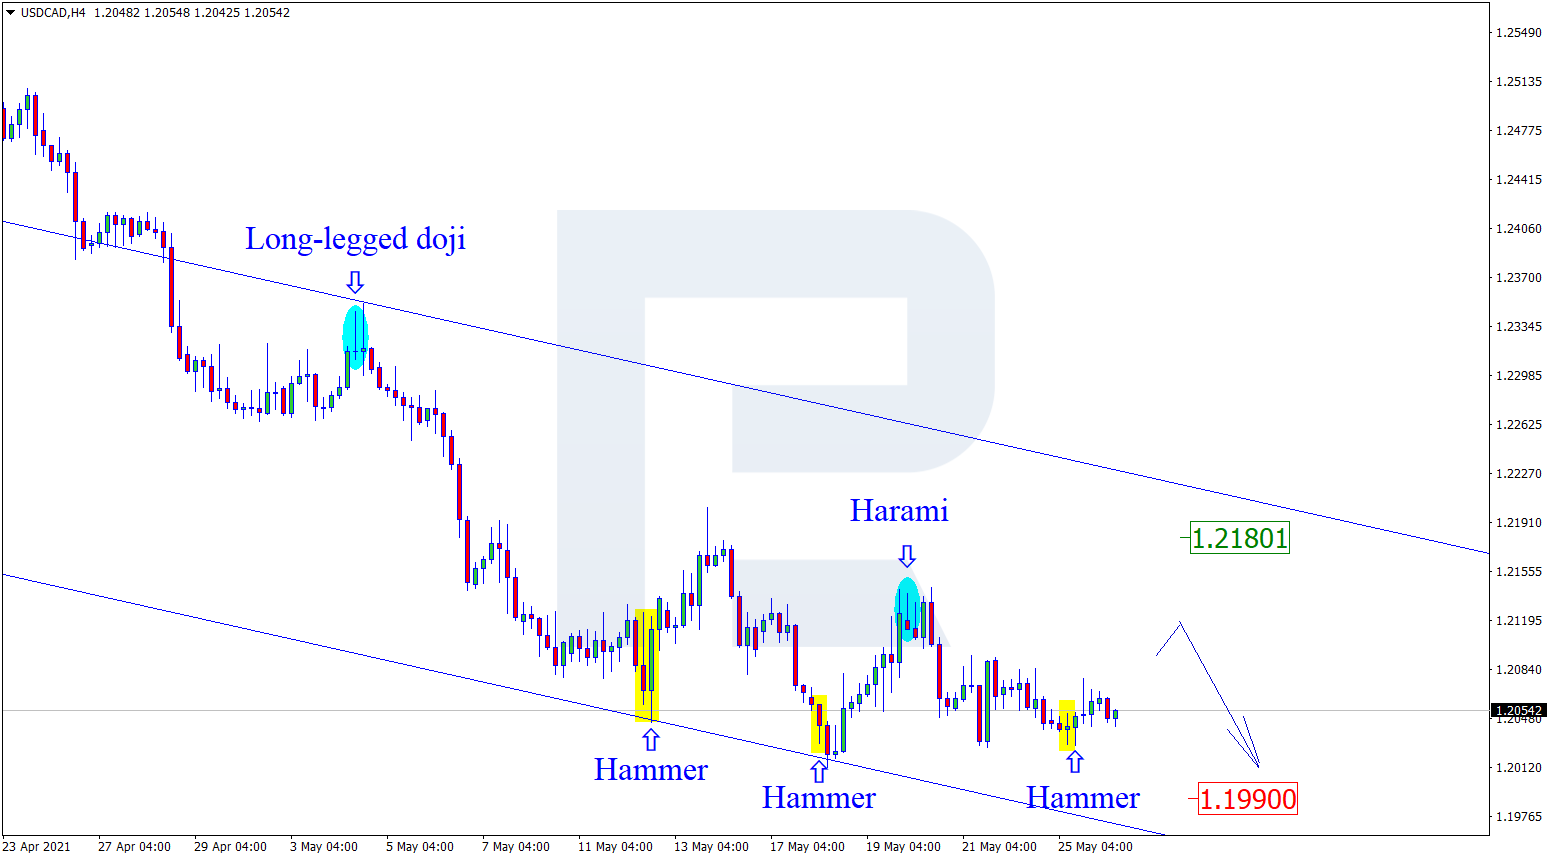
USDCAD, “US Dollar vs Canadian Dollar”
As we can see in the H4 chart, the sideways tendency continues. After forming several reversal patterns, including Hammer, close to the support area, USDCAD may reverse and start a new correction towards 1.2180. After testing this level, the price may rebound and resume its descending tendency. However, an alternative scenario implies that the asset may fall to reach the support area at 1.1990 without any corrections.

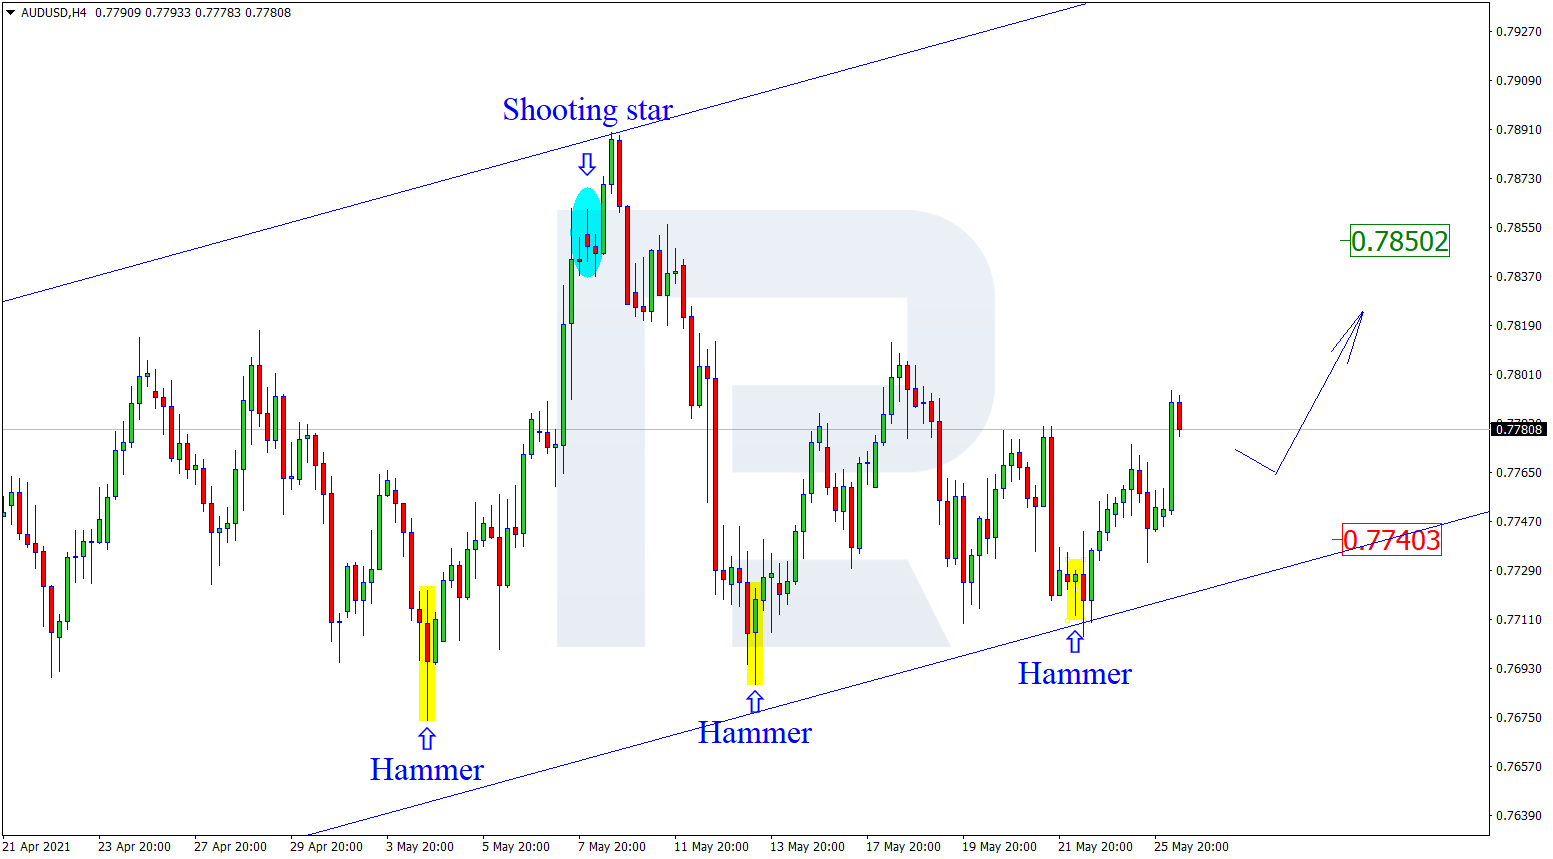
AUDUSD, “Australian Dollar vs US Dollar”
As we can see in the H4 chart, AUDUSD has formed several reversal patterns, such as Harami and Hammer, not far from the support level. At the moment, the asset is reversing in favor of the ascending tendency. In this case, the upside target may be the resistance area at 0.7850. At the same time, an opposite scenario implies that the price may fall towards the support level at 0.7740, rebound from it, and then resume trading upwards.
Free Reports:
 Get our Weekly Commitment of Traders Reports - See where the biggest traders (Hedge Funds and Commercial Hedgers) are positioned in the futures markets on a weekly basis.
 Sign Up for Our Stock Market Newsletter – Get updated on News, Charts & Rankings of Public Companies when you join our Stocks Newsletter
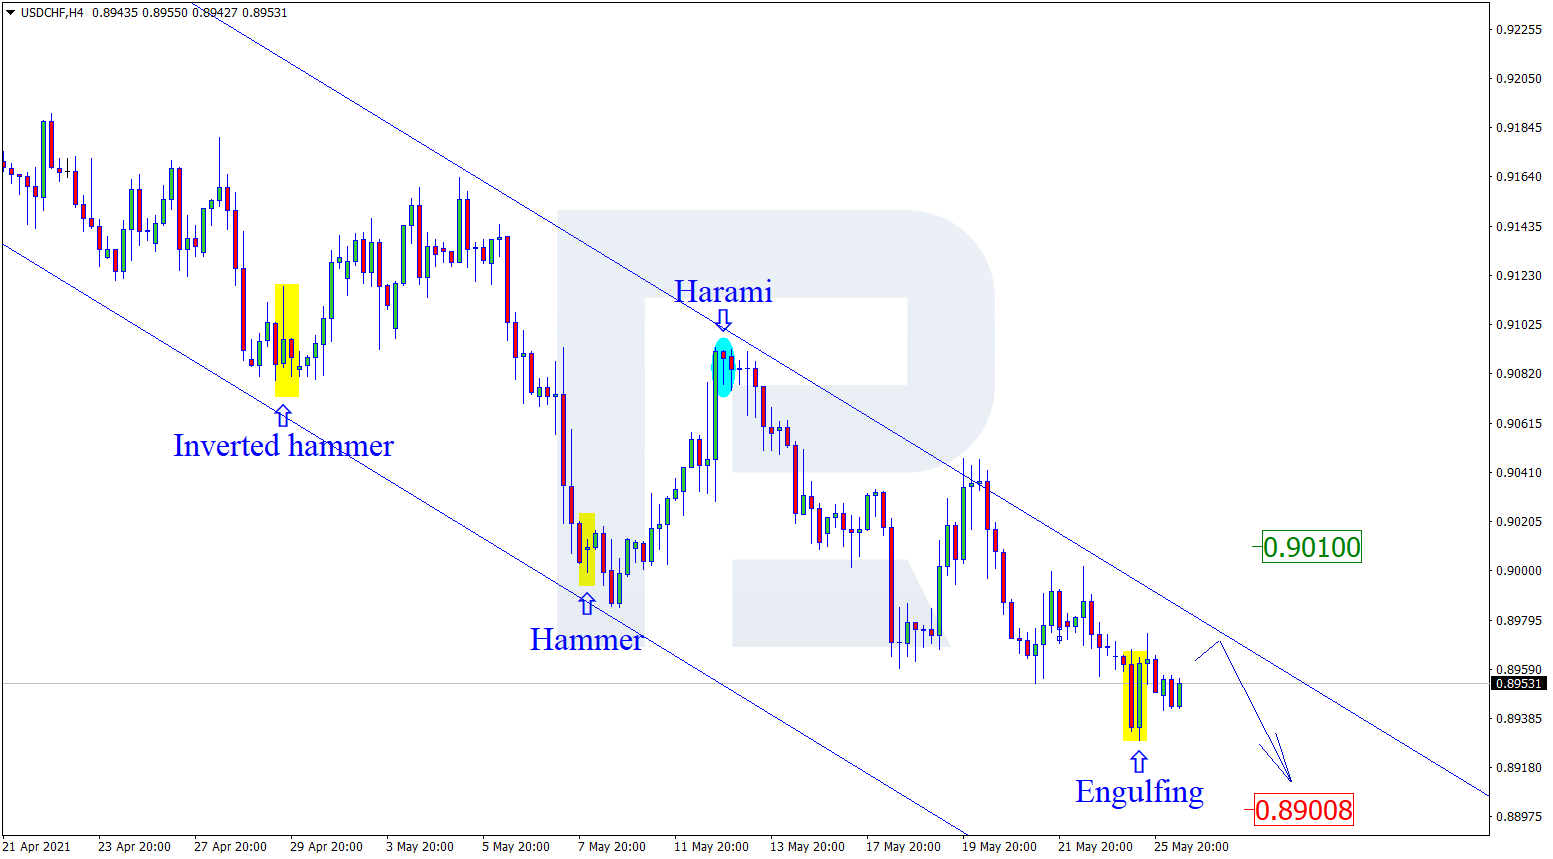
USDCHF, “US Dollar vs Swiss Franc”
As we can see in the H4 chart, the asset is still testing the support area, where it has formed an Engulfing reversal pattern. At the moment, USDCHF may reverse and start a new pullback. In this case, the correctional target may be the resistance level at 0.9010. Still, there might be an alternative scenario, according to which the asset may fall to reach 0.8900 without reversing and correcting.
Article By RoboForex.com
Attention!
Forecasts presented in this section only reflect the author’s private opinion and should not be considered as guidance for trading. RoboForex LP bears no responsibility for trading results based on trading recommendations described in these analytical reviews.

- COT Metals Charts: Weekly Speculator Bets see small gains for Silver & Gold Jul 12, 2026
- COT Bonds Charts: Speculator Bets led by SOFR 3-Months & 2-Year Bonds Jul 12, 2026
- COT Energy Charts: Weekly Speculator Changes led by Brent Oil Jul 12, 2026
- COT Soft Commodities Charts: Weekly Speculator Changes led by Sugar, Corn & Soybeans Jul 12, 2026
- The US and European stock indices are rising again amid renewed investor interest in the AI industry. Jul 10, 2026
- USD/JPY Falls as Yen Recovers Weekly Losses Jul 10, 2026
- Crude oil prices surged sharply by 7% in reaction to the rapid escalation of the conflict in the Middle East Jul 9, 2026
- Middle East Tensions Weigh on Gold Jul 9, 2026
- Pound Awaits Tighter Policy from Bank of England Jul 8, 2026
- The United States carried out airstrikes on Iran after Iran’s attacked tankers in the Strait of Hormuz. The RBNZ raised the interest rate to 2.5% Jul 8, 2026