Article By RoboForex.com
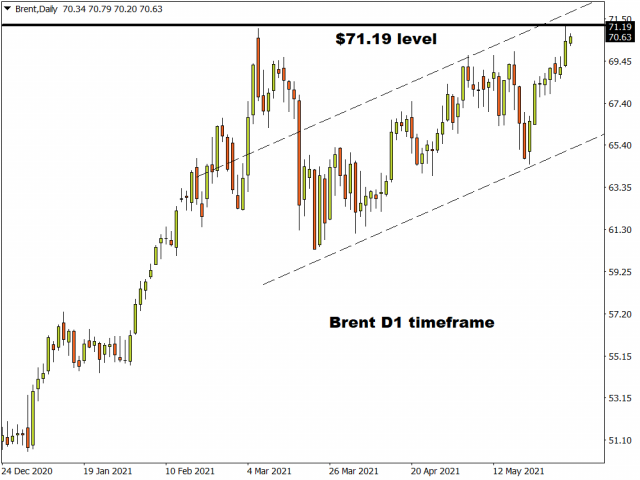
Brent
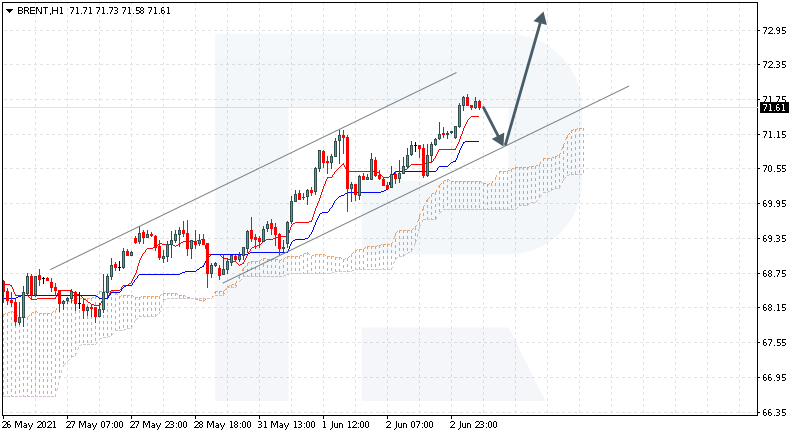
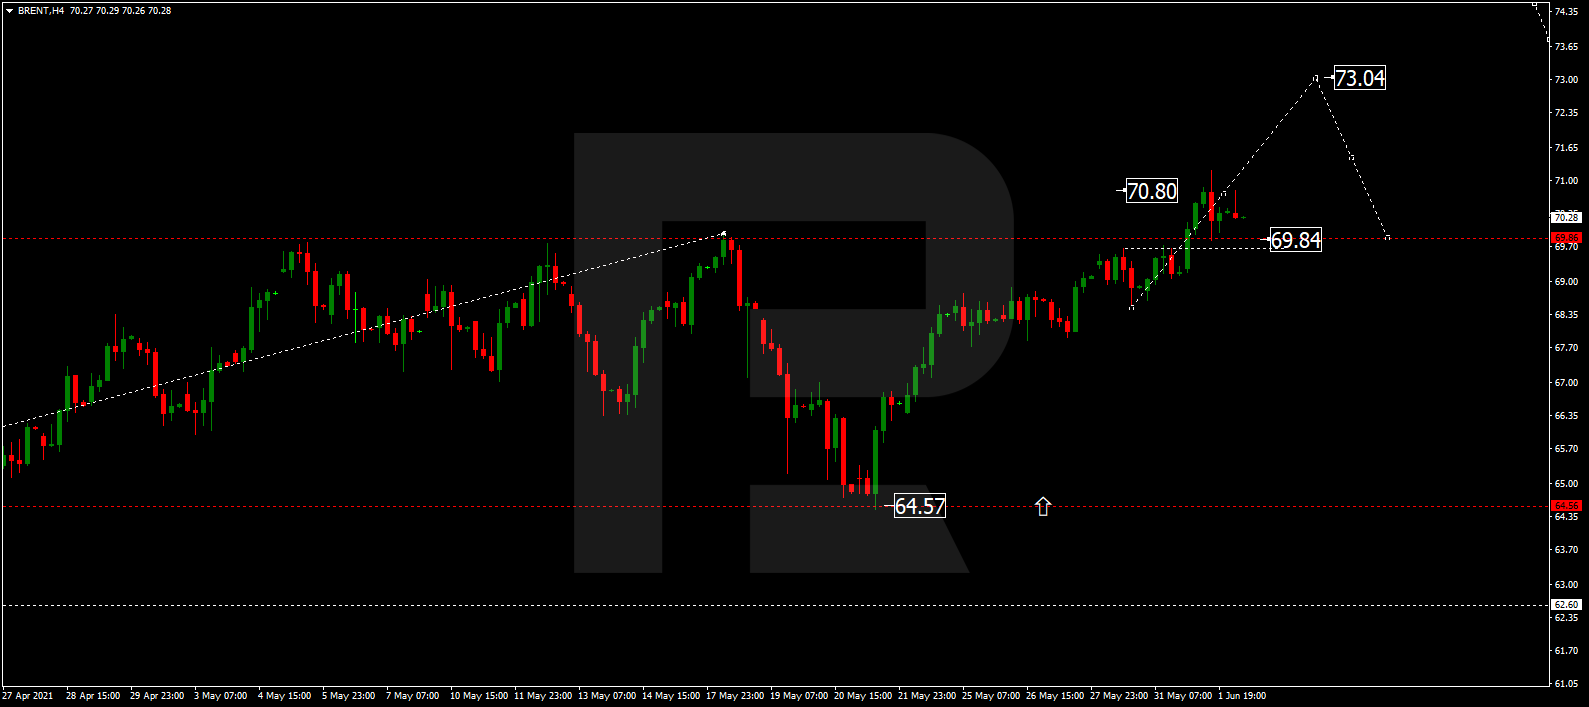
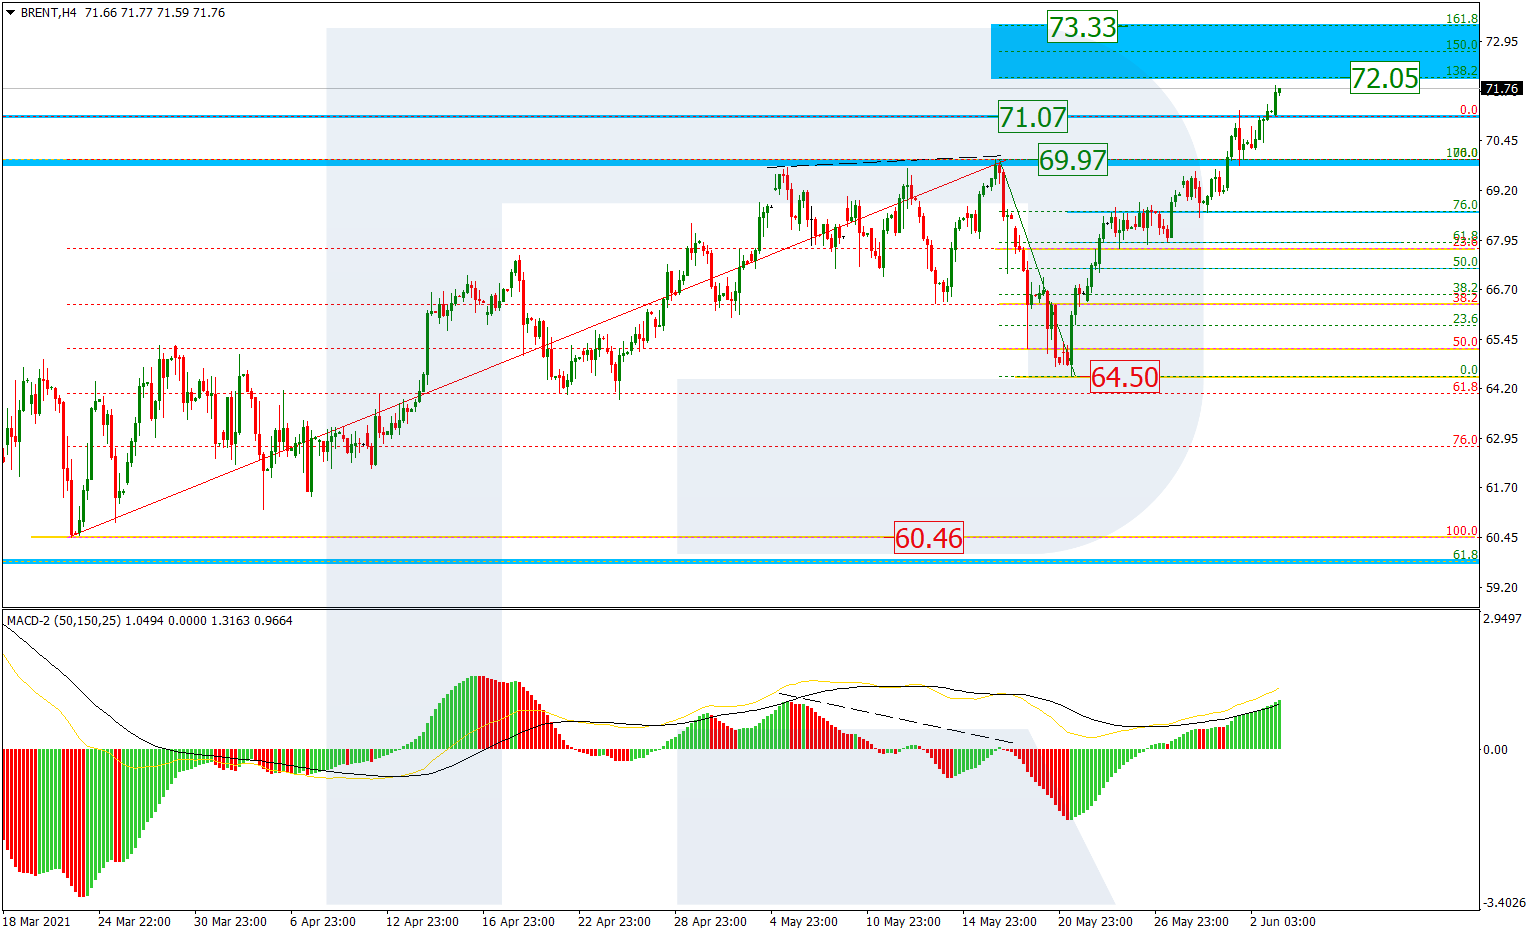
In the H4 chart, after completing the correctional downtrend at 50.0% fibo, Brent is steadily growing and has already broken both highs, local and long-term, at 69.97 and 71.07 respectively. Later, the market may continue growing to reach the post-correctional extension area between 138.2% and 161.8% fibo at 72.05 and 73.33 respectively. The support is the local low at 64.50.

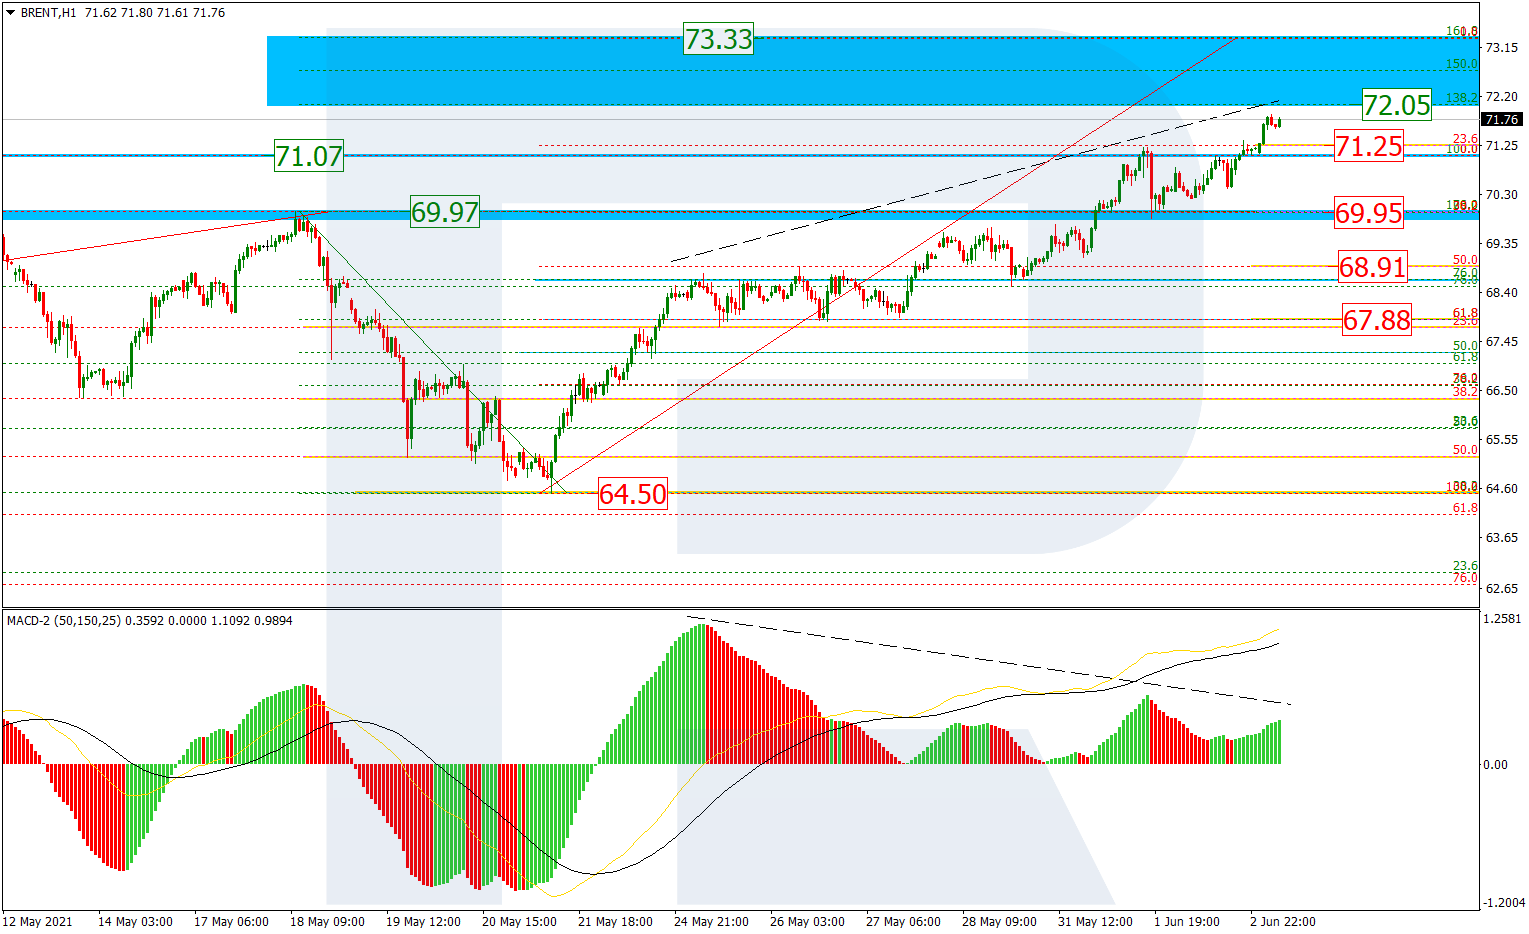
The H1 chart shows a more detailed structure of the current uptrend. At the same time, there is a divergence on MACD, which may hint at a possible pullback after the pair tests the upside border of the post-correctional extension area between 138.2% and 161.8% fibo at 72.05 and 73.33 respectively. The correctional targets may be 23.6%, 38.2%, 50.0%, and 61.8% fibo at 71.25, 69.95, 68.91, and 67.88 respectively.
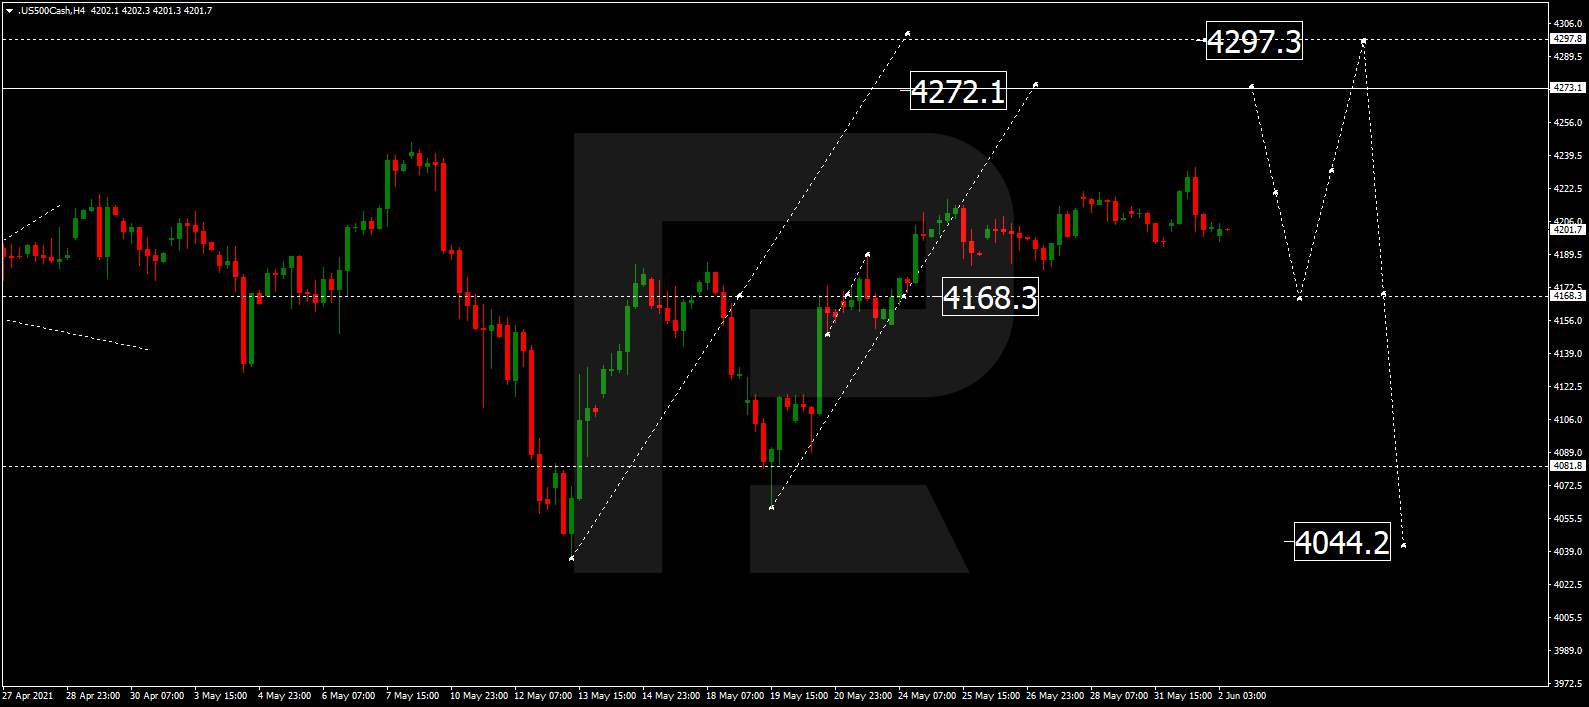
Dow Jones
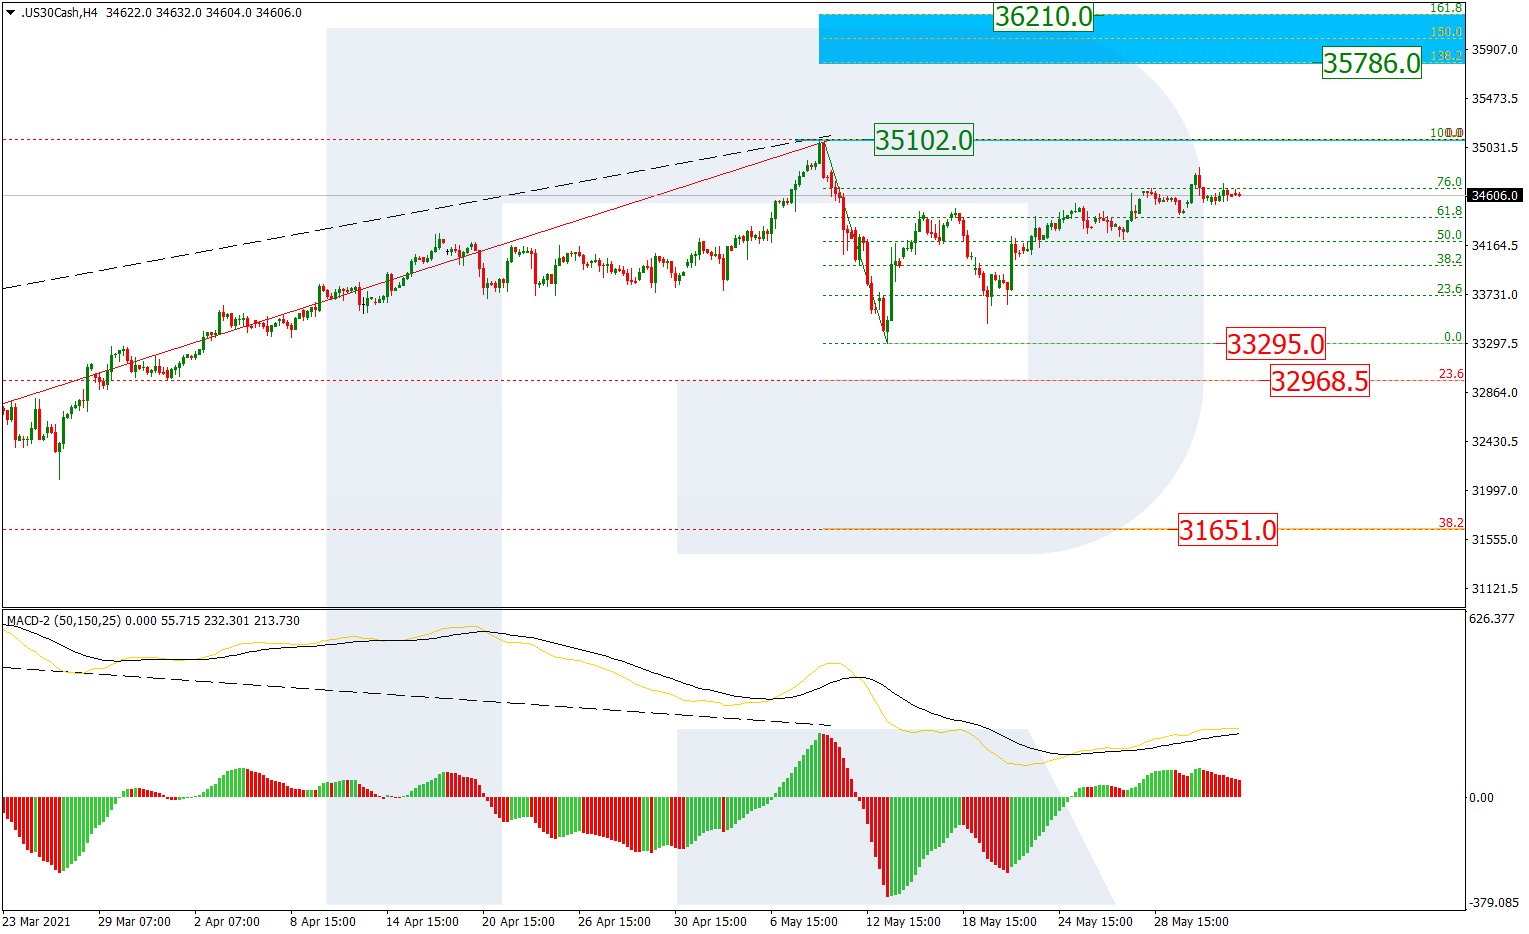
As we can see in the H4 chart, Dow Jones is slowing down a bit on its way towards the high at 35102.0. After completing the correction to the downside, the asset is moving upwards and has already reached 76.0% fibo. This rising wave is heading to break the high and then enter the post-correctional extension area between 138.2% and 161.8% fibo at 35786.0 and 36210.0 respectively. However, an alternative scenario implies a rebound from the high and a new mid-term correctional downtrend to break the low at 33295.0 and then mid-term 23.6% and 38.2% fibo at 32970.0 and 31651.0 respectively.
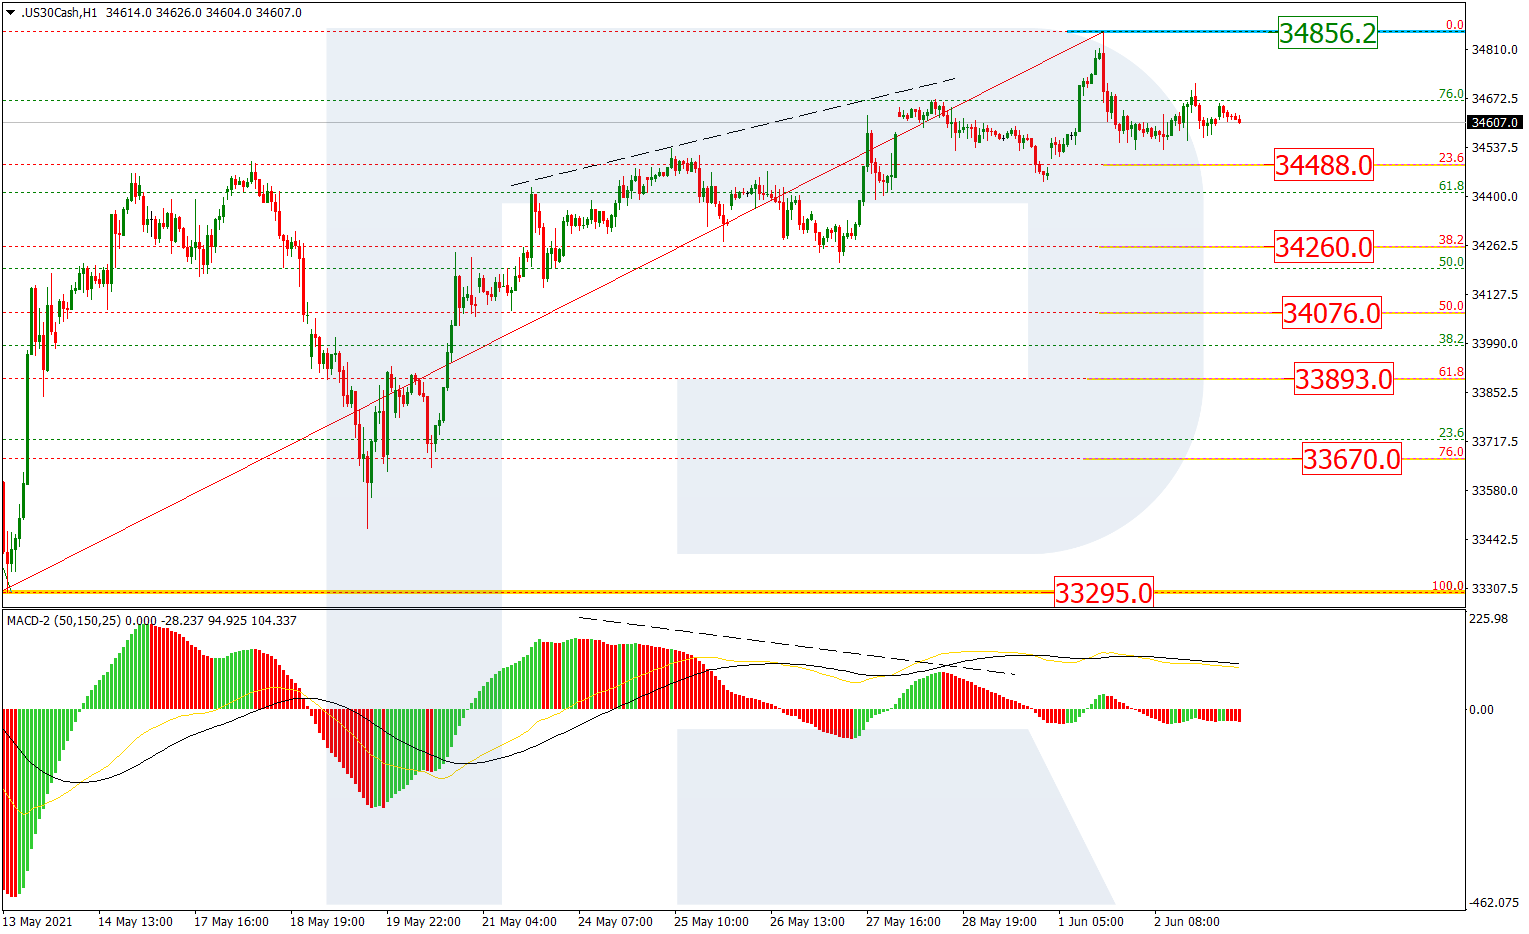
The H1 chart shows potential downside targets after a local divergence on MACD. The resistance is at 34856.2, At the moment, the index is falling and approaching 23.6% fibo at 34488.0. The next downside targets may be 38.2%, 50.0%, 61.8%, and 76.0% fibo at 34260.0, 34076.0, 33893.0, and 33670.0 respectively. Still, the key downside target is the local support at 33295.0.
Article By RoboForex.com
Attention!
Forecasts presented in this section only reflect the author’s private opinion and should not be considered as guidance for trading. RoboForex LP bears no responsibility for trading results based on trading recommendations described in these analytical reviews.