By Han Tan Market Analyst, ForexTime
This Friday’s US nonfarm payrolls data takes centre stage in this week’s global economic calendar.
And the US dollar is set to be the conduit for the market’s reaction to that crucial piece of information amid the ongoing debate on the US inflation outlook.
Why is the US jobs report so important for markets?
In short, investors how the US economy is faring, as it continues shedding off the ill-effects from the pandemic. As more businesses reopen, more people have jobs. As employees’ incomes are restored, that should lead to more spending. More consumer spending could trigger higher consumer prices, which is also known as ‘inflation’.
However, consumer prices that run too high too fast could have a negative impact on economic growth. And herein lies the tricky bit for policymakers.
The US Federal Reserve has been saying for months that the inflation that’s showing up in recent economic data are expected to be “transitory”. However, if the data over the coming months shows that inflation is roaring higher and not abating as the central bank expects, then the Fed may have to jump in and ease up on the support measures that they’ve rolled out in the markets, such as purchasing bonds every month and keeping US interest rates near-zero.
Hence, markets are already trying to pre-empt the Fed’s next move. Another strong showing in the US labour market could mean stronger inflationary pressures, which could then hasten the Fed’s tapering of its support measures.
If such a move comes as a surprise for investors and traders, that could lead to volatility across various asset classes, including stocks, Treasuries, and currencies.
That’s the broader context surrounding this Friday’s nonfarm payrolls data.
What are markets expecting?
Markets are forecasting that 653,000 jobs were added in the US last month.
This 653k figure is the result of some readjusted expectations following April’s shockingly low jobs print, which came in at a measly 266,000 compared to the median estimate of about one million jobs added. That dismal print underscores the notion that the US economic recovery will not be plain sailing all the way into the post-pandemic era.
Recall that the benchmark dollar index (DXY) fell by 0.79% on 7 May, on the back of that dismal NFP report. That was the DXY’s biggest single-day drop since 5 November 2020, amid the uncertainties in the aftermath of the US presidential election.
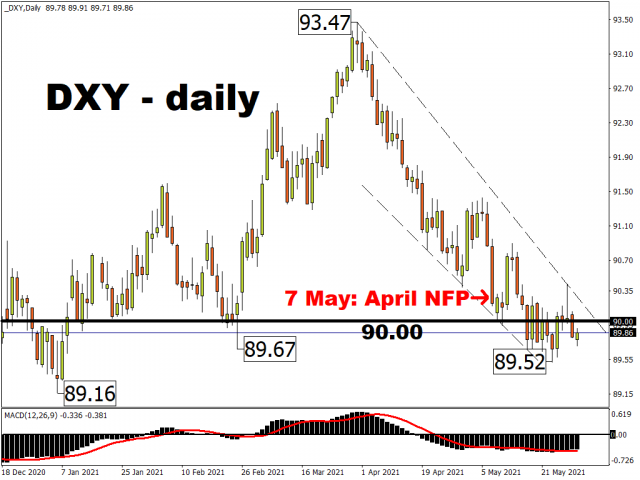
That 7 May reaction in the buck exposes how sensitive the market is to the latest readings on the US labour market. Since then, the DXY has fallen by a further 0.44%, keeping its Q2 downtrend intact.
However, the drop was not as pronounced as another US Dollar index, which has different weightage for its members in contrast to the DXY. This US Dollar index is an equally-weighted basket comprising the following G10 currency pairs:
The drop in this USD index was less pronounced; 0.62% following that negative surprise on 7 May. Since then, it has held relatively steady, with current prices less than 0.06% away from the 7 May close.
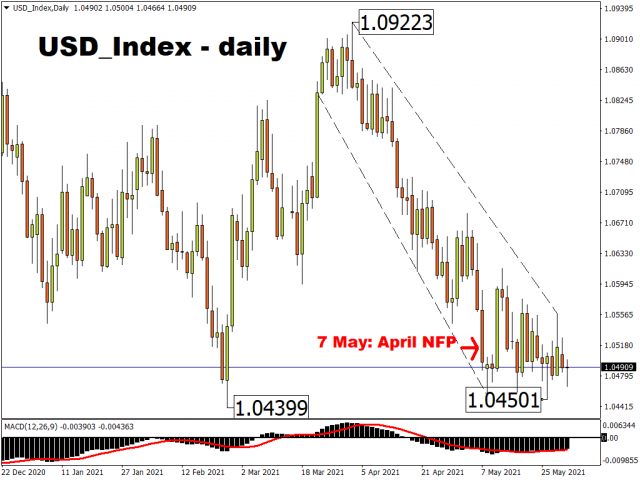
Another dose of pessimism after the upcoming NFP report could trigger another broad-based decline in the greenback, potentially dragging this USD index into sub-1.045 domain to test a new year-to-date low.
Given the uncertainty surrounding what the official nonfarm payrolls would be this Friday, the US dollar may not see a sizeable move over the coming days, barring an unexpected market-moving event. Then again, the dollar also may offer a tepid response if the official figures come close to the expected 653,000 figure. Between now and Friday, investors worldwide will also get more clues on the state of the US jobs market from the ADP employment figures and the weekly jobless claims, both due this Thursday, 3 June.
Still, the resultant drama after that 7 May nonfarm payrolls shocker would still be lingering on the markets’ collective mind. Another print that wildly deviates from market expectations this coming Friday could jolt the greenback once more.
Disclaimer: The content in this article comprises personal opinions and should not be construed as containing personal and/or other investment advice and/or an offer of and/or solicitation for any transactions in financial instruments and/or a guarantee and/or prediction of future performance. ForexTime (FXTM), its affiliates, agents, directors, officers or employees do not guarantee the accuracy, validity, timeliness or completeness, of any information or data made available and assume no liability as to any loss arising from any investment based on the same.
![]() Article by ForexTime
Article by ForexTime
ForexTime Ltd (FXTM) is an award winning international online forex broker regulated by CySEC 185/12 www.forextime.com