Archive for Forex and Currency News – Page 273

Key events this week: US jobs report offers next marker in inflation debate

By Han Tan Market Analyst, ForexTime

Last week, US stocks experienced a quiet but positive week, with the S&P 500 and the Dow Jones Industrial Average index each claiming a fourth consecutive monthly gain.

At the time of writing, US futures are holding steady even as US and UK markets will be closed on Monday.

‘Markets Extra’ Podcast: What is an index and why it matters? A chat with Nasdaq

Wall Street’s so-called “fear gauge”, the VIX index, ended the trading week below the psychological 16 level. Another week of calm could send it to a new year-to-date low, below the 15.38 level set on 14 April.

Much could depend on how markets react to scheduled events this week:

Monday, May 31

  • US, UK markets closed
  • Japan industrial production, retail sales, consumer confidence
  • OECD economic outlook

Tuesday, June 1

  • Manufacturing PMI: China, Eurozone, UK, US
  • RBA policy decision
  • BOE Governor Andrew Bailey speech
  • Fed speak: Fed Governor Lael Brainard
  • OPEC+ meeting

Wednesday, June 2

Fed speak:

  • Philadelphia Fed President Patrick Harker
  • Chicago Fed President Charles Evans
  • Atlanta Fed President Raphael Bostic
  • Dallas Fed President Robert Kaplan

Thursday, June 3

  • Services/composite PMIs: China, Eurozone, UK, US
  • US initial jobless claims
  • Fed speak: Fed Vice Chair for Supervision Randal Quarles, Philadelphia Fed President Patrick Harker

Friday, June 4

  • Panel discussion with central bank heads: Fed Chair Jerome Powell, ECB President Christine Lagarde, PBOC Governor Yi Gang
  • Eurozone retail sales
  • US nonfarm payrolls


US jobs report key for Dollar direction (DXY)

The US nonfarm payrolls print is scheduled for the first Friday of every month. The figures due on 4 June carries greater weight, following the shockingly-low figures posted on the first Friday of May.

Markets would interpret another lower-than-expected jobs tally to mean that the Fed might be more willing to maintain its support measures until the job market is on a more solid footing. Hence, another lackluster jobs report could see the dollar index (DXY) relinquish the 90 handle once more.

However, a non-farm payrolls report that exceeds market expectations would be taken as a sign that the tightening labour market could further boost inflationary pressures.

Recall that this past Friday, the April US core PCE inflation’s 3.1% surpassed the market-expected 2.9%. That was the highest year-on-year print since 1992, albeit with the low base effects in play.

A bumper NFP this Friday could spur another selloff in US Treasuries, sending its yields surging, which in turn would offer tailwinds for the dollar.


Commodity spotlight – Oil (Brent)

OPEC+ is slated to decide on Tuesday whether to further loosen the oil taps over the coming months. At a time when markets are already bracing for more oil shipments out of Iran pending their nuclear talks with the US, more incoming global supplies would dampen oil prices further.

Over on the demand-side, watch the global PMI readings and the latest OECD economic outlook for the latest signs of a demand recovery. China’s manufacturing PMI released this morning shows that the sector is still firmly in expansionary territory in May, having posted a reading above 50 every month since February 2020.

Should markets grow confident that global demand can absorb the incoming supplies, this might help Brent oil claim a stronger hold on the $70/bbl handle.


Disclaimer: The content in this article comprises personal opinions and should not be construed as containing personal and/or other investment advice and/or an offer of and/or solicitation for any transactions in financial instruments and/or a guarantee and/or prediction of future performance. ForexTime (FXTM), its affiliates, agents, directors, officers or employees do not guarantee the accuracy, validity, timeliness or completeness, of any information or data made available and assume no liability as to any loss arising from any investment based on the same.


Forex-Time-LogoArticle by ForexTime

ForexTime Ltd (FXTM) is an award winning international online forex broker regulated by CySEC 185/12 www.forextime.com

COT Currency Futures Charts: Bitcoin, US Dollar, Euro, Ruble, Real, Franc, Yen & Aussie

By CountingPips.com COT Home | Data Tables | Data Downloads | Newsletter

Here are the latest charts and statistics for the Commitment of Traders (COT) data published by the Commodities Futures Trading Commission (CFTC).

The latest COT data is updated through Tuesday May 25 2021 and shows a quick view of how large traders (for-profit speculators and commercial entities) were positioned in the futures markets. All currency positions are in direct relation to the US dollar where, for example, a bet for the euro is a bet that the euro will rise versus the dollar while a bet against the euro will be a bet that the euro will decline versus the dollar.


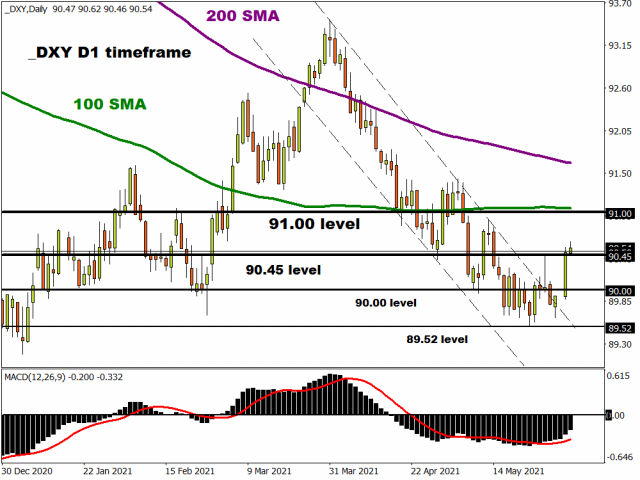
US Dollar Index Futures:


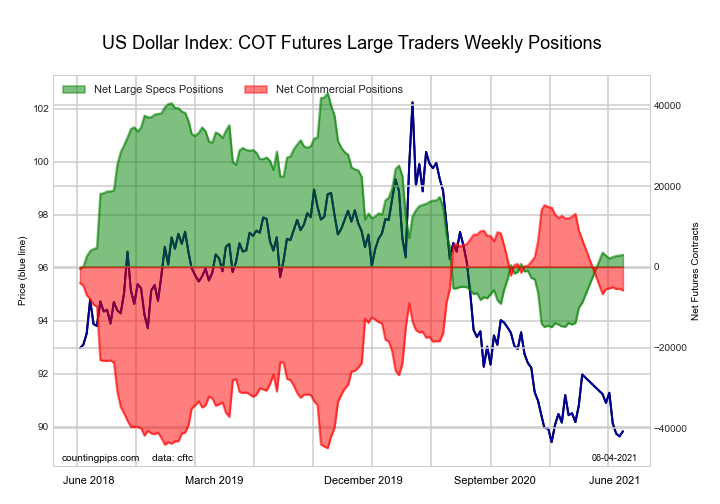
The US Dollar Index large speculator standing this week resulted in a net position of 2,780 contracts in the data reported through Tuesday. This was a weekly increase of 96 contracts from the previous week which had a total of 2,684 net contracts.

This week’s current strength score (the trader positioning range over the past three years, measured from 0 to 100) shows the speculators are currently Bearish with a score of 30.6 percent. The commercials are Bullish with a score of 65.6 percent and the small traders (not shown in chart) are Bullish with a score of 53.2 percent.

US DOLLAR INDEX StatisticsSPECULATORSCOMMERCIALSSMALL TRADERS
– Percent of Open Interest Longs:63.912.614.3
– Percent of Open Interest Shorts:57.425.18.2
– Net Position:2,780-5,3902,610
– Gross Longs:27,4885,4136,159
– Gross Shorts:24,70810,8033,549
– Long to Short Ratio:1.1 to 10.5 to 11.7 to 1
NET POSITION TREND:
– COT Index Score (3 Year Range Pct):30.665.653.2
– COT Index Reading (3 Year Range):BearishBullishBullish
NET POSITION MOVEMENT INDEX:
– 6-Week Change in Strength Index:-5.55.9-4.7


Euro Currency Futures:


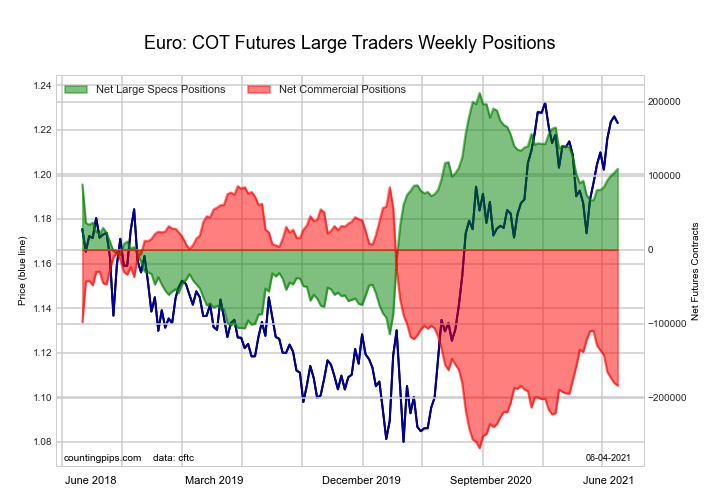
The Euro Currency large speculator standing this week resulted in a net position of 104,000 contracts in the data reported through Tuesday. This was a weekly gain of 4,142 contracts from the previous week which had a total of 99,858 net contracts.

This week’s current strength score (the trader positioning range over the past three years, measured from 0 to 100) shows the speculators are currently Bullish with a score of 66.9 percent. The commercials are Bearish with a score of 24.9 percent and the small traders (not shown in chart) are Bullish-Extreme with a score of 100.0 percent.

EURO Currency StatisticsSPECULATORSCOMMERCIALSSMALL TRADERS
– Percent of Open Interest Longs:32.051.715.1
– Percent of Open Interest Shorts:17.976.14.8
– Net Position:104,000-179,86675,866
– Gross Longs:236,103381,869111,477
– Gross Shorts:132,103561,73535,611
– Long to Short Ratio:1.8 to 10.7 to 13.1 to 1
NET POSITION TREND:
– COT Index Score (3 Year Range Pct):66.924.9100.0
– COT Index Reading (3 Year Range):BullishBearishBullish-Extreme
NET POSITION MOVEMENT INDEX:
– 6-Week Change in Strength Index:11.4-19.846.9


British Pound Sterling Futures:


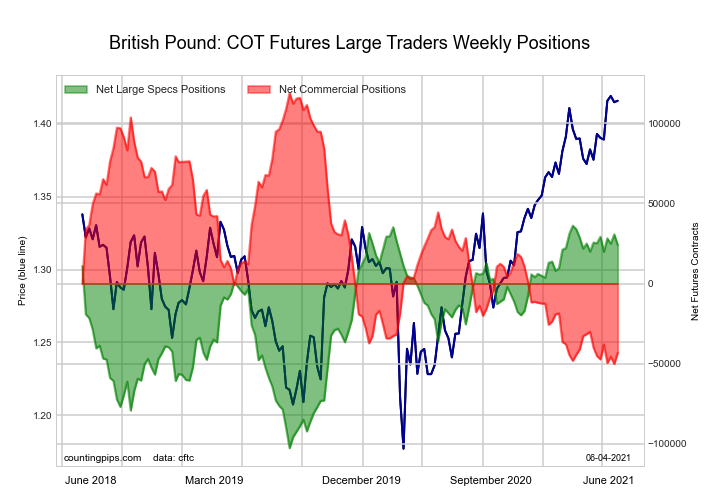
The British Pound Sterling large speculator standing this week resulted in a net position of 30,659 contracts in the data reported through Tuesday. This was a weekly lift of 5,759 contracts from the previous week which had a total of 24,900 net contracts.

This week’s current strength score (the trader positioning range over the past three years, measured from 0 to 100) shows the speculators are currently Bullish-Extreme with a score of 96.1 percent. The commercials are Bearish-Extreme with a score of 0.0 percent and the small traders (not shown in chart) are Bullish-Extreme with a score of 96.1 percent.

BRITISH POUND StatisticsSPECULATORSCOMMERCIALSSMALL TRADERS
– Percent of Open Interest Longs:37.937.224.2
– Percent of Open Interest Shorts:19.866.912.7
– Net Position:30,659-50,19019,531
– Gross Longs:64,19363,05840,988
– Gross Shorts:33,534113,24821,457
– Long to Short Ratio:1.9 to 10.6 to 11.9 to 1
NET POSITION TREND:
– COT Index Score (3 Year Range Pct):96.10.096.1
– COT Index Reading (3 Year Range):Bullish-ExtremeBearish-ExtremeBullish-Extreme
NET POSITION MOVEMENT INDEX:
– 6-Week Change in Strength Index:3.7-6.010.5


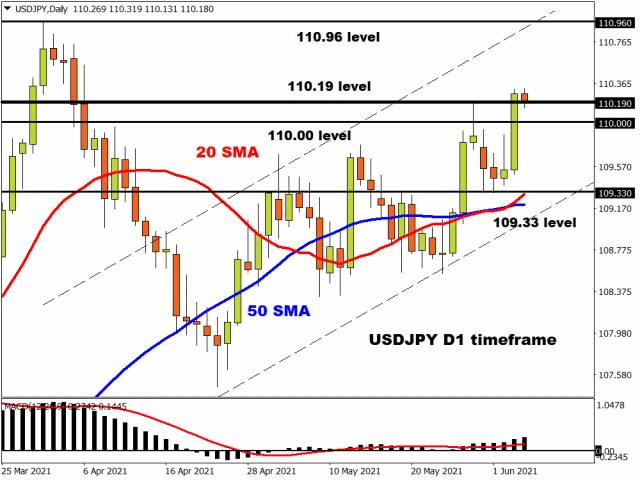
Japanese Yen Futures:


The Japanese Yen large speculator standing this week resulted in a net position of -50,156 contracts in the data reported through Tuesday. This was a weekly increase of 792 contracts from the previous week which had a total of -50,948 net contracts.

This week’s current strength score (the trader positioning range over the past three years, measured from 0 to 100) shows the speculators are currently Bearish with a score of 39.2 percent. The commercials are Bullish with a score of 63.6 percent and the small traders (not shown in chart) are Bearish with a score of 34.8 percent.

JAPANESE YEN StatisticsSPECULATORSCOMMERCIALSSMALL TRADERS
– Percent of Open Interest Longs:15.870.112.5
– Percent of Open Interest Shorts:48.530.019.8
– Net Position:-50,15661,353-11,197
– Gross Longs:24,163107,37719,120
– Gross Shorts:74,31946,02430,317
– Long to Short Ratio:0.3 to 12.3 to 10.6 to 1
NET POSITION TREND:
– COT Index Score (3 Year Range Pct):39.263.634.8
– COT Index Reading (3 Year Range):BearishBullishBearish
NET POSITION MOVEMENT INDEX:
– 6-Week Change in Strength Index:4.9-8.217.7


Swiss Franc Futures:


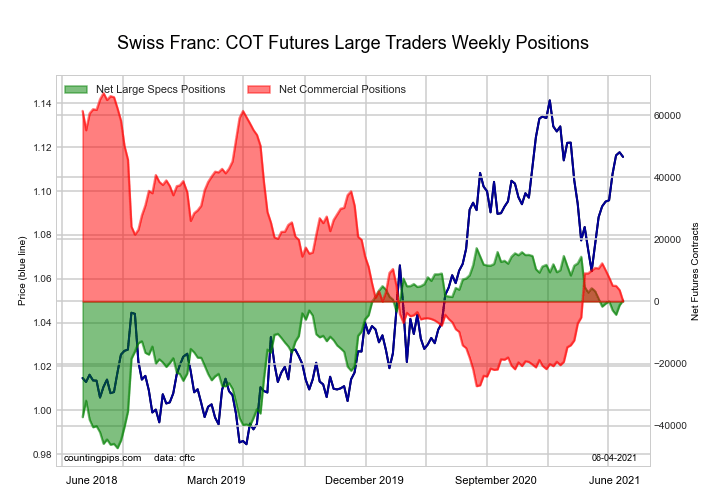
The Swiss Franc large speculator standing this week resulted in a net position of -1,203 contracts in the data reported through Tuesday. This was a weekly lift of 3,062 contracts from the previous week which had a total of -4,265 net contracts.

This week’s current strength score (the trader positioning range over the past three years, measured from 0 to 100) shows the speculators are currently Bullish with a score of 71.5 percent. The commercials are Bearish with a score of 32.8 percent and the small traders (not shown in chart) are Bullish with a score of 59.0 percent.

SWISS FRANC StatisticsSPECULATORSCOMMERCIALSSMALL TRADERS
– Percent of Open Interest Longs:28.141.430.4
– Percent of Open Interest Shorts:30.832.936.1
– Net Position:-1,2033,679-2,476
– Gross Longs:12,22317,99713,233
– Gross Shorts:13,42614,31815,709
– Long to Short Ratio:0.9 to 11.3 to 10.8 to 1
NET POSITION TREND:
– COT Index Score (3 Year Range Pct):71.532.859.0
– COT Index Reading (3 Year Range):BullishBearishBullish
NET POSITION MOVEMENT INDEX:
– 6-Week Change in Strength Index:-3.1-7.424.5


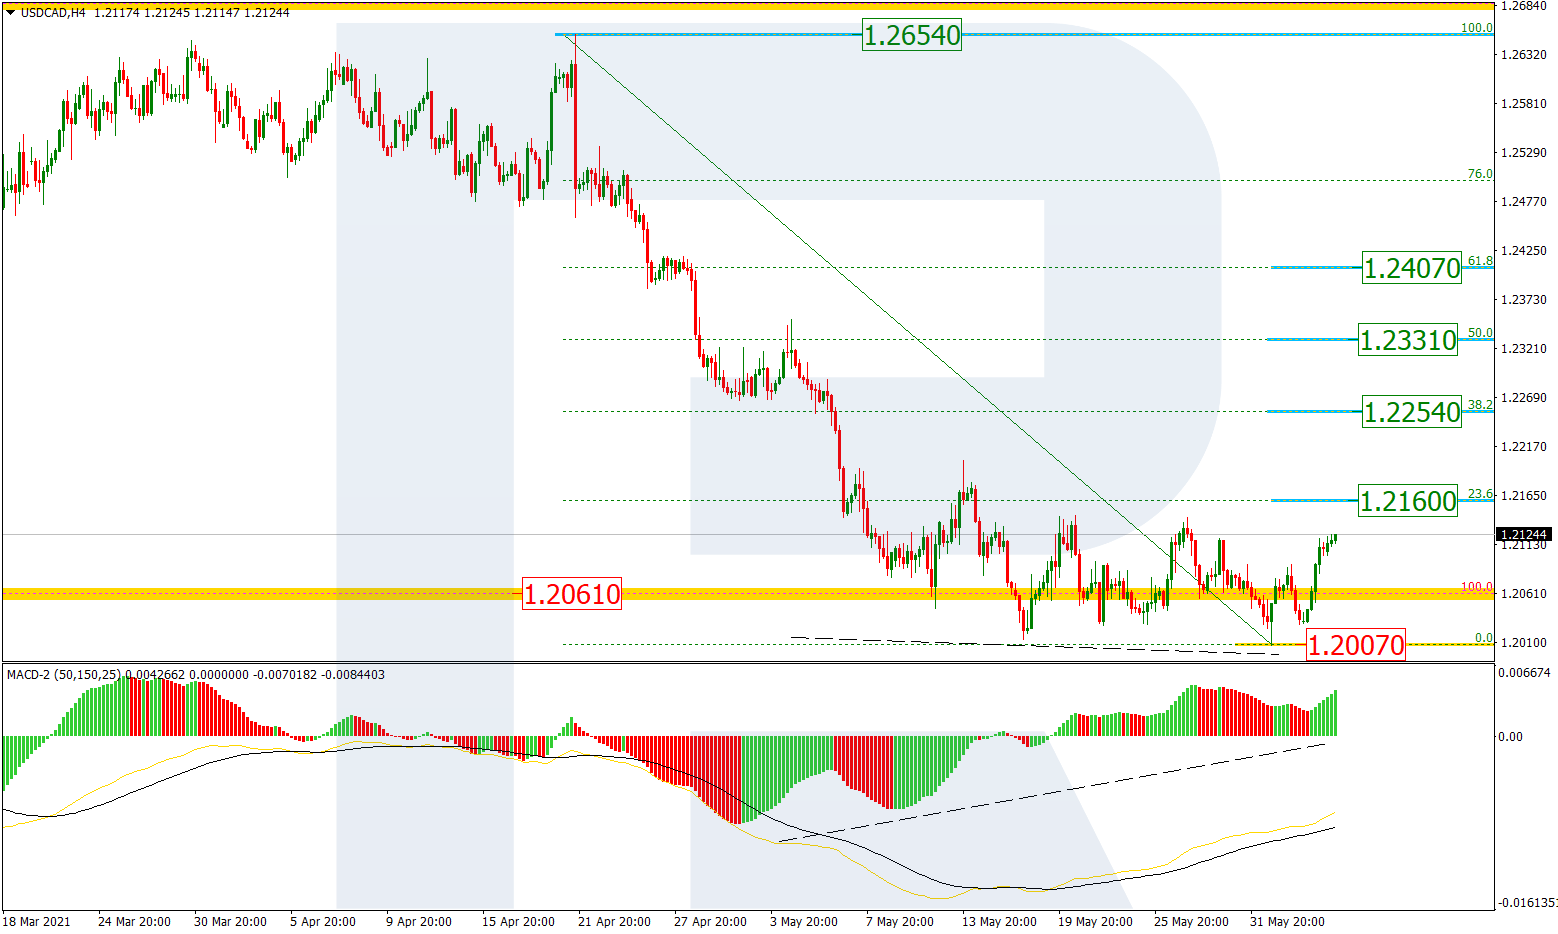
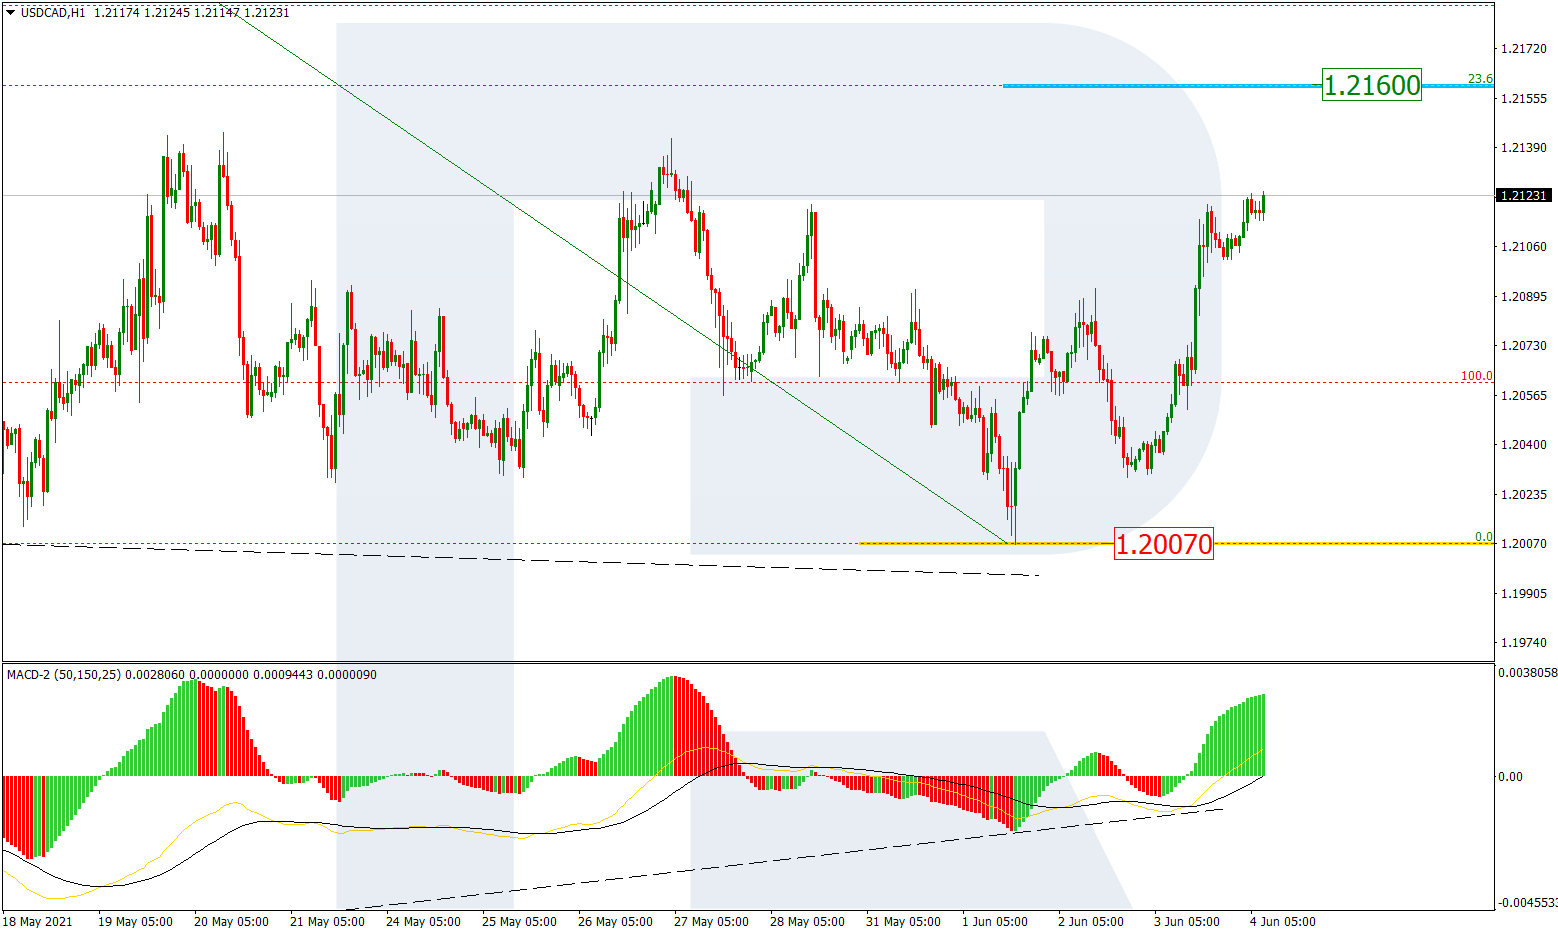
Canadian Dollar Futures:


The Canadian Dollar large speculator standing this week resulted in a net position of 44,811 contracts in the data reported through Tuesday. This was a weekly decrease of -1,301 contracts from the previous week which had a total of 46,112 net contracts.

This week’s current strength score (the trader positioning range over the past three years, measured from 0 to 100) shows the speculators are currently Bullish-Extreme with a score of 92.3 percent. The commercials are Bearish-Extreme with a score of 0.0 percent and the small traders (not shown in chart) are Bullish-Extreme with a score of 93.1 percent.

CANADIAN DOLLAR StatisticsSPECULATORSCOMMERCIALSSMALL TRADERS
– Percent of Open Interest Longs:39.535.923.1
– Percent of Open Interest Shorts:18.571.38.7
– Net Position:44,811-75,53530,724
– Gross Longs:84,18376,43949,306
– Gross Shorts:39,372151,97418,582
– Long to Short Ratio:2.1 to 10.5 to 12.7 to 1
NET POSITION TREND:
– COT Index Score (3 Year Range Pct):92.30.093.1
– COT Index Reading (3 Year Range):Bullish-ExtremeBearish-ExtremeBullish-Extreme
NET POSITION MOVEMENT INDEX:
– 6-Week Change in Strength Index:35.3-30.97.2


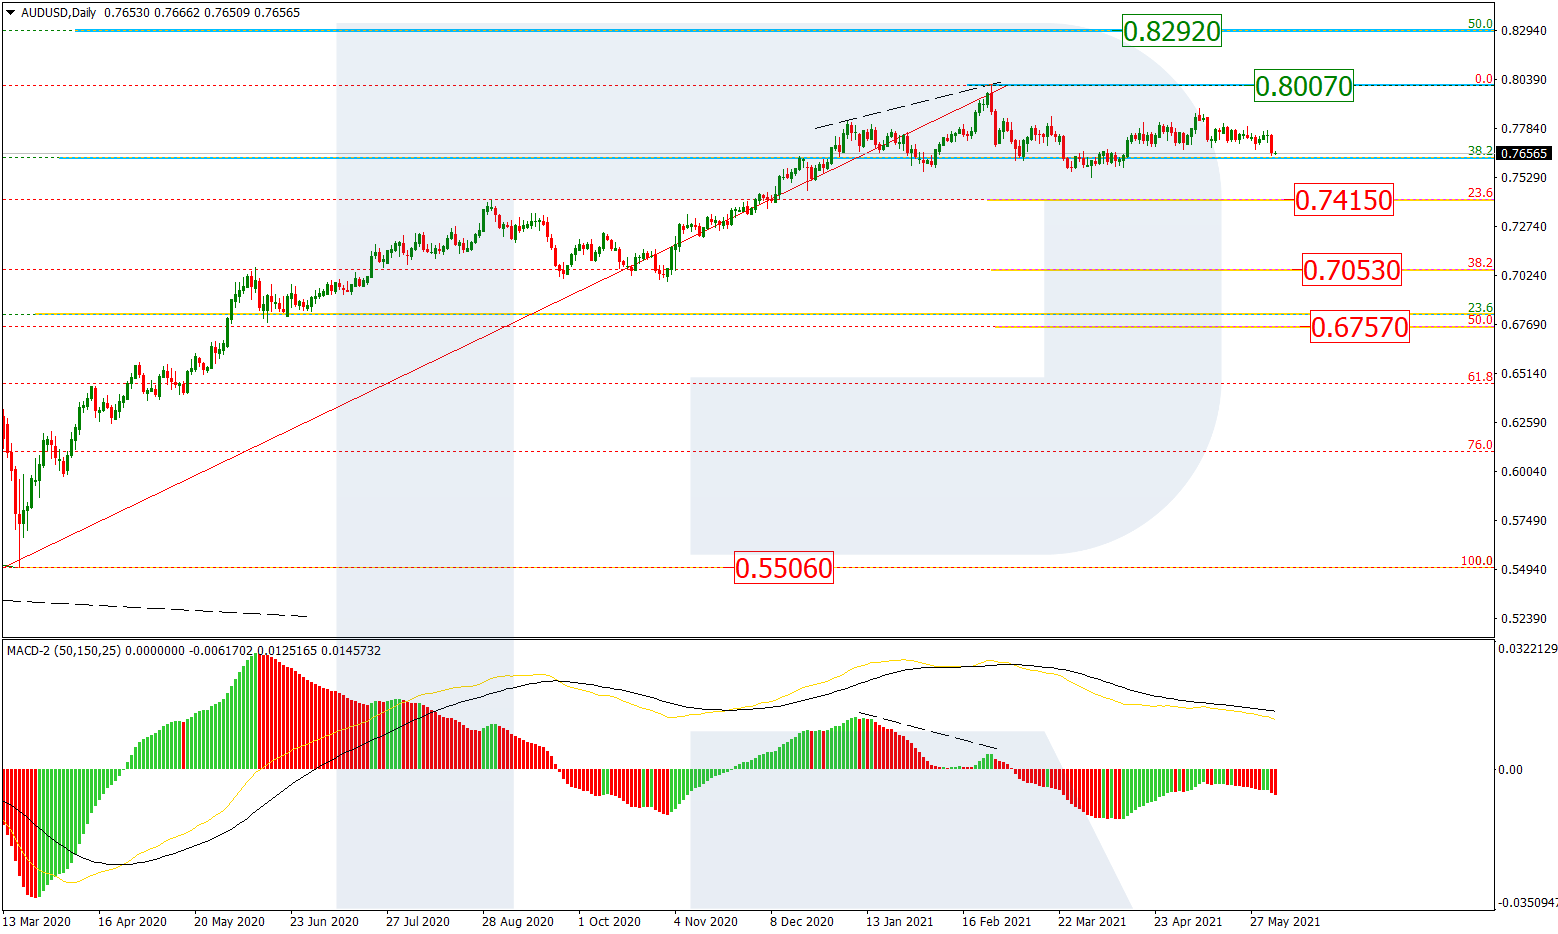
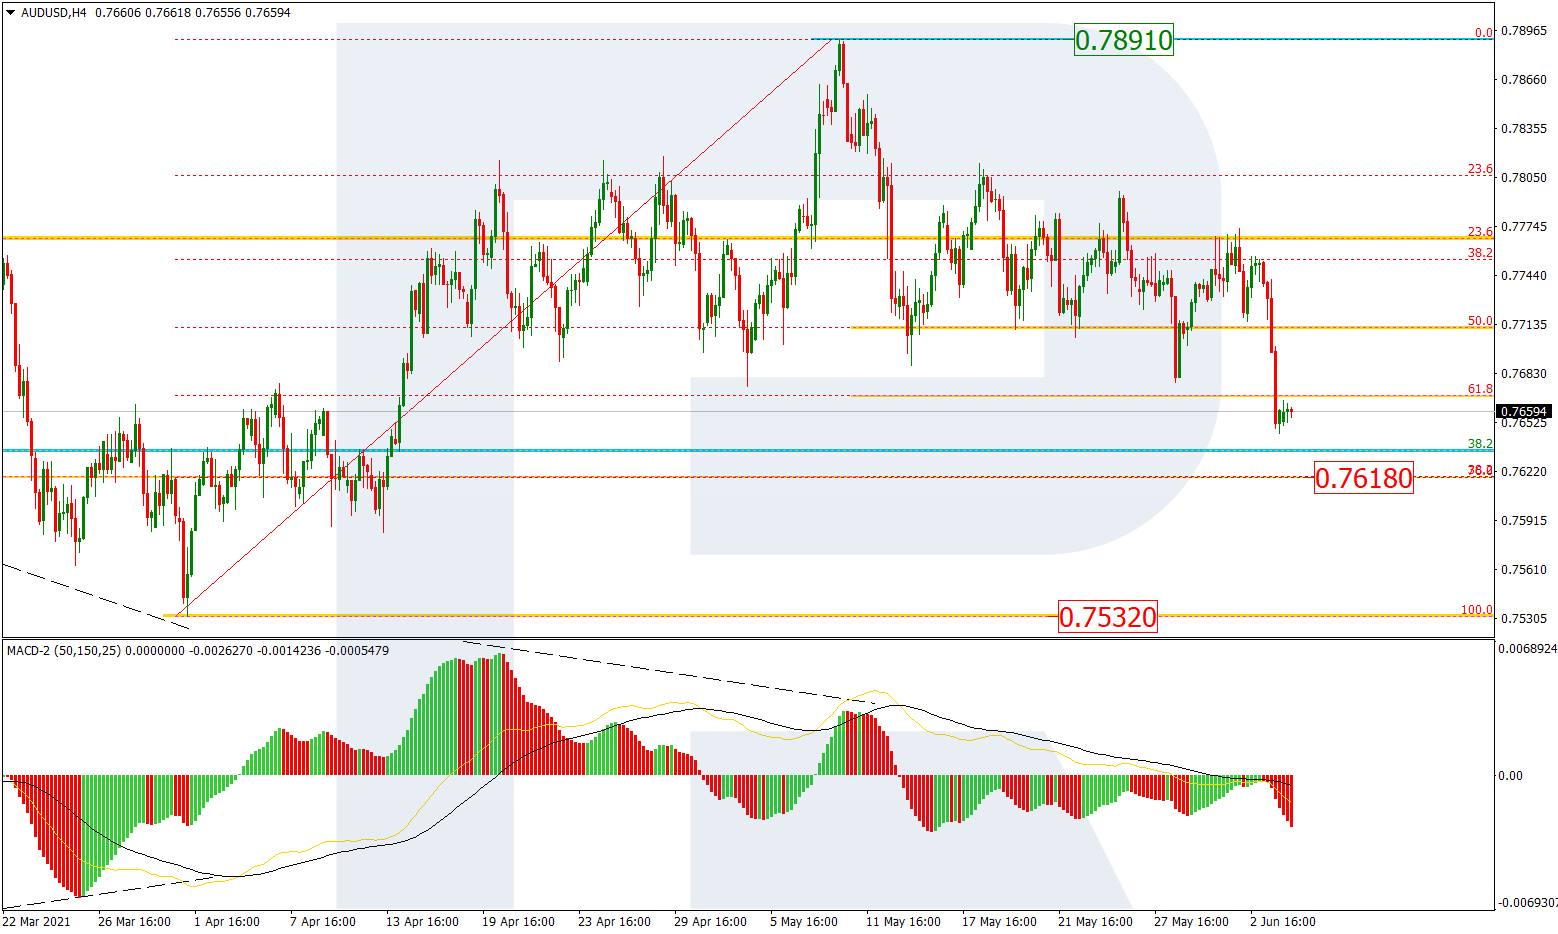
Australian Dollar Futures:


The Australian Dollar large speculator standing this week resulted in a net position of -809 contracts in the data reported through Tuesday. This was a weekly lowering of -3,811 contracts from the previous week which had a total of 3,002 net contracts.

This week’s current strength score (the trader positioning range over the past three years, measured from 0 to 100) shows the speculators are currently Bullish-Extreme with a score of 80.9 percent. The commercials are Bearish-Extreme with a score of 10.5 percent and the small traders (not shown in chart) are Bullish-Extreme with a score of 87.0 percent.

AUSTRALIAN DOLLAR StatisticsSPECULATORSCOMMERCIALSSMALL TRADERS
– Percent of Open Interest Longs:40.936.721.9
– Percent of Open Interest Shorts:41.546.111.8
– Net Position:-809-12,78913,598
– Gross Longs:55,09849,40129,543
– Gross Shorts:55,90762,19015,945
– Long to Short Ratio:1.0 to 10.8 to 11.9 to 1
NET POSITION TREND:
– COT Index Score (3 Year Range Pct):80.910.587.0
– COT Index Reading (3 Year Range):Bullish-ExtremeBearish-ExtremeBullish-Extreme
NET POSITION MOVEMENT INDEX:
– 6-Week Change in Strength Index:-5.10.68.4


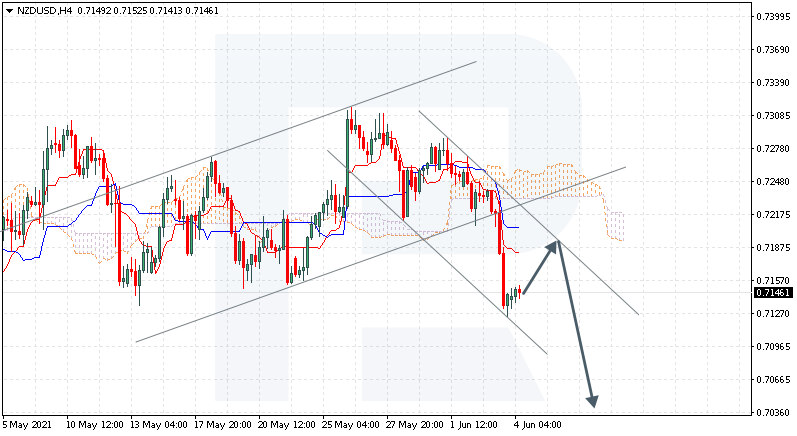
New Zealand Dollar Futures:


The New Zealand Dollar large speculator standing this week resulted in a net position of 8,585 contracts in the data reported through Tuesday. This was a weekly gain of 135 contracts from the previous week which had a total of 8,450 net contracts.

This week’s current strength score (the trader positioning range over the past three years, measured from 0 to 100) shows the speculators are currently Bullish-Extreme with a score of 85.7 percent. The commercials are Bearish-Extreme with a score of 12.4 percent and the small traders (not shown in chart) are Bullish-Extreme with a score of 88.0 percent.

NEW ZEALAND DOLLAR StatisticsSPECULATORSCOMMERCIALSSMALL TRADERS
– Percent of Open Interest Longs:55.329.313.3
– Percent of Open Interest Shorts:35.855.86.2
– Net Position:8,585-11,7073,122
– Gross Longs:24,44612,9735,873
– Gross Shorts:15,86124,6802,751
– Long to Short Ratio:1.5 to 10.5 to 12.1 to 1
NET POSITION TREND:
– COT Index Score (3 Year Range Pct):85.712.488.0
– COT Index Reading (3 Year Range):Bullish-ExtremeBearish-ExtremeBullish-Extreme
NET POSITION MOVEMENT INDEX:
– 6-Week Change in Strength Index:10.2-10.810.7


Mexican Peso Futures:


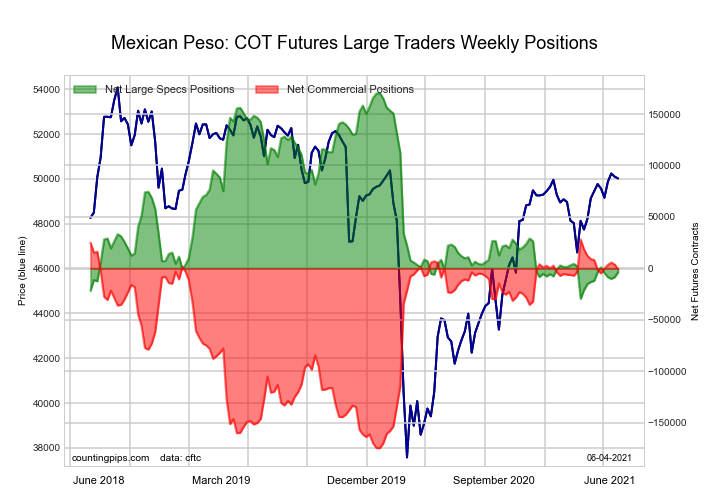
The Mexican Peso large speculator standing this week resulted in a net position of -8,498 contracts in the data reported through Tuesday. This was a weekly advance of 1,620 contracts from the previous week which had a total of -10,118 net contracts.

This week’s current strength score (the trader positioning range over the past three years, measured from 0 to 100) shows the speculators are currently Bearish-Extreme with a score of 10.5 percent. The commercials are Bullish-Extreme with a score of 88.0 percent and the small traders (not shown in chart) are Bullish with a score of 63.1 percent.

MEXICAN PESO StatisticsSPECULATORSCOMMERCIALSSMALL TRADERS
– Percent of Open Interest Longs:43.547.95.2
– Percent of Open Interest Shorts:49.345.32.0
– Net Position:-8,4983,7684,730
– Gross Longs:63,86870,3617,663
– Gross Shorts:72,36666,5932,933
– Long to Short Ratio:0.9 to 11.1 to 12.6 to 1
NET POSITION TREND:
– COT Index Score (3 Year Range Pct):10.588.063.1
– COT Index Reading (3 Year Range):Bearish-ExtremeBullish-ExtremeBullish
NET POSITION MOVEMENT INDEX:
– 6-Week Change in Strength Index:1.7-2.13.6


Brazilian Real Futures:


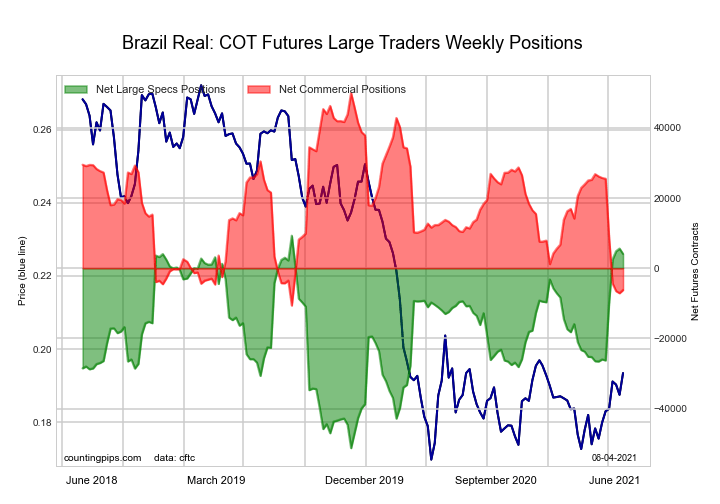
The Brazilian Real large speculator standing this week resulted in a net position of 5,607 contracts in the data reported through Tuesday. This was a weekly gain of 776 contracts from the previous week which had a total of 4,831 net contracts.

This week’s current strength score (the trader positioning range over the past three years, measured from 0 to 100) shows the speculators are currently Bullish-Extreme with a score of 94.0 percent. The commercials are Bearish-Extreme with a score of 5.8 percent and the small traders (not shown in chart) are Bullish-Extreme with a score of 90.6 percent.

BRAZIL REAL StatisticsSPECULATORSCOMMERCIALSSMALL TRADERS
– Percent of Open Interest Longs:39.355.25.2
– Percent of Open Interest Shorts:30.866.02.9
– Net Position:5,607-7,1131,506
– Gross Longs:25,83636,2513,427
– Gross Shorts:20,22943,3641,921
– Long to Short Ratio:1.3 to 10.8 to 11.8 to 1
NET POSITION TREND:
– COT Index Score (3 Year Range Pct):94.05.890.6
– COT Index Reading (3 Year Range):Bullish-ExtremeBearish-ExtremeBullish-Extreme
NET POSITION MOVEMENT INDEX:
– 6-Week Change in Strength Index:53.2-55.014.1


Russian Ruble Futures:


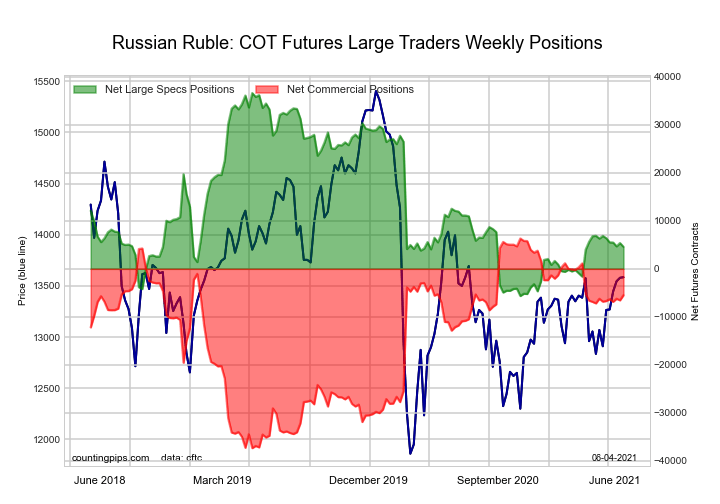
The Russian Ruble large speculator standing this week resulted in a net position of 5,372 contracts in the data reported through Tuesday. This was a weekly lift of 692 contracts from the previous week which had a total of 4,680 net contracts.

This week’s current strength score (the trader positioning range over the past three years, measured from 0 to 100) shows the speculators are currently Bearish with a score of 26.1 percent. The commercials are Bullish with a score of 70.5 percent and the small traders (not shown in chart) are Bullish-Extreme with a score of 82.1 percent.

RUSSIAN RUBLE StatisticsSPECULATORSCOMMERCIALSSMALL TRADERS
– Percent of Open Interest Longs:36.356.86.9
– Percent of Open Interest Shorts:20.975.53.6
– Net Position:5,372-6,5521,180
– Gross Longs:12,71819,9272,429
– Gross Shorts:7,34626,4791,249
– Long to Short Ratio:1.7 to 10.8 to 11.9 to 1
NET POSITION TREND:
– COT Index Score (3 Year Range Pct):26.170.582.1
– COT Index Reading (3 Year Range):BearishBullishBullish-Extreme
NET POSITION MOVEMENT INDEX:
– 6-Week Change in Strength Index:-2.2-0.742.4


Bitcoin Futures:


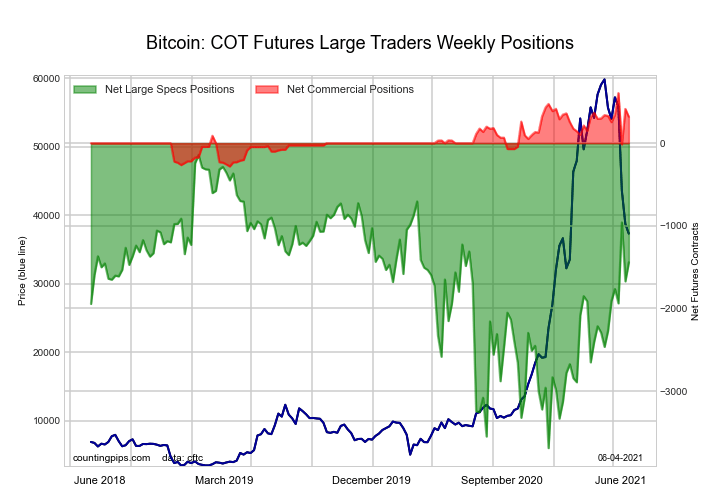
The Bitcoin large speculator standing this week resulted in a net position of -1,672 contracts in the data reported through Tuesday. This was a weekly lowering of -713 contracts from the previous week which had a total of -959 net contracts.

This week’s current strength score (the trader positioning range over the past three years, measured from 0 to 100) shows the speculators are currently Bullish with a score of 56.9 percent. The commercials are Bullish with a score of 78.4 percent and the small traders (not shown in chart) are Bearish with a score of 31.0 percent.

BITCOIN StatisticsSPECULATORSCOMMERCIALSSMALL TRADERS
– Percent of Open Interest Longs:56.57.123.3
– Percent of Open Interest Shorts:75.32.49.2
– Net Position:-1,6724151,257
– Gross Longs:5,0246312,071
– Gross Shorts:6,696216814
– Long to Short Ratio:0.8 to 12.9 to 12.5 to 1
NET POSITION TREND:
– COT Index Score (3 Year Range Pct):56.978.431.0
– COT Index Reading (3 Year Range):BullishBullishBearish
NET POSITION MOVEMENT INDEX:
– 6-Week Change in Strength Index:22.48.4-28.6


Article By CountingPips.comReceive our weekly COT Reports by Email

*COT Report: The COT data, released weekly to the public each Friday, is updated through the most recent Tuesday (data is 3 days old) and shows a quick view of how large speculators or non-commercials (for-profit traders) were positioned in the futures markets.

The CFTC categorizes trader positions according to commercial hedgers (traders who use futures contracts for hedging as part of the business), non-commercials (large traders who speculate to realize trading profits) and nonreportable traders (usually small traders/speculators).

Find CFTC criteria here: (http://www.cftc.gov/MarketReports/CommitmentsofTraders/ExplanatoryNotes/index.htm).

Fibonacci Retracements Analysis 28.05.2021 (AUDUSD, USDCAD)

Article By RoboForex.com

AUDUSD, “Australian Dollar vs US Dollar”

As we can see in the H4 chart, AUDUSD is still consolidating a divergence on MACD and, judging by the fact that the lows are slowly climbing down, may soon break this consolidation range to the downside. And if the first descending correctional wave earlier reached 50.0% fibo, then the next one may head towards 61.8% and 76.0% fibo at 0.7669 and 0.7618 respectively, as well as the low at 0.7532. However, one shouldn’t exclude a possibility of a further uptrend to reach the high at 0.7891.

AUDUSD_H4
Risk Warning: the result of previous trading operations do not guarantee the same results in the future

The H1 chart of UADUSD shows a more detailed structure of the current consolidation. After growing and reaching 61.8% fibo, the pair is moving between the low at 0.7688 and 50.0% fibo. The next rising wave may head towards 76.0% fibo at 0.7842, a breakout of which, in its turn, may lead to a further uptrend to reach the high 0.7891 and the long-term 76.0% fibo at 0.7893. The most probable scenario for the nearest future implies a decline towards the low and 61.8% fibo at 0.7688 and 0.7669 respectively.

AUDUSD_H1
Risk Warning: the result of previous trading operations do not guarantee the same results in the future

USDCAD, “US Dollar vs Canadian Dollar”

In the H4 chart, the pair is still testing the fractal at 1.2061. At the same time, there is a convergence on MACD, which made the price correct upwards and reach 23.6% but failed twice. After finally breaking this level, the asset may continue the correction towards 38.2%, 50.0%, and 61.8% fibo at 1.2258, 1.2334, and 1.2410 respectively. The support is the low at 1.2013.

USDCAD_H4
Risk Warning: the result of previous trading operations do not guarantee the same results in the future

As we can see in the H1 chart, USDCAD is moving sideways. So far, the price is stuck between the low and 23.6% fibo at 1.2013 and 1.2164 respectively.

USDCAD_H1

Article By RoboForex.com

Attention!
Forecasts presented in this section only reflect the author’s private opinion and should not be considered as guidance for trading. RoboForex LP bears no responsibility for trading results based on trading recommendations described in these analytical reviews.

Ichimoku Cloud Analysis 28.05.2021 (EURUSD, NZDCHF, USDJPY)

Article By RoboForex.com

EURUSD, “Euro vs US Dollar”

EURUSD is trading at 1.2177; the instrument is moving inside Ichimoku Cloud, thus indicating a sideways tendency. The markets could indicate that the price may test the cloud’s upside border at 1.2195 and then resume moving downwards to reach 1.2075. Another signal in favor of a further downtrend will be a rebound from the rising channel’s downside border. However, the bearish scenario may be canceled if the price breaks the cloud’s upside border and fixes above 1.2230. In this case, the pair may continue growing towards 1.2345. To confirm further decline, the asset must break the support level and fix below 1.2135, thus breaking the bullish channel.

EURUSD
Risk Warning: the result of previous trading operations do not guarantee the same results in the future

NZDCHF, “New Zealand Dollar vs Swiss Franc”

NZDCHF is trading at 0.6513; the instrument is moving above Ichimoku Cloud, thus indicating an ascending tendency. The markets could indicate that the price may test Tenkan-Sen and Kijun-Sen at 0.6495 and then resume moving upwards to reach 0.6635. Another signal in favor of a further uptrend will be a rebound from the descending channel’s upside border. However, the bullish scenario may no longer be valid if the price breaks the cloud’s downside border and fixes below 0.6435. In this case, the pair may continue falling towards 0.6335.

NZDCHF
Risk Warning: the result of previous trading operations do not guarantee the same results in the future

USDJPY, “US Dollar vs Japanese Yen”

USDJPY is trading at 109.86; the instrument is moving above Ichimoku Cloud, thus indicating an ascending tendency. The markets could indicate that the price may test Tenkan-Sen and Kijun-Sen at 109.45 and then resume moving upwards to reach 110.50. Another signal in favor of a further uptrend will be a rebound from the rising channel’s downside border. However, the bullish scenario may no longer be valid if the price breaks the cloud’s downside border and fixes below 109.05. In this case, the pair may continue falling towards 108.10.

USDJPY

Article By RoboForex.com

Attention!
Forecasts presented in this section only reflect the author’s private opinion and should not be considered as guidance for trading. RoboForex LP bears no responsibility for trading results based on trading recommendations described in these analytical reviews.

The Analytical Overview of the Main Currency Pairs on 2021.05.28

by JustForex

The EUR/USD currency pair

Technical indicators of the currency pair:
  • Prev Open: 1.2191
  • Prev Close: 1.2194
  • % chg. over the last day: +0.02%

Comments from ECB officials seriously weakened the euro’s upward trend. After the correction, the EUR/USD currency pair formed a narrow flat within a wider range. If the price goes up from this flat, the uptrend will continue. If the price goes down by the impulsive move, the alternative scenario will be activated. But given that the accumulation is formed in front of the support level, the probability of a breakdown is higher.

Trading recommendations
  • Support levels: 1.2168, 1.2138, 1.2115, 1.2074, 1.2026, 1.2002, 1.1957
  • Resistance levels: 1.2243, 1.2311

The trend is bullish as the price is still above the priority change level of 1.2168. Now the price is accumulating near the moving average. Under such market conditions, it is better for traders to stay out of position and wait for the price to start moving in one direction.

Alternative scenario: if the price breaks down through the 1.2168 support level and fixes below, the general uptrend is likely to be broken.

EUR/USD
News feed for 2021.05.28:
  • – US Core PCE Price Index (m/m) at 15:30 (GMT+3).

The GBP/USD currency pair

Technical indicators of the currency pair:
  • Prev Open: 1.4118
  • Prev Close: 1.4198
  • % chg. over the last day: +0.56%

There are growing expectations for an interest rate hike from the Bank of England (BoE) in the UK. At the end of Thursday, the British pound has added 0.56% and looks stronger than the euro. The price is now holding near a 3-month high.

Trading recommendations
  • Support levels: 1.4110, 1.4075, 1.3996, 1.3913,1.3835, 1.3801, 1.3756, 1.3690
  • Resistance levels: 1.4207

The trend of the GBP/USD currency pair remains bullish. The price is above the moving average, and the MACD indicator is in the positive area with no signs of reversal. Yesterday, at the end of the trading session, there was an attempt to break through the 1.4110 resistance level and break out of the wide range upwards. But the buyers failed to pass this level at the first attempt. Traders are better to look for buy trades on intraday timeframes.

Alternative scenario: if the price breaks down through the 1.4075 support level and consolidates below, the bullish scenario is likely to be canceled.

GBP/USD
There is no news feed for today.

The USD/JPY currency pair

Technical indicators of the currency pair:
  • Prev Open: 109.09
  • Prev Close: 109.83
  • % chg. over the last day: +0.68%

On Thursday, the USD/JPY currency pair broke through the priority change level and activated an alternative scenario. The mid-term downtrend is broken.

Trading recommendations
  • Support levels: 109.64, 109.32, 109.00, 108.66, 108.44, 108.19, 107.77, 107.47
  • Resistance levels: 109.95, 110.51

At the moment, the mid-term trend has changed to bullish, but the price has strongly deviated from the moving average, and the MACD has grown to its maximum values. Under such market conditions, traders should expect a correction, as the momentum potential is already weak. Traders are better to look for long positions from the support levels.

Alternative scenario: if the price falls below 109.00, the general downtrend is likely to resume.

USD/JPY
There is no news feed for today.

The USD/CAD currency pair

Technical indicators of the currency pair:
  • Prev Open: 1.2119
  • Prev Close: 1.2065
  • % chg. over the last day: -0.45%

On Thursday, the USD/CAD currency pair failed to break through the priority change level of 1.2138 and corrected lower. Now the price has formed a wide range of 1.2032-1.2137. A breakout from this range will activate an alternative scenario and break the medium-term downward dynamics.

Trading recommendations
  • Support levels: 1.2032, 1.1944
  • Resistance levels: 1.2137, 1.2251, 1.2321, 1.2388, 1.2414, 1.2519

At the moment, the price is trading below the middle line, but the local trend line does not allow the sellers to lower the price below. Under such market conditions, traders are better to look for trades on intraday timeframes. But it is worth opening a sell position only after a breakdown of the local trend line.

Alternative scenario: if the price breaks out through the 1.2137 resistance level and fixes above, a local corrective uptrend is likely to form.

USD/CAD
There is no news feed for today.

by JustForex


This article reflects a personal opinion and should not be interpreted as an investment advice, and/or offer, and/or a persistent request for carrying out financial transactions, and/or a guarantee, and/or a forecast of future events.

Today, investors are waiting for the release of personal consumption expenditures (PCE) data to assess inflationary pressures

by JustForex

Against the background of reducing unemployment, the US stock indices rose slightly on Thursday. The S&P 500 Index increased by 0.12% and the Dow Jones Industrials added 0.41%. The indices have remained about at the same level for the last two months. On the one hand, the soft monetary policy from the Fed is pushing the markets up. On the other hand, concerns about high inflation have not gone anywhere. Also, the US Treasury Secretary Janet Yellen noted that the Fed’s interest rate is lagging behind real market rates. With the continuation of discussions on increasing taxes, this situation restrains further growth of indices.

European stock indices are multidirectional for now. The DAX and FTSE 100 have decreased slightly on Thursday, while the French CAC 40 has grown. But the general dynamics of the indices is still upward. In Europe, the expansion of vaccination continues, so investors expect an acceleration of economic recovery in the coming months. European airline stocks are already showing signs of recovery.

Gold prices retain the overall ascending dynamics. Gold gained 0.8% within a week’s time and is demonstrating its fourth consecutive weekly growth. Investors are waiting for the Core Personal Consumption Expenditures data today. Negative statistics will increase the gold prices later on.

Oil continues to rise. At the end of Thursday, “black gold” rose by more than 5%. The market is supported by the increased demand for oil in the US and Europe on the eve of the summer season.

Macroeconomic statistics in Japan were weak. The unemployment rate in Japan rose, while the number of jobs fell in April. Japan’s economy contracted in the first quarter, and many analysts do not expect a quick recovery. In its turn, Asian stock indexes are now highly correlated with the US stock indexes. Special attention is paid to the US policy on stimulus measures from the Biden administration.

Main market quotes:

S&P 500 (F) 4,200.88 4.89 (+0.12%)

Dow Jones 34,464.64 +141.59 (+0.41%)

DAX 15,406.73 -43.99 (-0.28%)

FTSE 100 7,019.67 -7.26 (-0.10%)

USD Index 89.98 -0.06 (-0.07%)

Important events:
  • – US Core PCE Price Index (m/m) at 15:30 (GMT+3).

by JustForex


This article reflects a personal opinion and should not be interpreted as an investment advice, and/or offer, and/or a persistent request for carrying out financial transactions, and/or a guarantee, and/or a forecast of future events.

Trillions and trillions

By Lukman Otunuga Research Analyst, ForexTime

The dollar continues to trade just above strong support as it struggles for direction amid low volatility generally in FX. President Biden is set to release a fully costed budget plan today including $6 trillion in federal spending for the fiscal year 2022 to be raised to $8.2 trillion by 2031. This will leave rather large holes in the annual budget in excess of $1.3 trillion over the next decade.

Of course, what is promised by the new administration and what gets delivered are two different things with the previous Democrat hiding in the mid-term elections after Obama became President firmly on Biden’s radar. It was noticeable that news on the size of the spending triggered a rally in industrial metals.

Vix takes another leg lower

Low volatility is hitting equity markets too with the Vix now below its long-term average. The MSCI World stock index is closing in on its all-time high from early May with higher yields and small caps especially outperforming. Those stocks tied to the reopening of the US economy did well yesterday meaning tech and the Nasdaq underperformed.

GBP rises to the top of the range

Cable outperformed yesterday with a 0.6% gain after outgoing Bank of England policymaker Vlieghe hinted at a rate hike early next year. While he did layout different scenarios for the UK economy including talking about negative rates, the market responded to the hawkish comments most as Vlieghe is typically more dovish so this may give us a sense of where the more moderate MPC member’s outlook lies.

GBP/USD resistance sits firmly around 1.42 with prices having traded in a 1.41-1.42 range over the last week or so. Consolidation near the highs, a “pause for breath” is normally constructive for bulls before an upside breakout but we do have the inflation data out of the US this afternoon to contend with. That said, base effects in the PCE spending and deflator data are well known.

On the GBP side, question marks around the grand and full reopening of the UK (economy) on June 21 may hold the final key with much speculation that it is still in the balance. EUR/GBP moved lower and is now at the bottom of the recent range with last support at the mid-May low at 0.8560 before the cycle lows below 0.85.

Disclaimer: The content in this article comprises personal opinions and should not be construed as containing personal and/or other investment advice and/or an offer of and/or solicitation for any transactions in financial instruments and/or a guarantee and/or prediction of future performance. ForexTime (FXTM), its affiliates, agents, directors, officers or employees do not guarantee the accuracy, validity, timeliness or completeness, of any information or data made available and assume no liability as to any loss arising from any investment based on the same.


Forex-Time-LogoArticle by ForexTime

ForexTime Ltd (FXTM) is an award winning international online forex broker regulated by CySEC 185/12 www.forextime.com

Forex Technical Analysis & Forecast 27.05.2021

Article By RoboForex.com

EURUSD, “Euro vs US Dollar”

After rebounding from 1.2262 and finishing the descending structure at 1.2200, EURUSD is forming a new consolidation range below the latter level. If later the price breaks this range to the upside, the market may form one more ascending structure to reach 1.2230; if to the downside – resume trading downwards with the target at 1.2131.

EURUSD
Risk Warning: the result of previous trading operations do not guarantee the same results in the future

GBPUSD, “Great Britain Pound vs US Dollar”

After completing the descending wave at 1.4170, GBPUSD is expected to consolidate around it. Possibly, today the pair may break the range to the downside and resume falling with the short-term target at 1.4042.

GBPUSD
Risk Warning: the result of previous trading operations do not guarantee the same results in the future

USDRUB, “US Dollar vs Russian Ruble”

USDRUB is still consolidating around 73.70. If later the price breaks this range to the upside, the market may start another correction to reach 74.70; if to the downside – resume trading downwards with the target at 72.22.

USDRUB
Risk Warning: the result of previous trading operations do not guarantee the same results in the future

USDJPY, “US Dollar vs Japanese Yen”

After finishing the ascending impulse at 109.04, USDJPY is consolidating around it. Possibly, the pair may break the range to the upside and form one more ascending structure with the short-term target at 109.38. Later, the market may start a new correction to return to 109.04.

USDJPY
Risk Warning: the result of previous trading operations do not guarantee the same results in the future

USDCHF, “US Dollar vs Swiss Franc”

After completing the ascending wave at 0.8975, USDCHF is forming a new consolidation range around this level. Possibly, today the pair may break the range to the upside and resume trading upwards with the target at 0.9020. After that, the instrument may start another correction to return to 0.8975.

USDCHF
Risk Warning: the result of previous trading operations do not guarantee the same results in the future

AUDUSD, “Australian Dollar vs US Dollar”

AUDUSD has finished the descending wave at 0.7723. Today, the pair may correct to reach 0.7759 and then resume trading downwards with the target at 0.7669.

AUDUSD
Risk Warning: the result of previous trading operations do not guarantee the same results in the future

BRENT

Brent is consolidating below 68.88. If later the price breaks this range to the upside, the market may form one more ascending structure with the target at 72.00 or even reach 74.00; if to the downside – start a new correction towards 66.68.

BRENT
Risk Warning: the result of previous trading operations do not guarantee the same results in the future

XAUUSD, “Gold vs US Dollar”

After finishing the descending impulse at 1897.70, Gold is consolidating around this level. Possibly, the metal may break the range to the downside and resume falling towards 1883.21. After that, the instrument may correct to return to 1897.72.

GOLD
Risk Warning: the result of previous trading operations do not guarantee the same results in the future

S&P 500

The S&P index is still consolidating around 4141.0 without any particular direction. Today, the asset may expand the range up to 4230.1 and then resume trading downwards to reach the downside border of the range at 4080.4. After breaking it, the instrument may continue falling with the target at 3944.4.

S&P 500

Article By RoboForex.com

Attention!
Forecasts presented in this section only reflect the author’s private opinion and should not be considered as guidance for trading. RoboForex LP bears no responsibility for trading results based on trading recommendations described in these analytical reviews.

Japanese Candlesticks Analysis 27.05.2021 (EURUSD, USDJPY, EURGBP)

Article By RoboForex.com

EURUSD, “Euro vs US Dollar”

As we can see in the H4 chart, the uptrend continues. After testing the support area, the pair has formed several reversal patterns, including Doji and Hammer. At the moment, EURUSD may reverse and start a new growth towards the resistance level. In this case, the upside target may be at 1.2295. However, an alternative scenario implies that the price may correct to reach 1.2155 first and then resume growing.

EURUSD
Risk Warning: the result of previous trading operations do not guarantee the same results in the future

USDJPY, “US Dollar vs Japanese Yen”

As we can see in the H4 chart, USDJPY has formed several reversal patterns, such as Hammer and Harami, not far from the support area. At the moment, the asset is reversing. In this case, the upside target is the resistance level at 109.70. At the same time, an opposite scenario implies that the price may start a new pullback towards 108.85 before resuming its ascending tendency.

USDJPY
Risk Warning: the result of previous trading operations do not guarantee the same results in the future

EURGBP, “Euro vs Great Britain Pound”

As we can see in the H4 chart, after forming several reversal patterns, such as Shooting Star, close to the resistance area, EURGBP may reverse and fall to reach the support level. In this case, the downside target may be at 0.8610. Later, the market may break this level and continue falling. Still, there might be an alternative scenario, according to which the asset may correct to reach 0.8565 first and then resume trading downwards.

EURGBP

Article By RoboForex.com

Attention!
Forecasts presented in this section only reflect the author’s private opinion and should not be considered as guidance for trading. RoboForex LP bears no responsibility for trading results based on trading recommendations described in these analytical reviews.

The Analytical Overview of the Main Currency Pairs on 2021.05.27

by JustForex

The EUR/USD currency pair

Technical indicators of the currency pair:
  • Prev Open: 1.2249
  • Prev Close: 1.2192
  • % chg. over the last day: -0.46%

On Wednesday, the EUR/USD currency pair decreased by 0.46% and went back to a wide flat. A strong deviation from the average line played a key role. But the fundamental picture is not in favor of the US dollar, so investors are likely to redeem this corrective movement.

Trading recommendations
  • Support levels: 1.2168, 1.2138, 1.2115, 1.2074, 1.2026, 1.2002, 1.1957
  • Resistance levels: 1.2243, 1.2311

The trend is still bullish. The price is above the priority change level of 1.2168. The MACD indicator has shifted into the negative zone. Under such market conditions, it is better for traders to focus on long positions from the support levels.

Alternative scenario: if the price breaks down through the 1.2168 support level and fixes below, the general uptrend is likely to be broken.

EUR/USD
News feed for 2021.05.27:
  • – US Prelim GDP (q/q) at 15:30 (GMT+3);
  • – US Unemployment Claims (w/w) at 15:30 (GMT+3);
  • – US Home Sales (m/m) at 17:00 (GMT+3).

The GBP/USD currency pair

Technical indicators of the currency pair:
  • Prev Open: 1.4148
  • Prev Close: 1.4116
  • % chg. over the last day: -0.22%

The British pound is still trading inside a wide flat with a range of 1.4110-1.4207. At the moment, the price decreased to the lower border of the corridor, but there was no significant reaction from the buyers.

Trading recommendations
  • Support levels: 1.4110, 1.4075, 1.3996, 1.3913,1.3835, 1.3801, 1.3756, 1.3690
  • Resistance levels: 1.4207

Despite the fact that the price is below the moving average and the MACD indicator is below zero, the trend remains bullish, because the price is above the priority change level of 1.4075. Traders are advised to look for long trades from the lower border of the range, but only after buyers show strong initiative.

Alternative scenario: if the price breaks down through the 1.4075 support level and consolidates below, the bullish scenario is likely to be canceled.

GBP/USD
There is no news feed for today.

The USD/JPY currency pair

Technical indicators of the currency pair:
  • Prev Open: 108.74
  • Prev Close: 109.14
  • % chg. over the last day: +0.37%

On Wednesday, the USD/JPY currency pair broke through and held above the 109.00 upper level of the range, increasing the probability of changing the priority on the H1 timeframe. However, the fundamental indicators play against the dollar index, and considering the high correlation between the US dollar and the Japanese yen, investors expect a further decline in the price.

Trading recommendations
  • Support levels: 109.00, 108.66, 108.44, 108.19, 107.77, 107.47, 107.04
  • Resistance levels: 109.32, 109.64, 109.95, 110.51

On the H1 timeframe, the trend remains bearish, but the buyers are much more aggressive, so this correction movement may turn into a full trend reversal. Under such market conditions, traders can look for both selling from the resistance levels and buying from the support levels. A test of the 109.00 psychological level is very likely.

Alternative scenario: if the price rises above 109.32, the general uptrend is likely to resume.

USD/JPY
There is no news feed for today.

The USD/CAD currency pair

Technical indicators of the currency pair:
  • Prev Open: 1.2065
  • Prev Close: 1.2124
  • % chg. over the last day: +0.49%

The USD/CAD currency pair rose by 0.49% by the end of Wednesday. The price broke out of the range and tested the priority change level of 1.2137. The movement was impulsive, and the price held above the moving average.

Trading recommendations
  • Support levels: 1.2093, 1.2032, 1.1944
  • Resistance levels: 1.2137, 1.2251, 1.2321, 1.2388, 1.2414, 1.2519

At the moment, the price is trading above the moving average, the MACD indicator is in the positive zone, but the price is still below the priority change level of 1.2137. Under such market conditions, traders can work both sides. As the buyer’s pressure is stronger now, it is better to sell from the resistance level after additional confirmations.

Alternative scenario: if the price breaks out through the 1.2137 resistance level and fixes above, a local corrective uptrend is likely to form.

USD/CAD
There is no news feed for today.

by JustForex


This article reflects a personal opinion and should not be interpreted as an investment advice, and/or offer, and/or a persistent request for carrying out financial transactions, and/or a guarantee, and/or a forecast of future events.