by JustForex
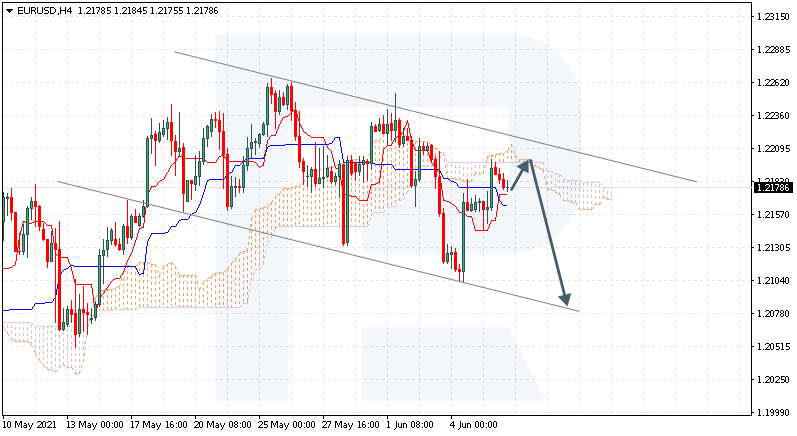
The EUR/USD currency pair
- Prev Open: 1.2189
- Prev Close: 1.2172
- % chg. over the last day: -0.14%
The EUR/USD currency pair has formed a narrow flat inside a wide corridor. Such uncertainty is common before important news releases. The situation is unlikely to change before the ECB interest rate decision, which will be published on Thursday.
- Support levels: 1.2168, 1.2134, 1.2112, 1.2074, 1.2026, 1.2002, 1.1957
- Resistance levels: 1.2212, 1.2243, 1.2311
The price is trading near the moving average line while the MACD indicator has become inactive. The uptrend is likely to resume, but only if the price breaks out through the priority change level of 1.2112. Under such market conditions, traders are better to look for both sell trades from the nearest resistance levels and buy trades from support levels within the upward momentum.
Alternative scenario: if the price breaks out through the 1.2212 resistance level and fixes above, the general uptrend is likely to resume.

- – US 10-y Bond Auction at 20:01 (GMT+3).
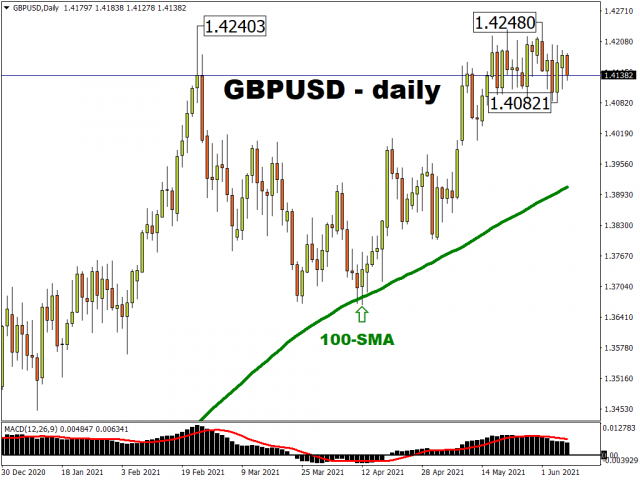
The GBP/USD currency pair
- Prev Open: 1.4179
- Prev Close: 1.4152
- % chg. over the last day: -0.19%
London Interbank Offered Rate (LIBOR) has updated its minimum value again. Against the background of the dollar weakness, this situation plays in favor of the British currency. The GBP/USD currency pair is trading in the middle of a wide corridor, complicating the search for good entry points.
- Support levels: 1.4110, 1.4075, 1.3996, 1.3913,1.3835, 1.3801, 1.3756, 1.3690
- Resistance levels: 1.4191, 1.4212, 1.4338
The price is trading near the moving average, and the MACD indicator has become inactive. The trend of the GBP/USD currency pair remains bullish, as the price is above the priority change level. Under such market conditions, traders are better to look for buy trades from the support levels with the targets on the opposite boundary of the wide corridor with the 1.4107-1.4212 range.
Alternative scenario: if the price breaks down through the 1.4075 support level and consolidates below, the bullish scenario is likely to be canceled.

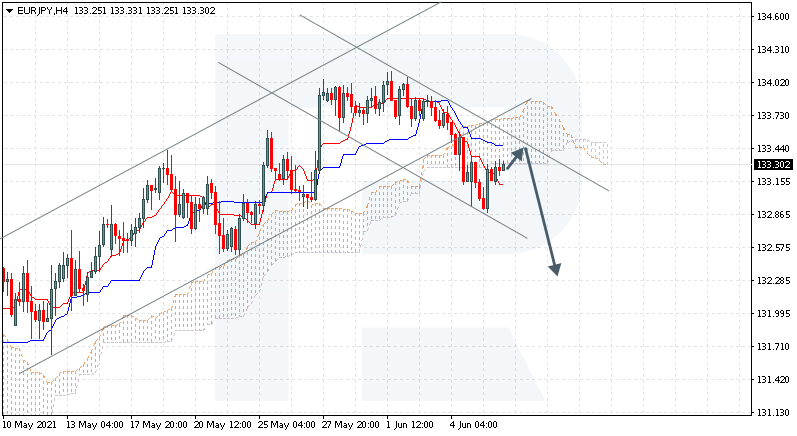
The USD/JPY currency pair
- Prev Open: 109.24
- Prev Close: 109.47
- % chg. over the last day: +0.21%
The USD/JPY currency pair has also formed a narrow price range ahead of Thursday’s inflation (CPI) data. The currency pair is in a contradictory situation right now, as both the Dollar index and the Japanese yen are showing weakness. When both currencies show weakness, the price of the currency pair is usually trading in a corridor.
- Support levels: 109.35, 109.13, 108.66, 108.44, 108.19, 107.77
- Resistance levels: 109.83, 110.09 110.51, 110.73
Technically, the mid-term trend is bullish as the price is above the priority change level of 109.13. The price is trading near the moving average while the MACD indicator is inactive. Under such market conditions, traders are better to look for both buy trades from the nearest support levels and sell trades from resistance levels within the bearish momentum. But it’s better to look for trades on lower timeframes.
Alternative scenario: if the price falls below 109.13, the general downtrend is likely to resume.

The USD/CAD currency pair
- Prev Open: 1.2080
- Prev Close: 1.2115
- % chg. over the last day: +0.29%
The USD/CAD currency pair slowly but surely moves to the priority change level. Yesterday, the price broke out of the narrow range. The interest rate from the Bank of Canada is expected today. Experts believe that the rate will remain the same, but the Canadian dollar is likely to be sensitive to changes in economic forecasts. Many analysts expect a large corrective movement of the USD/CAD pair, and today’s news could trigger a change in priority.
- Support levels: 1.2069, 1.2032, 1.1944
- Resistance levels: 1.2137, 1.2251, 1.2321, 1.2388, 1.2414, 1.2519
Technically, the trend remains bearish. But the current momentum is strictly bullish. Under such market conditions, traders are better to look for both sell trades from the nearest resistance levels and buy trades from support levels, but only on intraday timeframes. Though, it should be noted that the price is still inside a wide corridor with the 1.2032-1.2137 range.
Alternative scenario: if the price breaks out through the 1.2137 resistance level and fixes above, a local corrective uptrend is likely to form.

- – Bank of Canada Rate Statement (m/m) at 17:30 (GMT+3).
by JustForex
This article reflects a personal opinion and should not be interpreted as an investment advice, and/or offer, and/or a persistent request for carrying out financial transactions, and/or a guarantee, and/or a forecast of future events.