Archive for Forex and Currency News – Page 270

Ichimoku Cloud Analysis 07.06.2021 (GBPUSD, XAGUSD, USDCHF)

Article By RoboForex.com

GBPUSD, “Great Britain Pound vs US Dollar”

GBPUSD is trading at 1.4117; the instrument is moving below Ichimoku Cloud, thus indicating a descending tendency. The markets could indicate that the price may test the cloud’s downside border at 1.4155 and then resume moving downwards to reach 1.3995. Another signal in favor of a further downtrend will be a rebound from the rising channel’s downside border. However, the bearish scenario may no longer be valid if the price breaks the cloud’s upside border and fixes above 1.4210. In this case, the pair may continue growing towards 1.4305.

GBPUSD
Risk Warning: the result of previous trading operations do not guarantee the same results in the future

XAGUSD, “Silver vs US Dollar”

XAGUSD is trading at 27.50; the instrument is moving below Ichimoku Cloud, thus indicating a descending tendency. The markets could indicate that the price may test the cloud’s downside border at 27.75 and then resume moving downwards to reach 26.45. Another signal in favor of a further downtrend will be a rebound from the rising channel’s downside border. However, the bearish scenario may no longer be valid if the price breaks the cloud’s upside border and fixes above 28.25. In this case, the pair may continue growing towards 29.35.

SILVER
Risk Warning: the result of previous trading operations do not guarantee the same results in the future

USDCHF, “US Dollar vs Swiss Franc”

USDCHF is trading at 0.8996; the instrument is moving above Ichimoku Cloud, thus indicating an ascending tendency. The markets could indicate that the price may test the cloud’s upside border at 0.8985 and then resume moving upwards to reach 0.9095. Another signal in favor of a further uptrend will be a rebound from the rising channel’s downside border. However, the bullish scenario may no longer be valid if the price breaks the cloud’s downside border and fixes below 0.8965. In this case, the pair may continue falling towards 0.8875. To confirm further growth, the asset must break the descending channel’s upside border and fix above 0.9010.

USDCHF

Article By RoboForex.com

Attention!
Forecasts presented in this section only reflect the author’s private opinion and should not be considered as guidance for trading. RoboForex LP bears no responsibility for trading results based on trading recommendations described in these analytical reviews.

The Analytical Overview of the Main Currency Pairs on 2021.06.07

by JustForex

The EUR/USD currency pair

Technical indicators of the currency pair:
  • Prev Open: 1.2127
  • Prev Close: 1.2166
  • % chg. over the last day: +0.32%

Against the background of positive nonfarm payroll data, the US currency unexpectedly fell on Friday, triggering a sharp rise of the EUR/USD currency pair (inverse correlation). The price returned to a wide range of 1.2134-1.2243 on the impulsive move, forming a false breakdown zone below.

Trading recommendations
  • Support levels: 1.2134, 1.2112, 1.2074, 1.2026, 1.2002, 1.1957
  • Resistance levels: 1.2180, 1.2212, 1.2243, 1.2311

The price has quickly returned to the moving average line, and the MACD indicator is in the positive zone again. The uptrend is likely to resume, but only if the price breaks out through the priority change level of 1.2112. Under such market conditions, traders are better to look for both sell trades from the nearest resistance levels and buy trades from support levels within the upward momentum.

Alternative scenario: if the price breaks out through the 1.2212 resistance level and fixes below, the general uptrend is likely to resume.

EUR/USD
There is no news feed for today.

The GBP/USD currency pair

Technical indicators of the currency pair:
  • Prev Open: 1.4096
  • Prev Close: 1.4158
  • % chg. over the last day: +0.44%

Unlike the euro, the British pound managed to hold above the change priority level and maintain an uptrend. On Friday, the price returned to the wide range of 1.4110-1.4207 on the impulse move, forming a false breakdown zone below.

Trading recommendations
  • Support levels: 1.4110, 1.4075, 1.3996, 1.3913,1.3835, 1.3801, 1.3756, 1.3690
  • Resistance levels: 1.4175, 1.4207, 1.4338

The price is trading near the moving average, and the MACD indicator has become inactive. The trend of the GBP/USD currency pair remains bullish, as the price is above the priority change level. Under such market conditions, traders are better to look for buy trades from the support levels with the targets on the opposite boundary of the corridor.

Alternative scenario: if the price breaks through the 1.4075 support level and consolidates below, the bullish scenario is likely to be canceled.

GBP/USD
There is no news feed for today.

The USD/JPY currency pair

Technical indicators of the currency pair:
  • Prev Open: 110.26
  • Prev Close: 109.51
  • % chg. over the last day: -0.68%

The USD/JPY currency pair is highly correlated with the dollar index. On Thursday, the price fell by 0.68% and lost almost all of Thursday’s gains. If such a bearish dynamic continues, the uptrend will most likely be broken.

Trading recommendations
  • Support levels: 109.35, 109.13, 108.66, 108.44, 108.19, 107.77
  • Resistance levels: 109.83, 110.09 110.51, 110.73

At the moment, the mid-term trend is still bullish as the price is above the priority change level of 109.14. The price is trading near the moving average, and the MACD indicator has gone into the negative area. Under such market conditions, traders are better to look for both buy trades from the nearest support levels and sell trades from resistance levels within the bearish momentum.

Alternative scenario: if the price falls below 109.14, the general downtrend is likely to resume.

USD/JPY
There is no news feed for today.

The USD/CAD currency pair

Technical indicators of the currency pair:
  • Prev Open: 1.2109
  • Prev Close: 1.2074
  • % chg. over the last day: -0.29%

The USD/CAD currency pair decreased by 0.29% on Friday. The Canadian dollar showed the greatest resistance to changes in the dollar index among all major currencies. Buyers are acting much more aggressively, and the price is moving towards the priority change level.

Trading recommendations
  • Support levels: 1.2069, 1.2032, 1.1944
  • Resistance levels: 1.2137, 1.2251, 1.2321, 1.2388, 1.2414, 1.2519

Technically, the trend remains bearish. But taking into account that the local downtrend line was broken by an impulsive move, the current momentum is strictly bullish. Under such market conditions, traders are better to look for both sell trades from the nearest resistance levels and buy trades from support levels, but only on intraday timeframes within the upward momentum. But it should be noted that the price is still inside a wide corridor of 1.2032-1.2137.

Alternative scenario: if the price breaks out through the 1.2137 resistance level and fixes above, a local corrective uptrend is likely to form.

USD/CAD
There is no news feed for today.

by JustForex


This article reflects a personal opinion and should not be interpreted as an investment advice, and/or offer, and/or a persistent request for carrying out financial transactions, and/or a guarantee, and/or a forecast of future events.

Key events this week: US CPI to inflate expectations for Fed tapering?

By Han Tan Market Analyst, ForexTime

US stock futures are little changed at the onset of the new trading week while Asian equities are a mixed bag at the time of writing. US stocks saw a boost from this past Friday’s lower-than-expected US nonfarm payrolls data, pushing the S&P 500 the within 0.06% of its record high from 7 May.

‘Markets Extra’ Podcast: Jobs, jobs, jobs! Why the US nonfarm payrolls are such a big deal

Markets appeared primarily to have latched on to the headline NFP figure of 559,000, which was below the forecasted figure of 675,000.

That jobs report alleviated some of the concerns that the Fed may have to move up its timeline for its eventual tapering of its asset purchases.

That slight respite in the ongoing inflation debate allowed the Nasdaq 100 to claim its biggest single-day gain in two weeks, while the Dollar unwound much of its pre-NFP gains.

Still, there were signs of underlying cost pressures from Friday’s jobs report.

The average hourly earnings of American workers climb by more than expected in May, while the unemployment rate also fell to 5.8% last month, compared to April’s 6.1%.

Although markets were able to ignore such inflation cues for now, focusing instead on the fact that some 7.6 million Americans remain out of work compared to pre-pandemic levels, it does not mean that the inflation debate has disappeared from market chatter.

In fact, this coming Thursday’s US consumer price index announcement could set tongues wagging once more, amidst all the other potential market-moving events lined up over the coming days:

Monday, June 7

  • Germany factory orders

Tuesday, June 8

  • Eurozone Q1 GDP (final)
  • Germany industrial production
  • Japan Q1 GDP (final), trade balance

Wednesday, June 9

  • Bank of Canada rate decision
  • EIA crude oil inventories
  • China CPI, PPI

Thursday, June 10

  • European Central Bank rate decision
  • US-Iran nuclear talks resume
  • OPEC’s monthly Oil Market Report
  • US inflation, initial jobless claims

Friday, June 11

  • G7 summit begins
  • UK industrial production
  • US consumer sentiment

Considering all the inflation markers due mid-week out of the world’s two largest economies (US and China), the ECB meeting is likely to fade into the background.

The European Central Bank is widely expected to leave its bond purchases program unchanged this month.

That sets up the euro to be more reactive to Dollar-events, with EURUSD attempting to take advantage of the dollar’s disappointment following the NFP miss. The world’s most-traded currency pair is trying to reclaim the 1.22 mark, having recently found support at the 1.21 Fibonacci line.

Should the US May consumer price index register a lower month-on-month reading than the forecasted 0.4%, that could prompt investors into thinking that the Fed would be less inclined to adjust their support measures for financial markets. Such a narrative could lead to more weakness in the greenback, which in turn should translate into gains for the rest of the FX universe.


Disclaimer: The content in this article comprises personal opinions and should not be construed as containing personal and/or other investment advice and/or an offer of and/or solicitation for any transactions in financial instruments and/or a guarantee and/or prediction of future performance. ForexTime (FXTM), its affiliates, agents, directors, officers or employees do not guarantee the accuracy, validity, timeliness or completeness, of any information or data made available and assume no liability as to any loss arising from any investment based on the same.


Forex-Time-LogoArticle by ForexTime

ForexTime Ltd (FXTM) is an award winning international online forex broker regulated by CySEC 185/12 www.forextime.com

COT Currency Futures Charts: Pound Sterling, Bitcoin, US Dollar, Euro, Yen, Canadian Dollar, Euro

By CountingPips.com COT Home | Data Tables | Data Downloads | Newsletter

Here are the latest charts and statistics for the Commitment of Traders (COT) data published by the Commodities Futures Trading Commission (CFTC).

The latest COT data is updated through Tuesday June 01 2021 and shows a quick view of how large traders (for-profit speculators and commercial entities) were positioned in the futures markets. All currency positions are in direct relation to the US dollar where, for example, a bet for the euro is a bet that the euro will rise versus the dollar while a bet against the euro will be a bet that the euro will decline versus the dollar.


US Dollar Index Futures:

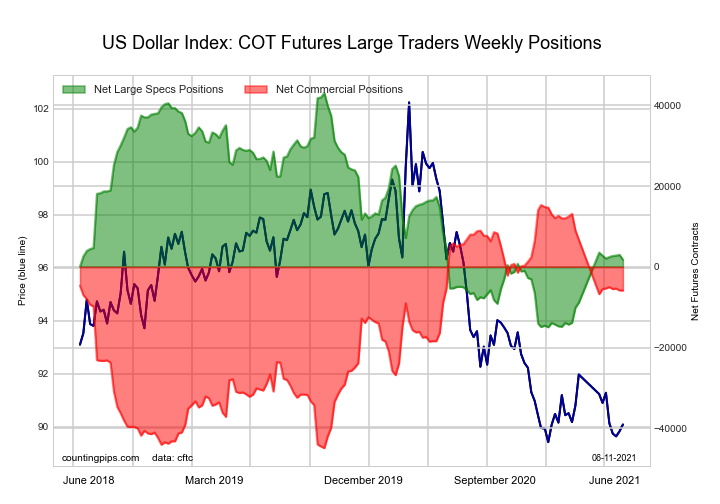
The US Dollar Index large speculator standing this week recorded a net position of 2,963 contracts in the data reported through Tuesday. This was a weekly lift of 183 contracts from the previous week which had a total of 2,780 net contracts.

This week’s current strength score (the trader positioning range over the past three years, measured from 0 to 100) shows the speculators are currently Bearish with a score of 30.9 percent. The commercials are Bullish with a score of 64.9 percent and the small traders (not shown in chart) are Bullish with a score of 56.6 percent.

US DOLLAR INDEX StatisticsSPECULATORSCOMMERCIALSSMALL TRADERS
– Percent of Open Interest Longs:62.913.215.0
– Percent of Open Interest Shorts:56.725.49.0
– Net Position:2,963-5,8342,871
– Gross Longs:30,2126,3577,217
– Gross Shorts:27,24912,1914,346
– Long to Short Ratio:1.1 to 10.5 to 11.7 to 1
NET POSITION TREND:
– COT Index Score (3 Year Range Pct):30.964.956.6
– COT Index Reading (3 Year Range):BearishBullishBullish
NET POSITION MOVEMENT INDEX:
– 6-Week Change in Strength Index:-1.01.5-4.6


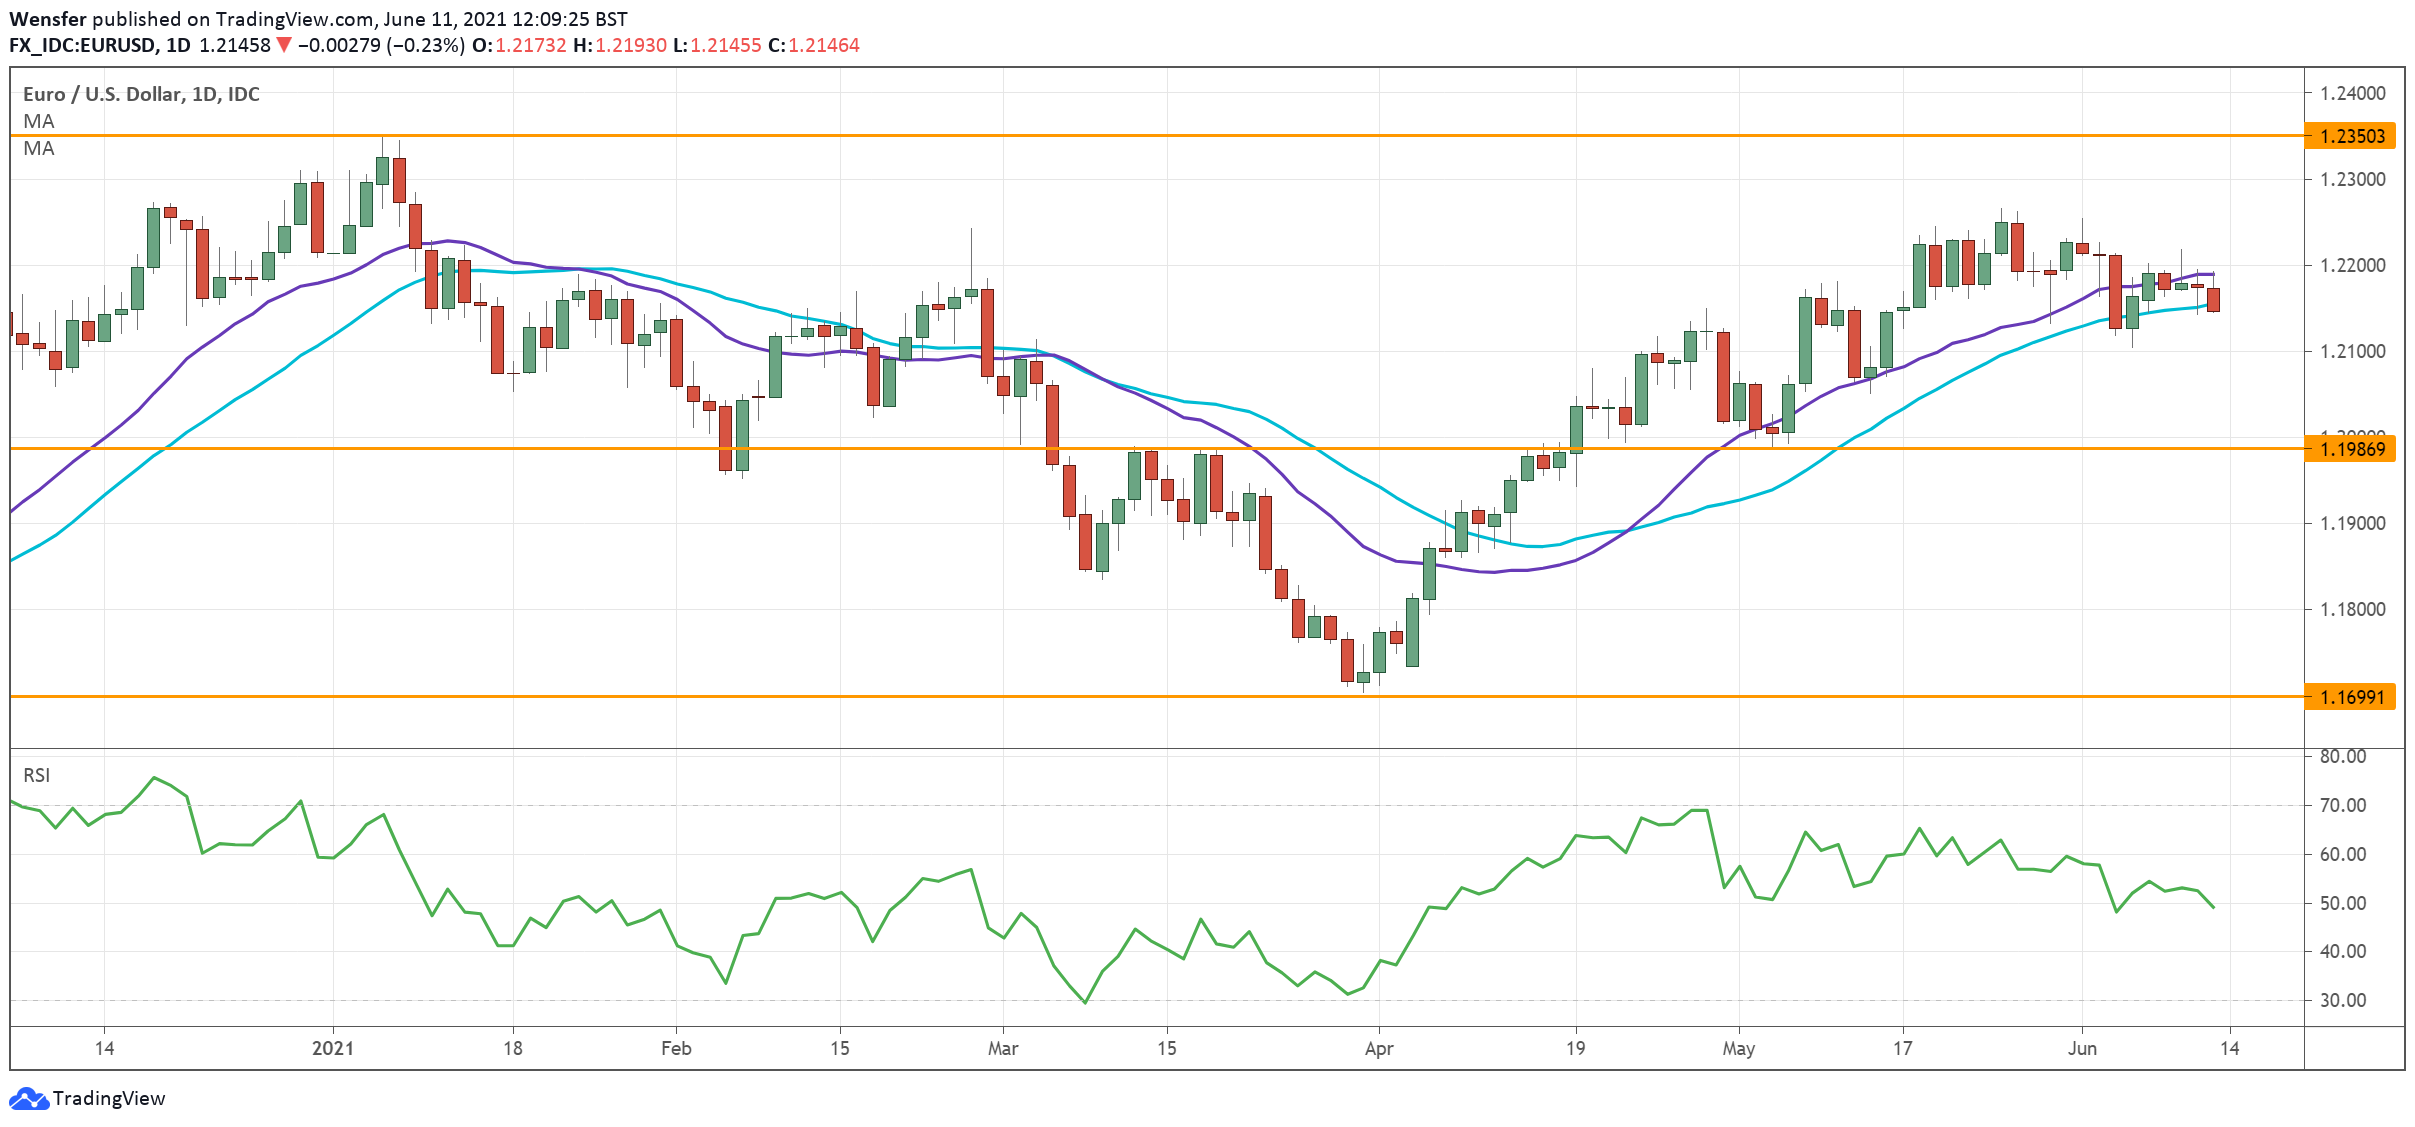
Euro Currency Futures:

The Euro Currency large speculator standing this week recorded a net position of 109,322 contracts in the data reported through Tuesday. This was a weekly increase of 5,322 contracts from the previous week which had a total of 104,000 net contracts.

This week’s current strength score (the trader positioning range over the past three years, measured from 0 to 100) shows the speculators are currently Bullish with a score of 68.6 percent. The commercials are Bearish with a score of 23.9 percent and the small traders (not shown in chart) are Bullish-Extreme with a score of 97.6 percent.

EURO Currency StatisticsSPECULATORSCOMMERCIALSSMALL TRADERS
– Percent of Open Interest Longs:32.051.915.1
– Percent of Open Interest Shorts:17.376.65.1
– Net Position:109,322-183,51474,192
– Gross Longs:237,360384,998112,057
– Gross Shorts:128,038568,51237,865
– Long to Short Ratio:1.9 to 10.7 to 13.0 to 1
NET POSITION TREND:
– COT Index Score (3 Year Range Pct):68.623.997.6
– COT Index Reading (3 Year Range):BullishBearishBullish-Extreme
NET POSITION MOVEMENT INDEX:
– 6-Week Change in Strength Index:8.8-15.336.6


British Pound Sterling Futures:

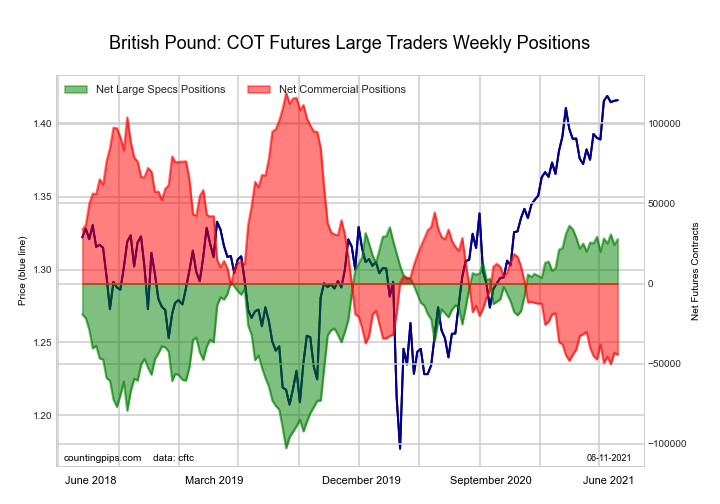
The British Pound Sterling large speculator standing this week recorded a net position of 24,125 contracts in the data reported through Tuesday. This was a weekly decline of -6,534 contracts from the previous week which had a total of 30,659 net contracts.

This week’s current strength score (the trader positioning range over the past three years, measured from 0 to 100) shows the speculators are currently Bullish-Extreme with a score of 91.4 percent. The commercials are Bearish-Extreme with a score of 4.1 percent and the small traders (not shown in chart) are Bullish-Extreme with a score of 95.2 percent.

BRITISH POUND StatisticsSPECULATORSCOMMERCIALSSMALL TRADERS
– Percent of Open Interest Longs:36.838.423.2
– Percent of Open Interest Shorts:23.063.212.2
– Net Position:24,125-43,20019,075
– Gross Longs:64,20467,00440,451
– Gross Shorts:40,079110,20421,376
– Long to Short Ratio:1.6 to 10.6 to 11.9 to 1
NET POSITION TREND:
– COT Index Score (3 Year Range Pct):91.44.195.2
– COT Index Reading (3 Year Range):Bullish-ExtremeBearish-ExtremeBullish-Extreme
NET POSITION MOVEMENT INDEX:
– 6-Week Change in Strength Index:-0.81.2-2.0


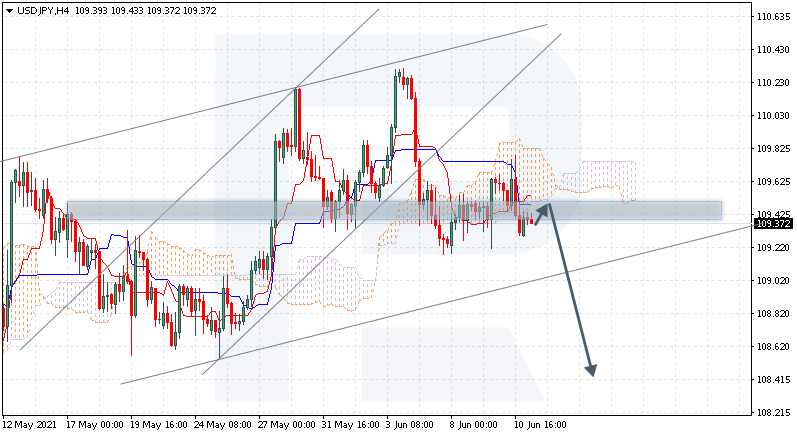
Japanese Yen Futures:

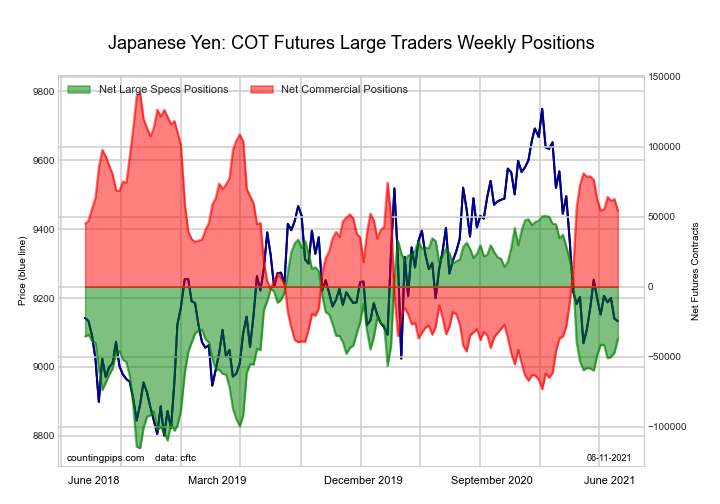
The Japanese Yen large speculator standing this week recorded a net position of -47,115 contracts in the data reported through Tuesday. This was a weekly gain of 3,041 contracts from the previous week which had a total of -50,156 net contracts.

This week’s current strength score (the trader positioning range over the past three years, measured from 0 to 100) shows the speculators are currently Bearish with a score of 41.1 percent. The commercials are Bullish with a score of 64.2 percent and the small traders (not shown in chart) are Bearish with a score of 26.7 percent.

JAPANESE YEN StatisticsSPECULATORSCOMMERCIALSSMALL TRADERS
– Percent of Open Interest Longs:18.268.312.0
– Percent of Open Interest Shorts:47.229.721.6
– Net Position:-47,11562,579-15,464
– Gross Longs:29,462110,69019,467
– Gross Shorts:76,57748,11134,931
– Long to Short Ratio:0.4 to 12.3 to 10.6 to 1
NET POSITION TREND:
– COT Index Score (3 Year Range Pct):41.164.226.7
– COT Index Reading (3 Year Range):BearishBullishBearish
NET POSITION MOVEMENT INDEX:
– 6-Week Change in Strength Index:7.7-6.41.5


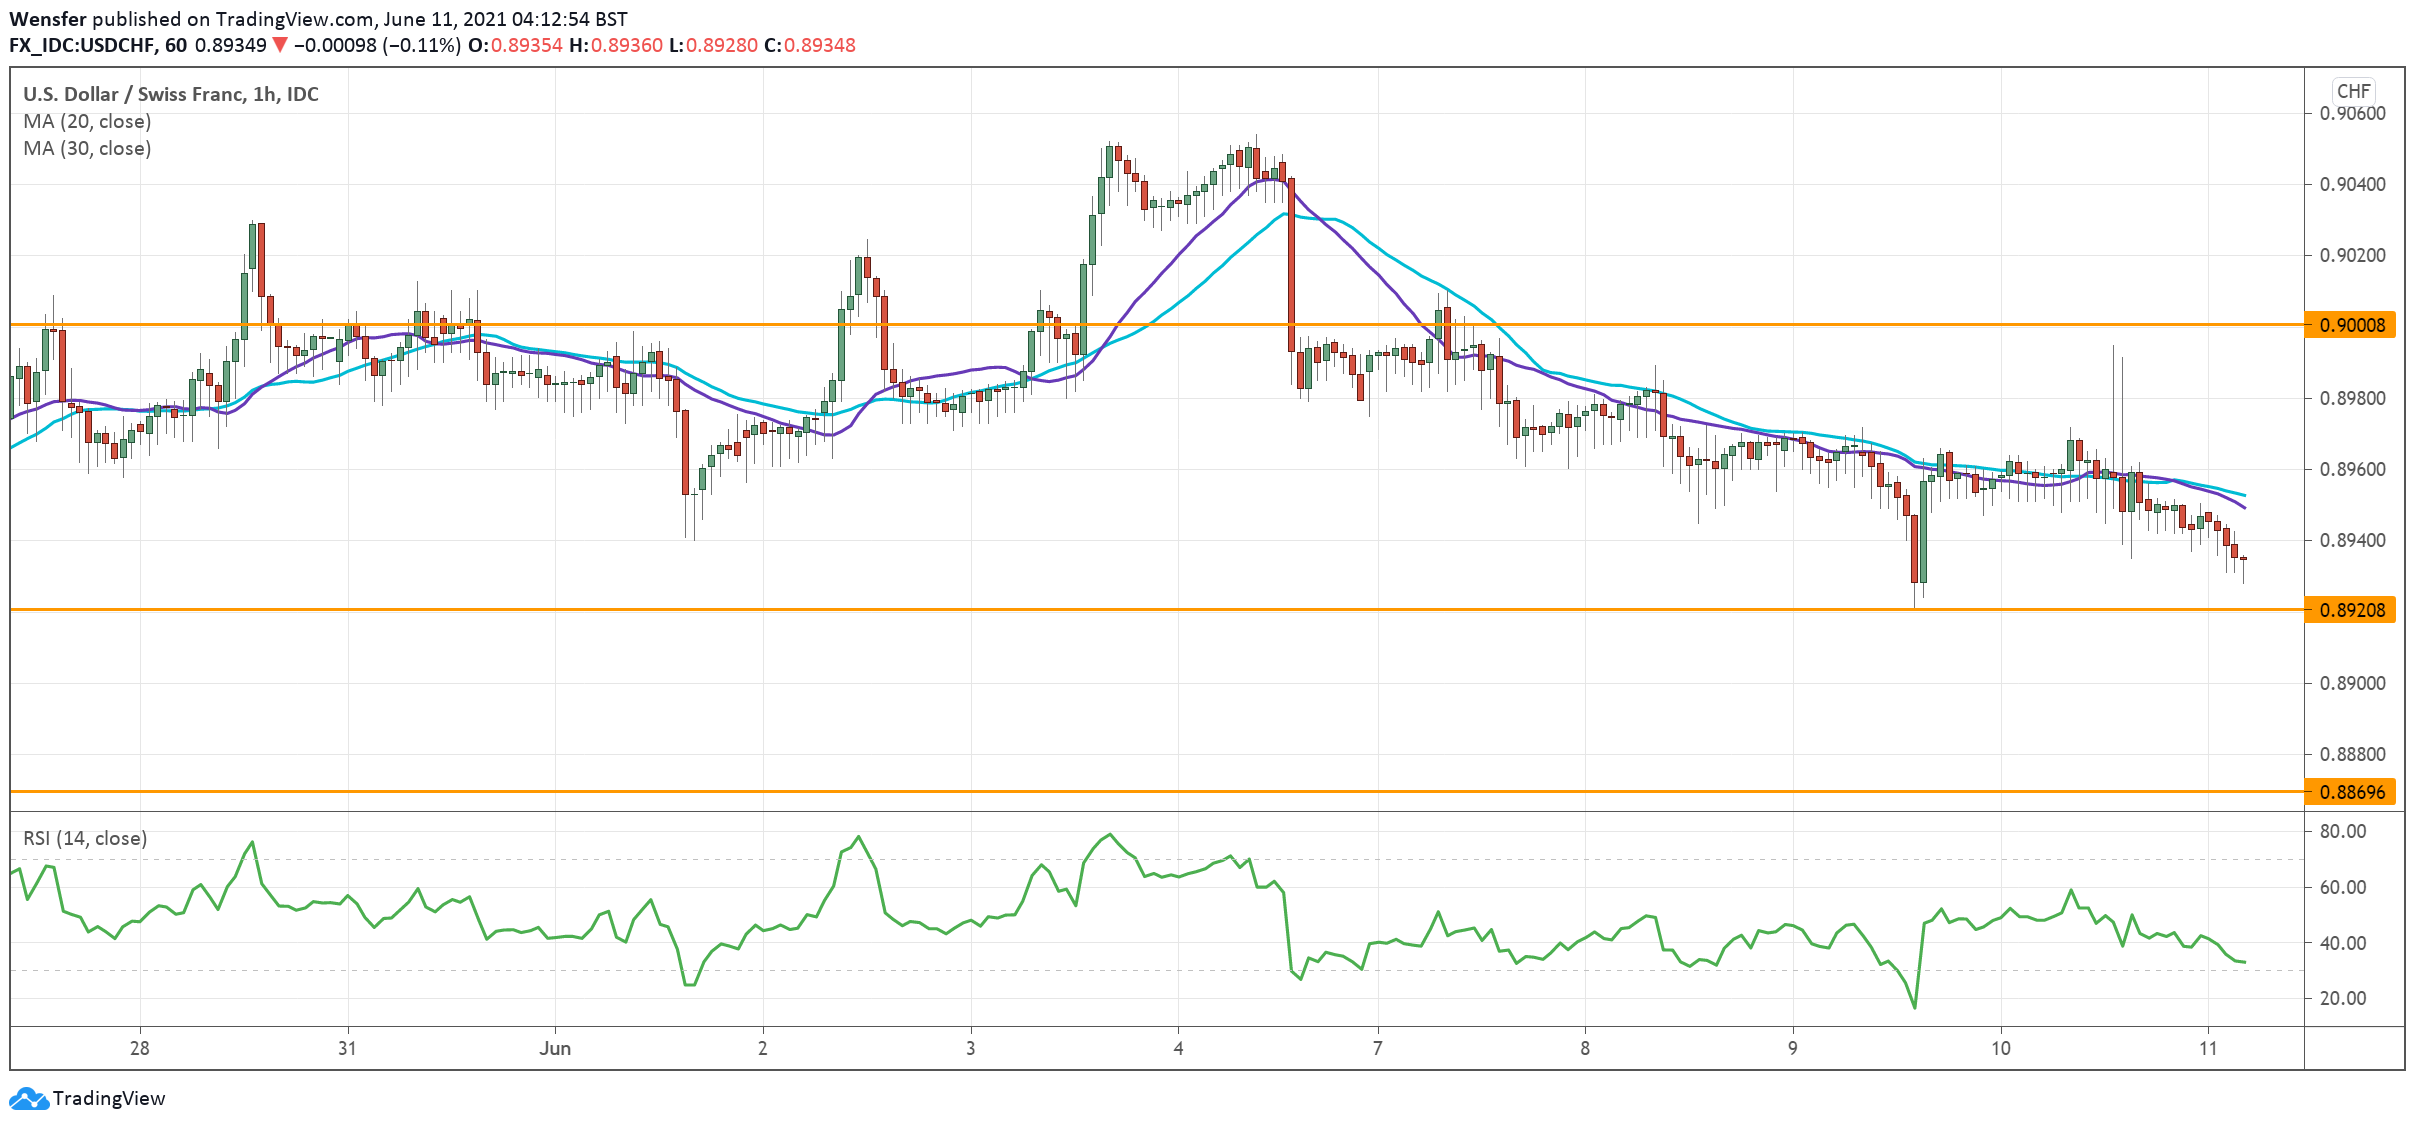
Swiss Franc Futures:

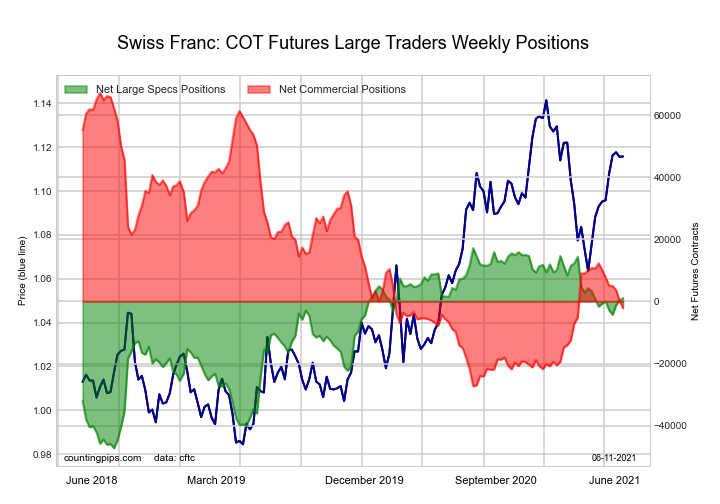
The Swiss Franc large speculator standing this week recorded a net position of 324 contracts in the data reported through Tuesday. This was a weekly lift of 1,527 contracts from the previous week which had a total of -1,203 net contracts.

This week’s current strength score (the trader positioning range over the past three years, measured from 0 to 100) shows the speculators are currently Bullish with a score of 73.8 percent. The commercials are Bearish with a score of 29.0 percent and the small traders (not shown in chart) are Bullish with a score of 64.5 percent.

SWISS FRANC StatisticsSPECULATORSCOMMERCIALSSMALL TRADERS
– Percent of Open Interest Longs:30.337.032.5
– Percent of Open Interest Shorts:29.636.733.5
– Net Position:324139-463
– Gross Longs:13,94017,00814,971
– Gross Shorts:13,61616,86915,434
– Long to Short Ratio:1.0 to 11.0 to 11.0 to 1
NET POSITION TREND:
– COT Index Score (3 Year Range Pct):73.829.064.5
– COT Index Reading (3 Year Range):BullishBearishBullish
NET POSITION MOVEMENT INDEX:
– 6-Week Change in Strength Index:3.1-12.927.8


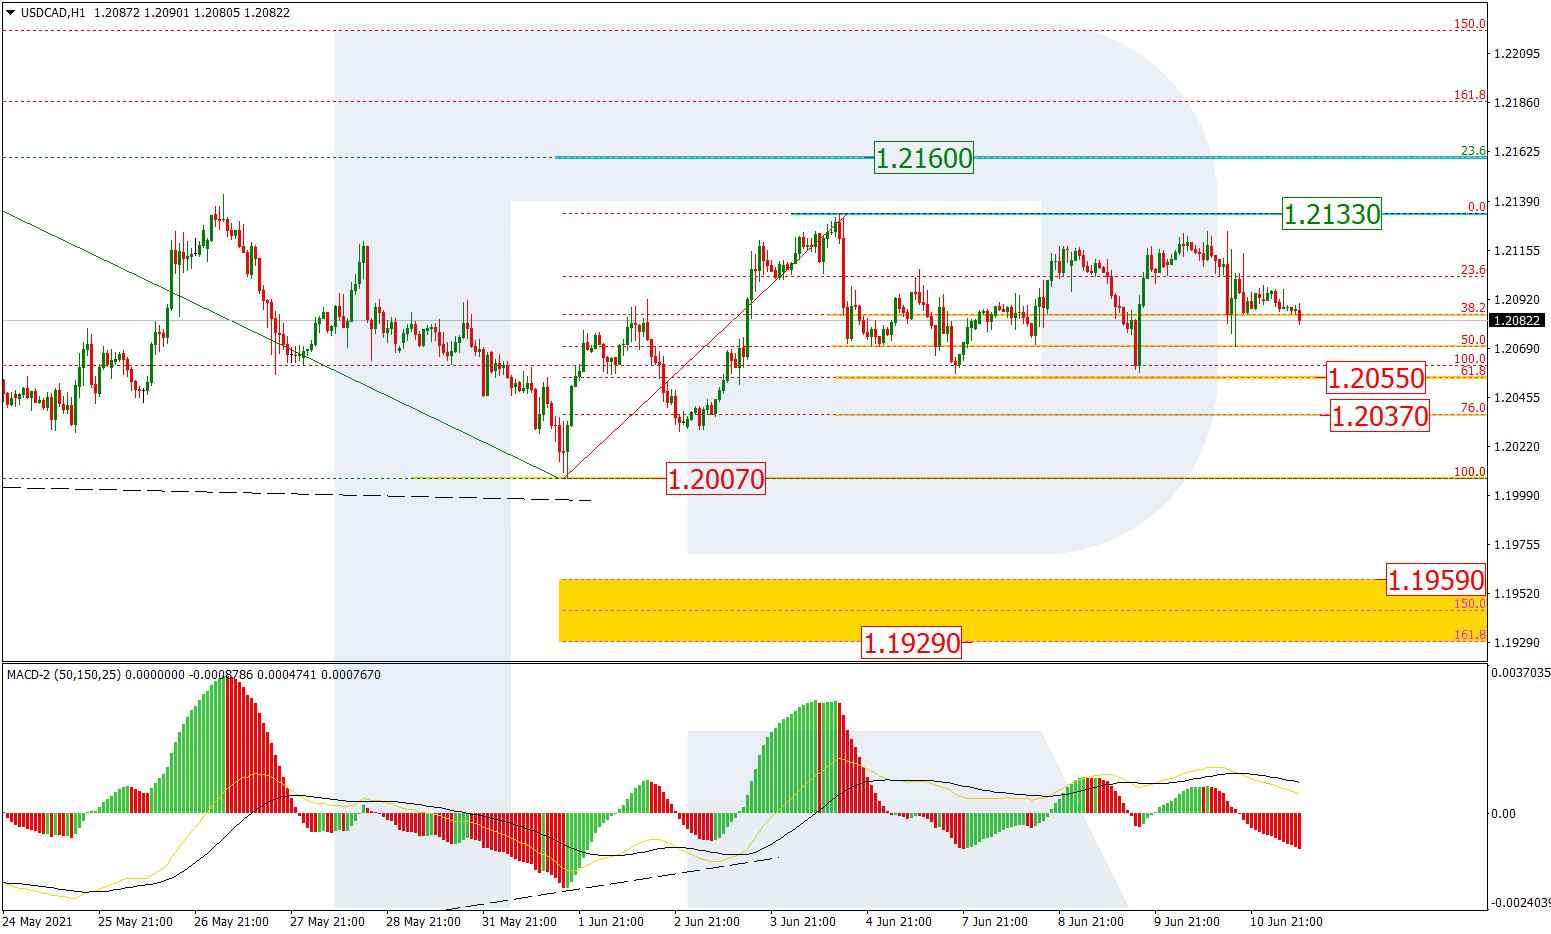
Canadian Dollar Futures:

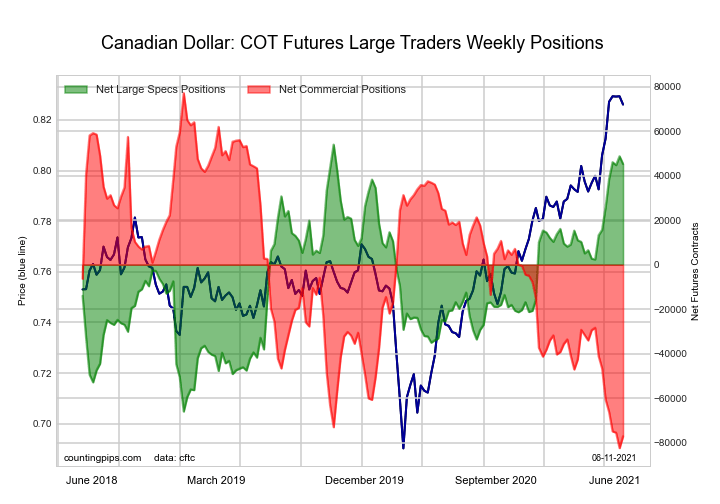
The Canadian Dollar large speculator standing this week recorded a net position of 48,772 contracts in the data reported through Tuesday. This was a weekly gain of 3,961 contracts from the previous week which had a total of 44,811 net contracts.

This week’s current strength score (the trader positioning range over the past three years, measured from 0 to 100) shows the speculators are currently Bullish-Extreme with a score of 95.6 percent. The commercials are Bearish-Extreme with a score of 0.0 percent and the small traders (not shown in chart) are Bullish-Extreme with a score of 97.6 percent.

CANADIAN DOLLAR StatisticsSPECULATORSCOMMERCIALSSMALL TRADERS
– Percent of Open Interest Longs:39.136.422.5
– Percent of Open Interest Shorts:17.872.57.8
– Net Position:48,772-82,48133,709
– Gross Longs:89,46783,44751,491
– Gross Shorts:40,695165,92817,782
– Long to Short Ratio:2.2 to 10.5 to 12.9 to 1
NET POSITION TREND:
– COT Index Score (3 Year Range Pct):95.60.097.6
– COT Index Reading (3 Year Range):Bullish-ExtremeBearish-ExtremeBullish-Extreme
NET POSITION MOVEMENT INDEX:
– 6-Week Change in Strength Index:29.6-25.98.8


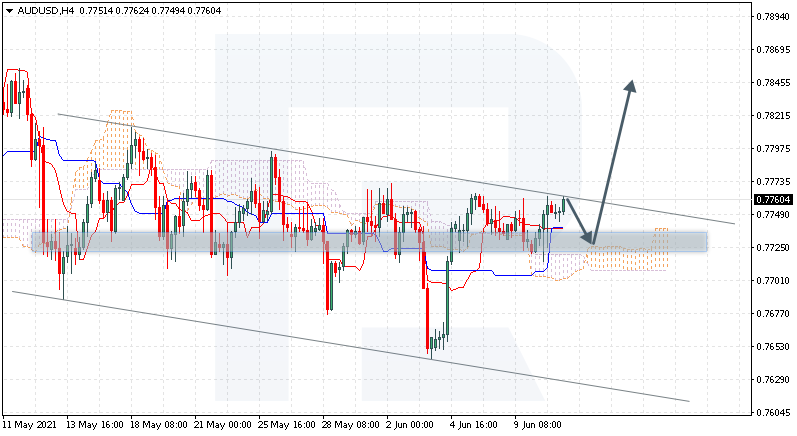
Australian Dollar Futures:

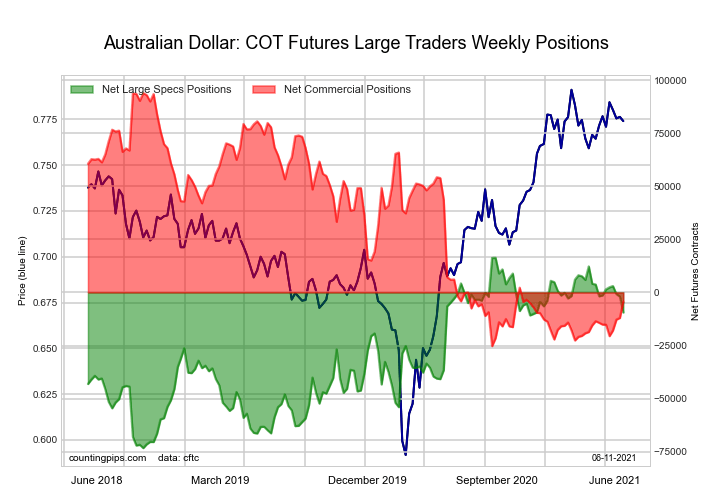
The Australian Dollar large speculator standing this week recorded a net position of -1,925 contracts in the data reported through Tuesday. This was a weekly lowering of -1,116 contracts from the previous week which had a total of -809 net contracts.

This week’s current strength score (the trader positioning range over the past three years, measured from 0 to 100) shows the speculators are currently Bullish with a score of 79.6 percent. The commercials are Bearish-Extreme with a score of 11.1 percent and the small traders (not shown in chart) are Bullish-Extreme with a score of 87.8 percent.

AUSTRALIAN DOLLAR StatisticsSPECULATORSCOMMERCIALSSMALL TRADERS
– Percent of Open Interest Longs:41.035.122.4
– Percent of Open Interest Shorts:42.444.012.0
– Net Position:-1,925-12,01313,938
– Gross Longs:55,38547,41930,225
– Gross Shorts:57,31059,43216,287
– Long to Short Ratio:1.0 to 10.8 to 11.9 to 1
NET POSITION TREND:
– COT Index Score (3 Year Range Pct):79.611.187.8
– COT Index Reading (3 Year Range):BullishBearish-ExtremeBullish-Extreme
NET POSITION MOVEMENT INDEX:
– 6-Week Change in Strength Index:-0.11.9-4.7


New Zealand Dollar Futures:

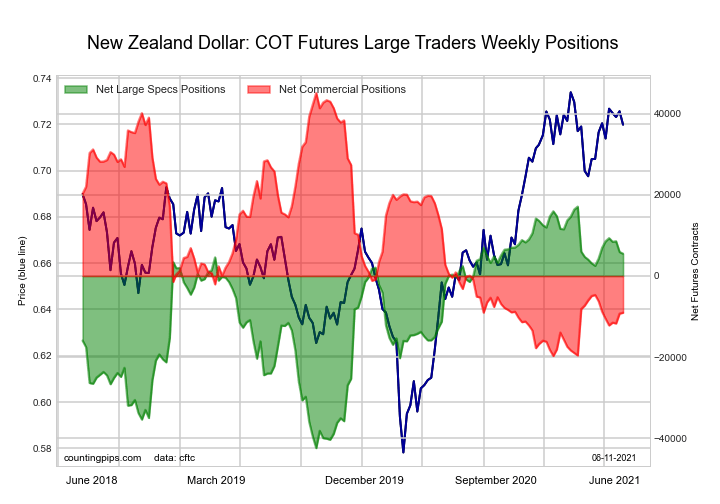
The New Zealand Dollar large speculator standing this week recorded a net position of 5,927 contracts in the data reported through Tuesday. This was a weekly fall of -2,658 contracts from the previous week which had a total of 8,585 net contracts.

This week’s current strength score (the trader positioning range over the past three years, measured from 0 to 100) shows the speculators are currently Bullish-Extreme with a score of 81.2 percent. The commercials are Bearish-Extreme with a score of 16.1 percent and the small traders (not shown in chart) are Bullish-Extreme with a score of 90.6 percent.

NEW ZEALAND DOLLAR StatisticsSPECULATORSCOMMERCIALSSMALL TRADERS
– Percent of Open Interest Longs:53.429.913.3
– Percent of Open Interest Shorts:40.650.06.1
– Net Position:5,927-9,2833,356
– Gross Longs:24,68413,8446,170
– Gross Shorts:18,75723,1272,814
– Long to Short Ratio:1.3 to 10.6 to 12.2 to 1
NET POSITION TREND:
– COT Index Score (3 Year Range Pct):81.216.190.6
– COT Index Reading (3 Year Range):Bullish-ExtremeBearish-ExtremeBullish-Extreme
NET POSITION MOVEMENT INDEX:
– 6-Week Change in Strength Index:2.7-4.716.0


Mexican Peso Futures:

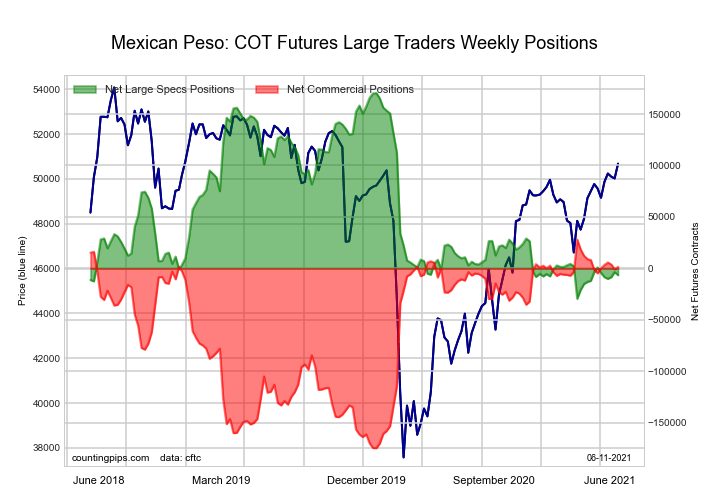
The Mexican Peso large speculator standing this week recorded a net position of -3,646 contracts in the data reported through Tuesday. This was a weekly boost of 4,852 contracts from the previous week which had a total of -8,498 net contracts.

This week’s current strength score (the trader positioning range over the past three years, measured from 0 to 100) shows the speculators are currently Bearish-Extreme with a score of 12.9 percent. The commercials are Bullish-Extreme with a score of 85.8 percent and the small traders (not shown in chart) are Bullish with a score of 61.9 percent.

MEXICAN PESO StatisticsSPECULATORSCOMMERCIALSSMALL TRADERS
– Percent of Open Interest Longs:43.845.94.9
– Percent of Open Interest Shorts:46.146.42.1
– Net Position:-3,646-8084,454
– Gross Longs:69,88073,1727,774
– Gross Shorts:73,52673,9803,320
– Long to Short Ratio:1.0 to 11.0 to 12.3 to 1
NET POSITION TREND:
– COT Index Score (3 Year Range Pct):12.985.861.9
– COT Index Reading (3 Year Range):Bearish-ExtremeBullish-ExtremeBullish
NET POSITION MOVEMENT INDEX:
– 6-Week Change in Strength Index:-0.00.3-2.5


Brazilian Real Futures:

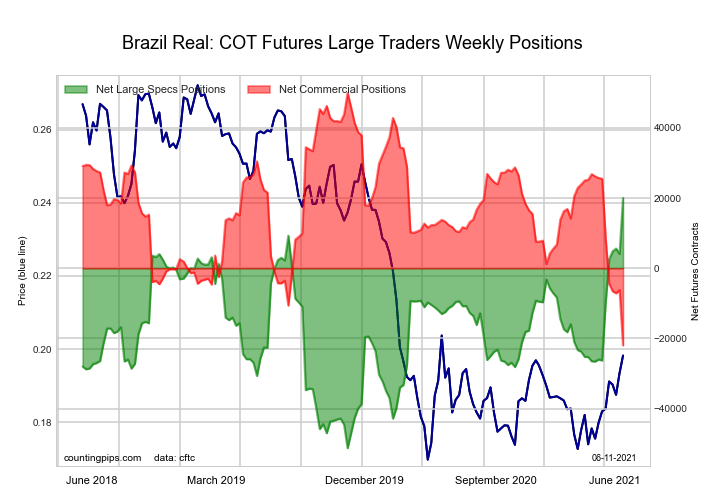
The Brazilian Real large speculator standing this week recorded a net position of 4,088 contracts in the data reported through Tuesday. This was a weekly reduction of -1,519 contracts from the previous week which had a total of 5,607 net contracts.

This week’s current strength score (the trader positioning range over the past three years, measured from 0 to 100) shows the speculators are currently Bullish-Extreme with a score of 91.4 percent. The commercials are Bearish-Extreme with a score of 7.3 percent and the small traders (not shown in chart) are Bullish-Extreme with a score of 98.4 percent.

BRAZIL REAL StatisticsSPECULATORSCOMMERCIALSSMALL TRADERS
– Percent of Open Interest Longs:39.653.96.5
– Percent of Open Interest Shorts:33.762.93.4
– Net Position:4,088-6,2032,115
– Gross Longs:27,32637,1534,468
– Gross Shorts:23,23843,3562,353
– Long to Short Ratio:1.2 to 10.9 to 11.9 to 1
NET POSITION TREND:
– COT Index Score (3 Year Range Pct):91.47.398.4
– COT Index Reading (3 Year Range):Bullish-ExtremeBearish-ExtremeBullish-Extreme
NET POSITION MOVEMENT INDEX:
– 6-Week Change in Strength Index:49.7-52.724.0


Russian Ruble Futures:

The Russian Ruble large speculator standing this week recorded a net position of 4,586 contracts in the data reported through Tuesday. This was a weekly decrease of -786 contracts from the previous week which had a total of 5,372 net contracts.

This week’s current strength score (the trader positioning range over the past three years, measured from 0 to 100) shows the speculators are currently Bearish with a score of 24.2 percent. The commercials are Bullish with a score of 72.9 percent and the small traders (not shown in chart) are Bullish with a score of 73.1 percent.

RUSSIAN RUBLE StatisticsSPECULATORSCOMMERCIALSSMALL TRADERS
– Percent of Open Interest Longs:34.259.06.6
– Percent of Open Interest Shorts:20.974.94.0
– Net Position:4,586-5,498912
– Gross Longs:11,83820,4392,298
– Gross Shorts:7,25225,9371,386
– Long to Short Ratio:1.6 to 10.8 to 11.7 to 1
NET POSITION TREND:
– COT Index Score (3 Year Range Pct):24.272.973.1
– COT Index Reading (3 Year Range):BearishBullishBullish
NET POSITION MOVEMENT INDEX:
– 6-Week Change in Strength Index:-5.43.131.2


Bitcoin Futures:

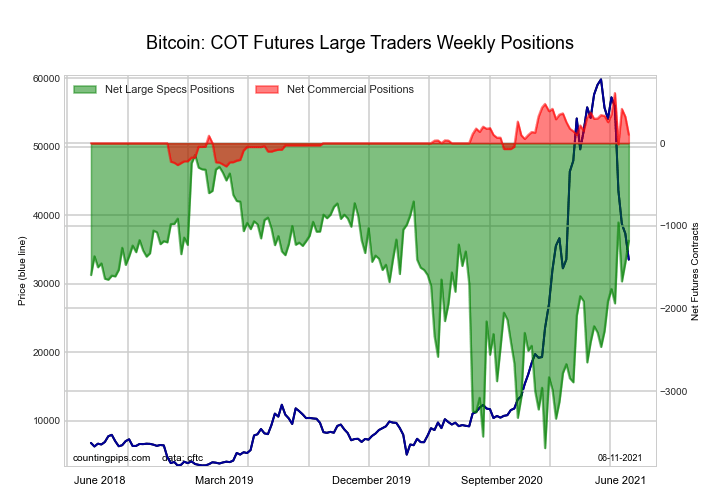
The Bitcoin large speculator standing this week recorded a net position of -1,442 contracts in the data reported through Tuesday. This was a weekly lift of 230 contracts from the previous week which had a total of -1,672 net contracts.

This week’s current strength score (the trader positioning range over the past three years, measured from 0 to 100) shows the speculators are currently Bullish with a score of 63.4 percent. The commercials are Bullish with a score of 67.7 percent and the small traders (not shown in chart) are Bearish with a score of 26.6 percent.

BITCOIN StatisticsSPECULATORSCOMMERCIALSSMALL TRADERS
– Percent of Open Interest Longs:59.76.726.0
– Percent of Open Interest Shorts:79.42.310.6
– Net Position:-1,4423201,122
– Gross Longs:4,3694911,900
– Gross Shorts:5,811171778
– Long to Short Ratio:0.8 to 12.9 to 12.4 to 1
NET POSITION TREND:
– COT Index Score (3 Year Range Pct):63.467.726.6
– COT Index Reading (3 Year Range):BullishBullishBearish
NET POSITION MOVEMENT INDEX:
– 6-Week Change in Strength Index:23.4-1.2-27.0


Article By CountingPips.comReceive our weekly COT Reports by Email

*COT Report: The COT data, released weekly to the public each Friday, is updated through the most recent Tuesday (data is 3 days old) and shows a quick view of how large speculators or non-commercials (for-profit traders) were positioned in the futures markets.

The CFTC categorizes trader positions according to commercial hedgers (traders who use futures contracts for hedging as part of the business), non-commercials (large traders who speculate to realize trading profits) and nonreportable traders (usually small traders/speculators).

Find CFTC criteria here: (http://www.cftc.gov/MarketReports/CommitmentsofTraders/ExplanatoryNotes/index.htm).

Ichimoku Cloud Analysis 04.06.2021 (EURUSD, USDCAD, NZDUSD)

Article By RoboForex.com

EURUSD, “Euro vs US Dollar”

EURUSD is trading at 1.2105; the instrument is moving below Ichimoku Cloud, thus indicating a descending tendency. The markets could indicate that the price may test Tenkan-Sen and Kijun-Sen at 1.2135 and then resume moving downwards to reach 1.1990. Another signal in favor of a further downtrend will be a rebound from the descending channel’s downside border. However, the bearish scenario may be canceled if the price breaks the cloud’s upside border and fixes above 1.2235. In this case, the pair may continue growing towards 1.2325.

EURUSD
Risk Warning: the result of previous trading operations do not guarantee the same results in the future

USDCAD, “US Dollar vs Canadian Dollar”

USDCAD is trading at 1.2122; the instrument is moving above Ichimoku Cloud, thus indicating an ascending tendency. The markets could indicate that the price may test the cloud’s upside border at 1.2100 and then resume moving upwards to reach 1.2210. Another signal in favor of a further uptrend will be a rebound from the upside border of the Triangle pattern. However, the bullish scenario may no longer be valid if the price breaks the cloud’s downside border and fixes below 1.2030. In this case, the pair may continue falling towards 1.1945.

USDCAD
Risk Warning: the result of previous trading operations do not guarantee the same results in the future

NZDUSD, “New Zealand Dollar vs US Dollar”

NZDUSD is trading at 0.7146; the instrument is moving below Ichimoku Cloud, thus indicating a descending tendency. The markets could indicate that the price may test Tenkan-Sen and Kijun-Sen at 0.7190 and then resume moving downwards to reach 0.7035. Another signal in favor of a further downtrend will be a rebound from the descending channel’s upside border. However, the bearish scenario may be canceled if the price breaks the cloud’s upside border and fixes above 0.7285. In this case, the pair may continue growing towards 0.7375.

NZDUSD

Article By RoboForex.com

Attention!
Forecasts presented in this section only reflect the author’s private opinion and should not be considered as guidance for trading. RoboForex LP bears no responsibility for trading results based on trading recommendations described in these analytical reviews.

Fibonacci Retracements Analysis 04.06.2021 (AUDUSD, USDCAD)

Article By RoboForex.com

AUDUSD, “Australian Dollar vs US Dollar”

As we can see in the daily chart, AUDUSD is starting a new correctional downtrend after a divergence on MACD towards 23.6%, 38.2%, and 50.0% fibo at 0.7415, 0.7053, and 0.6757 respectively. After completing this pullback, the instrument may resume growing to break the high at 0.8007 and then reach the long-term 50.0% fibo at 0.8292.

AUDUSD_D1
Risk Warning: the result of previous trading operations do not guarantee the same results in the future

The H4 chart of AUDUSD shows a more detailed structure of the current descending correction, which has already broken 61.8% fibo and may continue towards 76.0% fibo at 0.7618. However, the key downside target is the low at 0.7532. The resistance is the local high at 0.7891.

AUDUSD_H4
Risk Warning: the result of previous trading operations do not guarantee the same results in the future

USDCAD, “US Dollar vs Canadian Dollar”

In the H4 chart, the pair is forming the first rising impulse after updating the low and a convergence on MACD. At the moment, the price is heading towards 23.6% fibo, a breakout of which may lead to a further uptrend to reach 38.2%, 50.0%, and 61.8% fibo at 1.2254, 1.2331, and 1.2407 respectively. The support is the low at 1.2007.

USDCAD_H4
Risk Warning: the result of previous trading operations do not guarantee the same results in the future

The H1 chart shows a steady rising impulse towards 23.6% fibo at 1.2160.

USDCAD_H1

Article By RoboForex.com

Attention!
Forecasts presented in this section only reflect the author’s private opinion and should not be considered as guidance for trading. RoboForex LP bears no responsibility for trading results based on trading recommendations described in these analytical reviews.

The Analytical Overview of the Main Currency Pairs on 2021.06.04

by JustForex

The EUR/USD currency pair

Technical indicators of the currency pair:
  • Prev Open: 1.2210
  • Prev Close: 1.2126
  • % chg. over the last day: -0.69%

In light of positive statistics on the US labor market, the US currency sharply strengthened on Thursday, triggering a fall of the EUR/USD currency pair (inverse correlation). The price broke through the priority change level and activated an alternative scenario. Another portion of important news and speeches is expected today, so volatility will be high.

Trading recommendations
  • Support levels: 1.2115, 1.2074, 1.2026, 1.2002, 1.1957
  • Resistance levels: 1.2134, 1.2168, 1.2180, 1.2212, 1.2243, 1.2311

The uptrend is broken. The price fell and broke through several support levels. The MACD indicator has become negative with no signs of reversal. Under such market conditions, traders are better to look for sell trades from the support levels, but the price has strongly deviated from the moving average now, so there is likely to be a slight upward pullback.

Alternative scenario: if the price breaks out through the 1.2212 resistance level and fixes below, the general uptrend is likely to resume.

EUR/USD
News feed for 2021.06.04:
  • – ECB President Christine Lagarde Speaks at 14:00 (GMT+3);
  • – US Fed Chairman Jerome Powell Speaks at 14:00 (GMT+3);
  • – US ADP Nonfarm Payrolls (m/m) at 15:30 (GMT+3);
  • – US Unemployment Rate (m/m) at 15:30 (GMT+3).

The GBP/USD currency pair

Technical indicators of the currency pair:
  • Prev Open: 1.4167
  • Prev Close: 1.4099
  • % chg. over the last day: -0.48%

The British pound also significantly decreased on Thursday evening. However, unlike the euro, the GBP/USD currency pair did not break the priority change level, leaving a good chance to hold the uptrend. At the moment, the British currency looks more confident than the euro.

Trading recommendations
  • Support levels: 1.4075, 1.3996, 1.3913,1.3835, 1.3801, 1.3756, 1.3690
  • Resistance levels: 1.4110, 1.4175, 1.4207, 1.4338

The price is trading below the moving average, and the MACD indicator has gone into the oversold zone. Despite the falling price, the GBP/USD trend remains bullish since the price is above the priority change level, which is the most important factor. Under such market conditions, traders are better to look for buy trades from the support levels. Intraday traders can look for sell trades within the descending momentum, but taking into account a lot of important news today, it is necessary to act extremely cautiously.

Alternative scenario: if the price breaks through the 1.4075 support level and consolidates below, the bullish scenario is likely to be canceled.

GBP/USD
There is no news feed for today.

The USD/JPY currency pair

Technical indicators of the currency pair:
  • Prev Open: 109.53
  • Prev Close: 110.30
  • % chg. over the last day: +0.70%

On Thursday, the USD/JPY currency pair increased by 0.7%. The Japanese yen now looks extremely weak, so any strengthening of the dollar index affects the pair’s price growth.

Trading recommendations
  • Support levels: 109.90, 109.28, 109.00, 108.66, 108.44, 108.19, 107.77
  • Resistance levels: 110.51, 110.73

At the moment, the mid-term trend is bullish. The price is above the moving average. The MACD indicator is in the overbought zone, but there are no signs of divergence. Under such market conditions, traders are better to look for buy trades from the support levels, relying on the continuation of the price growth. But given the strong deviation from the moving average, a slight pullback down is possible.

Alternative scenario: if the price falls below 109.00, the general downtrend is likely to resume.

USD/JPY
There is no news feed for today.

The USD/CAD currency pair

Technical indicators of the currency pair:
  • Prev Open: 1.2032
  • Prev Close: 1.2108
  • % chg. over the last day: +0.63%

Amid a strengthening dollar, the USD/CAD currency pair also rose on Thursday. Buyers managed to hold the support level of 1.2032. Now, the price is trading near the priority change level but still within the wide corridor. Important macrostatistics from Canada are expected today.

Trading recommendations
  • Support levels: 1.2032, 1.1944
  • Resistance levels: 1.2137, 1.2251, 1.2321, 1.2388, 1.2414, 1.2519

Technically, the trend remains bearish. But taking into account that the local downtrend line was broken by impulse, the current momentum is strictly bullish. Under such market conditions, traders are better to look for both sell trades from the nearest resistance levels and buy trades from support levels, but only on intraday timeframes within the upward momentum. But it should be noted that the price is still inside a wide corridor of 1.2032-1.2137.

Alternative scenario: if the price breaks out through the 1.2137 resistance level and fixes above, a local corrective uptrend is likely to form.

USD/CAD
News feed for 2021.06.04:
  • – Canada Unemployment Rate (m/m) at 15:30 (GMT+3);
  • – Canada Ivey PMI (m/m) at 17:00 (GMT+3).

by JustForex


This article reflects a personal opinion and should not be interpreted as an investment advice, and/or offer, and/or a persistent request for carrying out financial transactions, and/or a guarantee, and/or a forecast of future events.

Positive data from the US indicates quick economic recovery, fueling fears of accelerating inflation

by JustForex

Yesterday, the US Labor Department reported that 978,000 jobs were created in May, far above analysts’ forecasts of 654,000. The average number of initial jobless claims fell from 562,000 to 428,000. On the one hand, these statistics are a good sign of economic recovery. On the other hand, the faster the economy recovers, the more likely the Fed will start to scale back its stimulus measures in order to avoid a further rise in inflation. The non-farm payrolls report is expected to be released today. Positive data could lead to a strengthening of the dollar index. But analysts argue that this report will not be so good.

The stock indices in Europe didn’t show unified dynamics on Thursday. The German DAX increased by 0.19% at the end of the day, while the British FTSE 100 decreased by 0.61%. Investors are awaiting non-farm statistics today to forecast further monetary policy action.

The US oil inventories fell by 5.1 million barrels last week, and this resulted in the falling of the oil prices. However, experts believe that the fall in oil prices is temporary, as increased demand for oil in the summer season will make the “black gold” quotes move higher.

The US Treasury yields jumped yesterday, and that has sharply decreased gold prices. Gold futures with August delivery are currently trading at $1,873.55 per troy ounce. Despite the correction, analysts believe in further growth of precious metals prices.

Major indices of the Asia-Pacific region show mixed dynamics at the opening of trading on Friday. Japan’s Nikkei opened with a 0.51% decline while China’s Shanghai Composite decreased by 0.27%. Australia’s ASX 200 index increased by 0.06%. Asian stock indices are now strongly correlated with the US market, so significant price changes in America today, with a high probability, will have an impact on Asia as well.

Main market quotes:

S&P 500 (F) 4,192.85 -15.27 (-0.36%)

Dow Jones 34,577.04 -23.34 (-0.07%)

DAX 15,632.67 +29.96 (+0.19%)

FTSE 100 7.064.35 -43.65 (-0.61%)

USD Index 90.49 +0.58 (+0.64%)

Important events:
  • – RBNZ Gov Adrian Orr Speaks at 10:00 (GMT+3);
  • – SNB Chairman Thomas Jordan Speaks at 10:00 (GMT+3);
  • – ECB President Christine Lagarde Speaks at 14:00 (GMT+3);
  • – US Fed Chair Jerome Powell Speaks at 14:00 (GMT+3);
  • – US ADP Nonfarm Payrolls (m/m) at 15:30 (GMT+3);
  • – US Unemployment Rate (m/m) at 15:30 (GMT+3);
  • – Canada Unemployment Rate (m/m) at 15:30 (GMT+3);
  • – Canada Ivey PMI (m/m) at 17:00 (GMT+3).

by JustForex


This article reflects a personal opinion and should not be interpreted as an investment advice, and/or offer, and/or a persistent request for carrying out financial transactions, and/or a guarantee, and/or a forecast of future events.

Dollar higher ahead of NFP

By Lukman Otunuga Research Analyst, ForexTime

We’ve written extensively about the key jobs data release later today which should influence both the next Fed meeting in less than two weeks and so where markets may go for the foreseeable future. Last month’s disappointing print set the trading tone for May and this report should be similar. Grab the popcorn (courtesy of AMC?) and get ready for a rollercoaster ride at 12.30pm GMT.

The “whisper number” for the headline number has now risen to 790k while the range of estimates among analysts is from 400k to one million job gains.

Labour market detail

What the job numbers will give us are fresh details about the severity of the supply-demand mismatch for workers and if the causes for last month’s miss remain valid. These include worker worries about catching Covid, continued home schooling and older workers who’ve decided not to return to the workplace.

Broader labour shortages stemming from the overly generous expanded benefits programme will also be a focus, with over 20 Republican states announcing an early scaling back of support of the unemployed ahead of the September expiry. This phasing out, vaccination progress and stimulus checks being spent might see labour shortages disappear quickly.

Buck moving off the lows

The greenback moved sharply higher yesterday and is also bid today, perhaps due to short covering ahead of the event, but also due to the weekly initial jobless claims falling below 400k for the first time since the pandemic began. The ADP number came in way above expectations too, but this is not a great predictor for the headline NFP.

This all means we may need a print above one million to lift the dollar some more, while anything in the range of the whisper number may see low volatility after the initial knee-jerk reactions by all the trading machines.

USD/JPY nearing highs

One currency major very closely tied with today’s data release will be USD/JPY as US bond yields are strongly (negatively) correlated with the yen. This means USD/JPY rises when Treasury yields rise as the yen weakens. This is exactly what we saw yesterday with the dollar gaining as US 10-year yields pushed above 1.60%.

USD/JPY is now currently trading above 110 and around last week’s high at 110.19. Bullish momentum has picked up and the next target is the year-to-date high at 110.96 while support sits at this week’s low at 109.33 and the 50-day SMA just below here.

Disclaimer: The content in this article comprises personal opinions and should not be construed as containing personal and/or other investment advice and/or an offer of and/or solicitation for any transactions in financial instruments and/or a guarantee and/or prediction of future performance. ForexTime (FXTM), its affiliates, agents, directors, officers or employees do not guarantee the accuracy, validity, timeliness or completeness, of any information or data made available and assume no liability as to any loss arising from any investment based on the same.


Forex-Time-LogoArticle by ForexTime

ForexTime Ltd (FXTM) is an award winning international online forex broker regulated by CySEC 185/12 www.forextime.com

Fibonacci Retracements Analysis 03.06.2021 (Brent, Dow Jones)

Article By RoboForex.com

Brent

In the H4 chart, after completing the correctional downtrend at 50.0% fibo, Brent is steadily growing and has already broken both highs, local and long-term, at 69.97 and 71.07 respectively. Later, the market may continue growing to reach the post-correctional extension area between 138.2% and 161.8% fibo at 72.05 and 73.33 respectively. The support is the local low at 64.50.

BRENT_H4
Risk Warning: the result of previous trading operations do not guarantee the same results in the future

The H1 chart shows a more detailed structure of the current uptrend. At the same time, there is a divergence on MACD, which may hint at a possible pullback after the pair tests the upside border of the post-correctional extension area between 138.2% and 161.8% fibo at 72.05 and 73.33 respectively. The correctional targets may be 23.6%, 38.2%, 50.0%, and 61.8% fibo at 71.25, 69.95, 68.91, and 67.88 respectively.

BRENT_H1
Risk Warning: the result of previous trading operations do not guarantee the same results in the future

Dow Jones

As we can see in the H4 chart, Dow Jones is slowing down a bit on its way towards the high at 35102.0. After completing the correction to the downside, the asset is moving upwards and has already reached 76.0% fibo. This rising wave is heading to break the high and then enter the post-correctional extension area between 138.2% and 161.8% fibo at 35786.0 and 36210.0 respectively. However, an alternative scenario implies a rebound from the high and a new mid-term correctional downtrend to break the low at 33295.0 and then mid-term 23.6% and 38.2% fibo at 32970.0 and 31651.0 respectively.

DOWJONES_H4
Risk Warning: the result of previous trading operations do not guarantee the same results in the future

The H1 chart shows potential downside targets after a local divergence on MACD. The resistance is at 34856.2, At the moment, the index is falling and approaching 23.6% fibo at 34488.0. The next downside targets may be 38.2%, 50.0%, 61.8%, and 76.0% fibo at 34260.0, 34076.0, 33893.0, and 33670.0 respectively. Still, the key downside target is the local support at 33295.0.

DOWJONES_H1

Article By RoboForex.com

Attention!
Forecasts presented in this section only reflect the author’s private opinion and should not be considered as guidance for trading. RoboForex LP bears no responsibility for trading results based on trading recommendations described in these analytical reviews.