During the first quarter of the year the trend in the dollar index was positive, but the months of April and May saw it lose 2.11% and 1.40% respectively against the main currencies, reaching quarterly lows at $89.50, starting a lateral movement between these lows and $90.57 in the vicinity of its average of 40 sessions.
Attention in the foreign exchange market remains focused on possible measures and changes that the Federal Reserve may undertake to deal with rising inflation in the United States. This was brought about by the economic recovery and consumption growth, thanks to the advanced vaccination process, as a change in policies and an eventual rise in interest rates could boost the dollar.
At the moment, the month of June is reaching its equator with a rise of 0.51% in the dollar index.
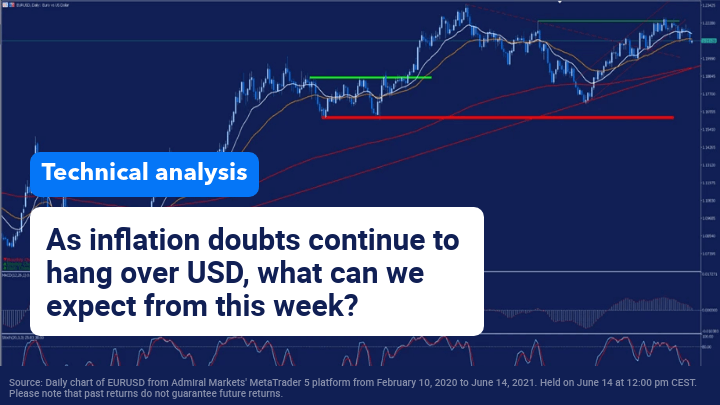
EURUSD Analysis
If at the beginning of the month the market was watching for the unemployment data, last week, the focus was on inflation in the United States. This data was published last Thursday, and we could see that it soared to 5% year-on-year, exceeding market expectations, setting the core CPI at 3.8%.
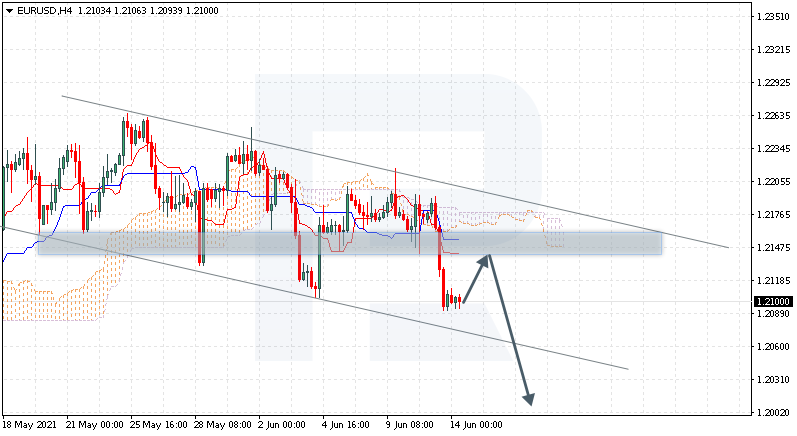
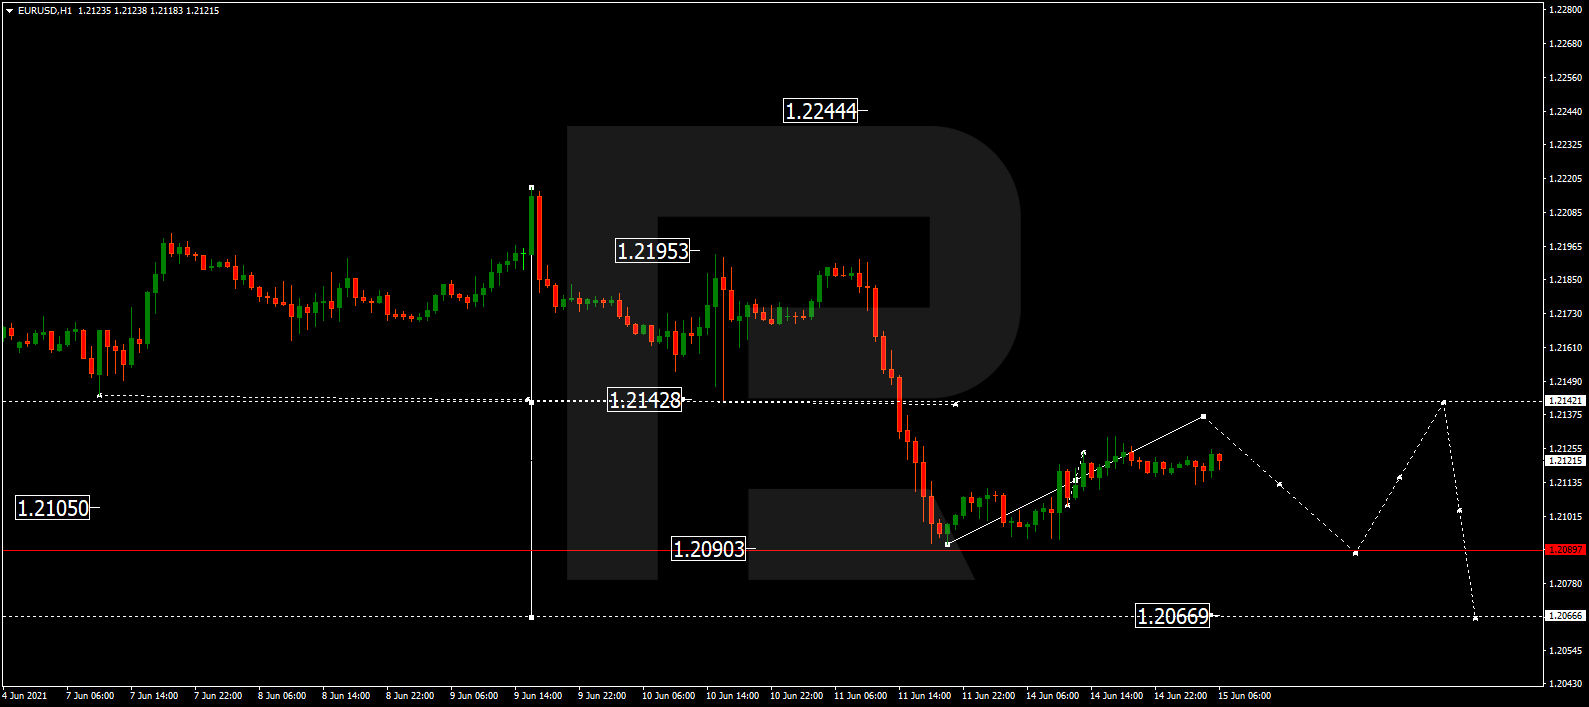
Technically speaking, if we look at the weekly chart, it seems that EURUSD has slowed at the level of 1.2240, forming a double a double ceiling (green) that has caused the price to lose in the final stretch of last week its averages of 18 and 40 sessions. Consequently, this confirms the break of the bullish channel that it has been following over the past few weeks.
Moreover, the loss of these levels can cause a further correction in search of your long-term trend line and your average of 200 sessions.
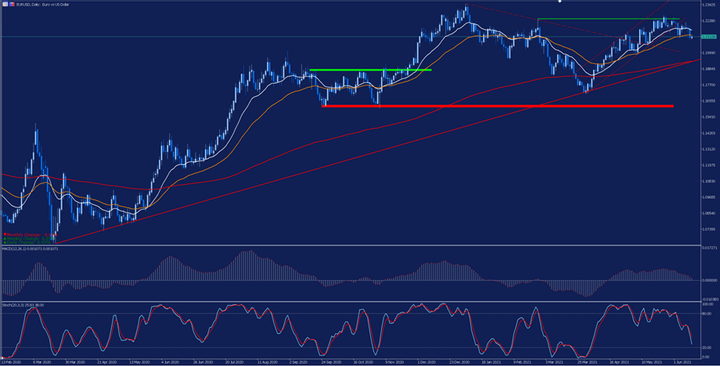 Source: Daily chart of EURUSD from Admiral Markets’ MetaTrader 5 platform from February 10, 2020 to June 14, 2021. Held on June 14 at 12:00 pm CEST. Please note that past returns do not guarantee future returns.
Evolution of the last 5 years:
- 2020 = +8,93%
- 2019 = -2.21%
- 2018 = -4.47%
- 2017 = +14.09%
- 2016 = -3.21%
GBPUSD Analysis
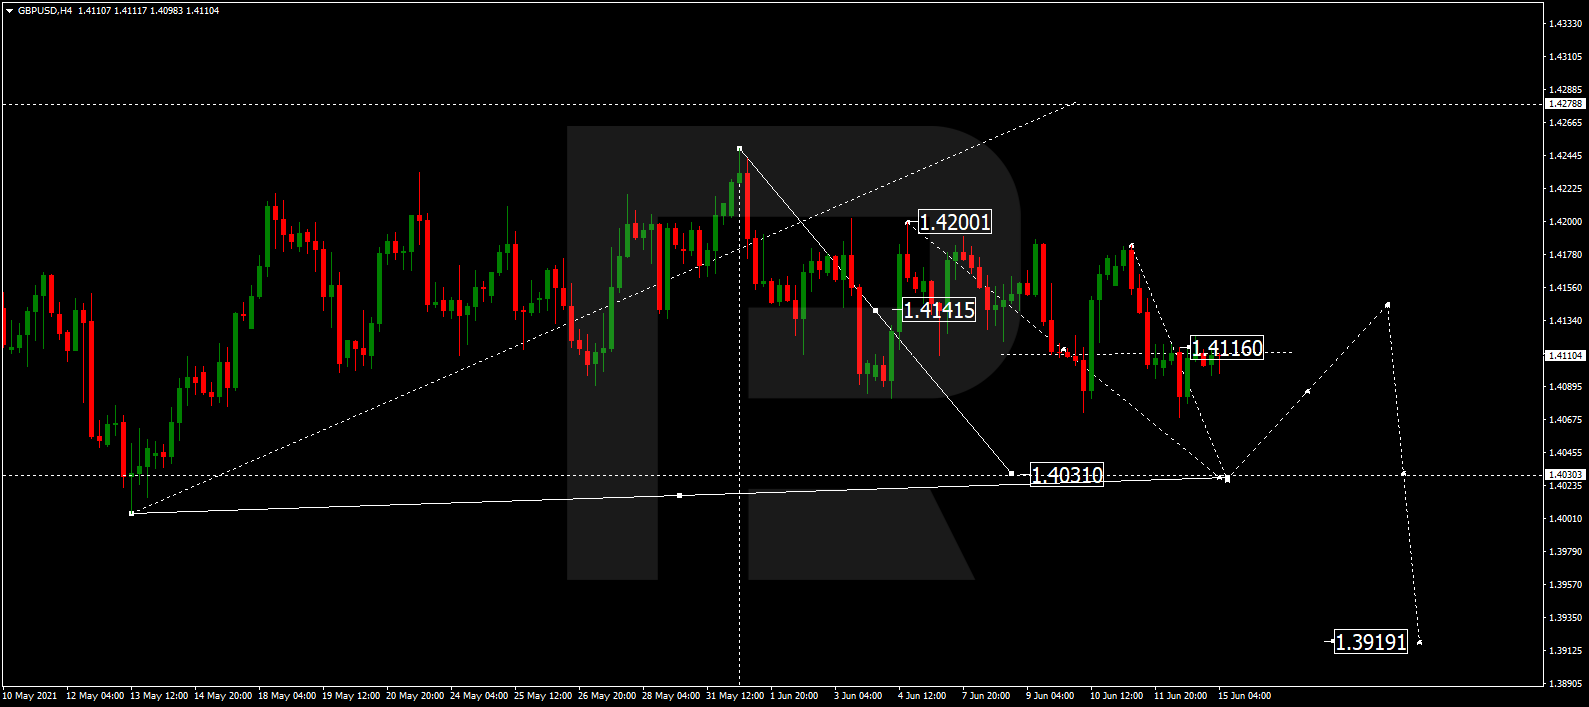
In the case of GBPUSD, we can see that this pair is following a very clear upward trend since it marked lows on March 20, 2020 around the level of 1.14100 to almost reach the level of 1.42400, which has led it to exceed its long-term downtrend line (in red).
As we can see in the weekly chart, after marking highs last February, EURUSD price began a correction that led it to lose the important level of 1.40 in search of its average of 18 sessions where it has found an important point of support to start a new momentum. This has led it to exceed not only the level of 1.40 but to form a double roof in the area of annual highs (in green).
This double-ceiling formation can, in turn, cause a price correction in search of your average of 18 sessions that currently acts as your first support level. As long as the price does not lose its average of 18 the feeling will remain upward. The definitive loss of 1.40 and the average of 18 would open the door to further correction to the previous support/resistance level in the red.
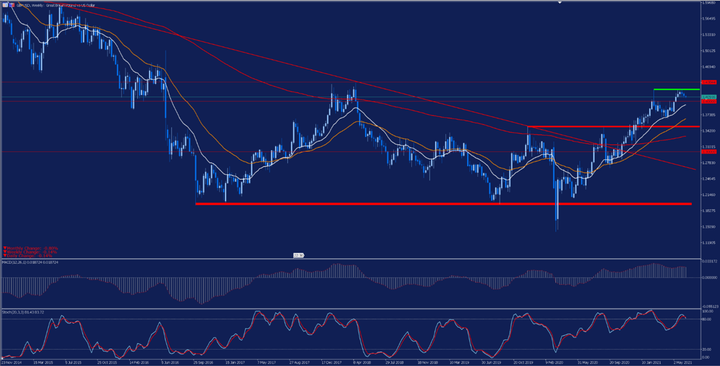 Source: Weekly chart of GBPUSD on Admiral Markets’ MetaTrader 5 platform from November 23, 2014 to June 14, 2021. Held on June 14 at 12:05 pm CEST. Please note that past returns do not guarantee future returns.
Evolution of the last 5 years:
- 2020 = +3.10%
- 2019 = +3.95%
- 2018 = -5.54%
- 2017 = +9.43%
- 2016 = -16.26%
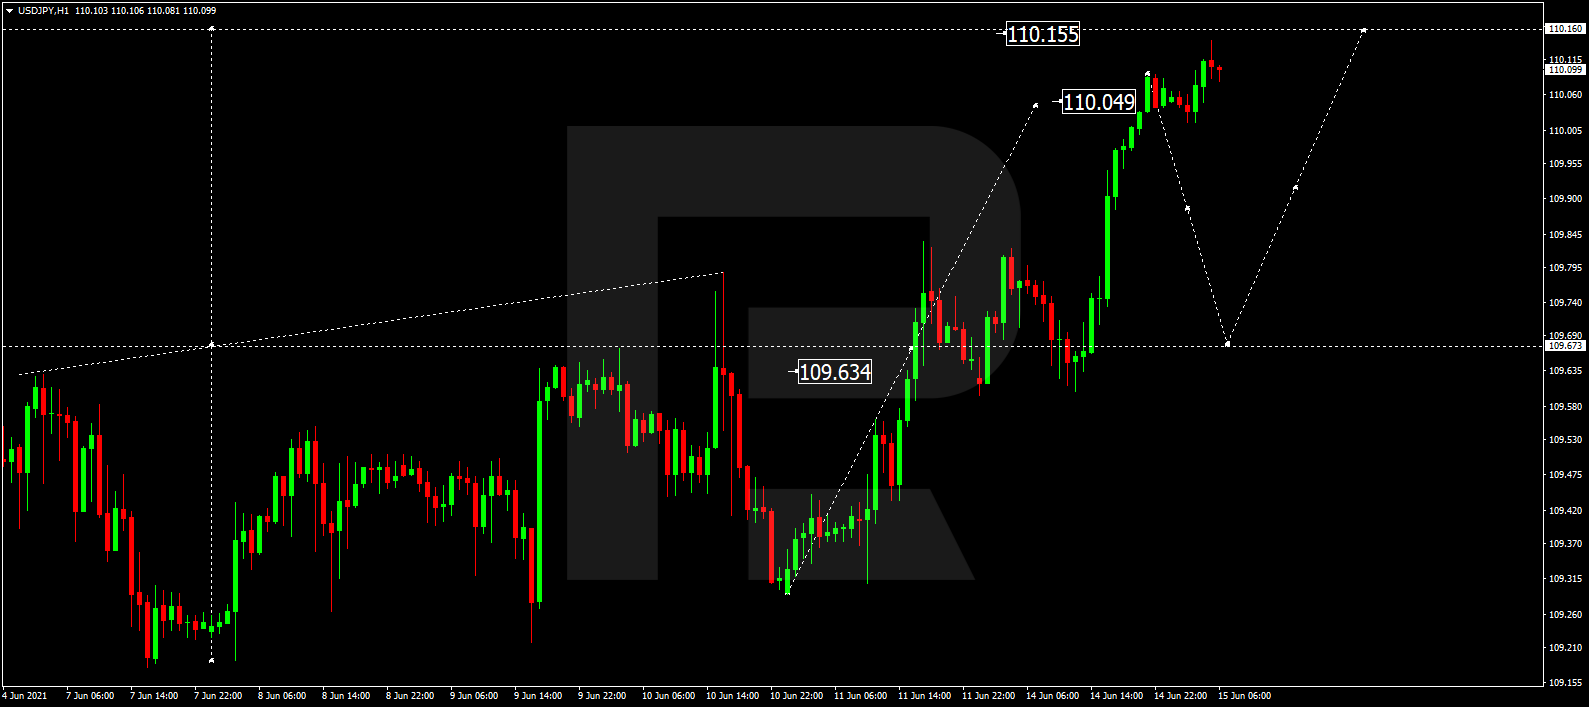
USDJPY Analysis
Finally, if we look at USDJPY, we can see how the Japanese yen was one of the big losers from the rises in the dollar, since during the rises in February and March it went from trading at levels close to 102,700 to trading at levels close to 111,000. As we can see from the weekly chart, after facing its important support level for a long time (represented by the red band), the price definitely bounced to above the average of 200 in the red and the long-term downtrend line.
But as we have mentioned before, since April the dollar has again given ground against its competitors, so the pair retreated to its average of 18 weeks where it found a point of support to continue with the rises.
Technically speaking, we will have to be very attentive to the evolution of the quote in the coming weeks, because if the price manages to recover the level of 110,000 it could find a new upward momentum in search of the annual highs. Breaking these highs could open a bullish rally in search of the upper side channel band in green. On the contrary, if the price re-enters lower levels, we could get a greater correction.
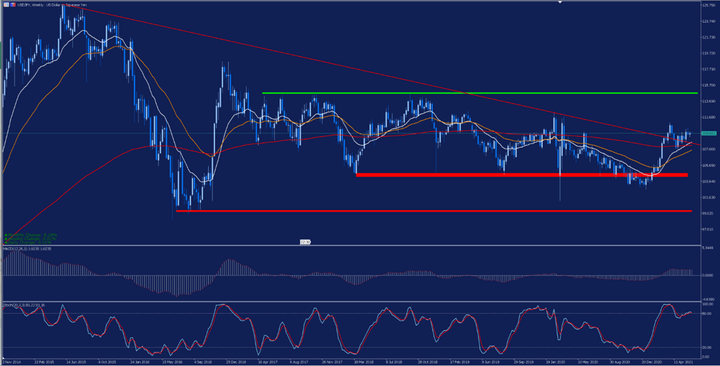 Source: Weekly chart of USDJPY on Admiral Markets’ MetaTrader 5 platform from October 12, 2014 to June 14, 2021. Held on June 14 at 12:10 p.m. CEST. Please note that past returns do not guarantee future returns.
Evolution of the last 5 years:
- 2020 = -4,95%
- 2019 = -0,88%
- 2018 = -2,76%
- 2017 = -3,59%
- 2016 = -2,85%
With the Admirals Trade.MT5 account, you can trade Contracts for Differences (CFDs) of EURUSD, GBPUSD, USDJPY and more than 3000 stocks! CFDs allow traders to try to profit from the bull and bear markets, as well as the use of leverage. Click on the following banner to open an account today:

INFORMATION ABOUT ANALYTICAL MATERIALS:
The given data provides additional information regarding all analysis, estimates, prognosis, forecasts, market reviews, weekly outlooks or other similar assessments or information (hereinafter “Analysis”) published on the websites of Admiral Markets investment firms operating under the Admiral Markets trademark (hereinafter “Admiral Markets”) Before making any investment decisions please pay close attention to the following:
- This is a marketing communication. The content is published for informative purposes only and is in no way to be construed as investment advice or recommendation. It has not been prepared in accordance with legal requirements designed to promote the independence of investment research, and that it is not subject to any prohibition on dealing ahead of the dissemination of investment research.
- Any investment decision is made by each client alone whereas Admiral Markets shall not be responsible for any loss or damage arising from any such decision, whether or not based on the content.
- With view to protecting the interests of our clients and the objectivity of the Analysis, Admiral Markets has established relevant internal procedures for prevention and management of conflicts of interest.
- The Analysis is prepared by an independent analyst, Roberto Rojas (analyst), (hereinafter “Author”) based on their personal estimations.
- Whilst every reasonable effort is taken to ensure that all sources of the content are reliable and that all information is presented, as much as possible, in an understandable, timely, precise and complete manner, Admiral Markets does not guarantee the accuracy or completeness of any information contained within the Analysis.
- Any kind of past or modeled performance of financial instruments indicated within the content should not be construed as an express or implied promise, guarantee or implication by Admiral Markets for any future performance. The value of the financial instrument may both increase and decrease and the preservation of the asset value is not guaranteed.
- Leveraged products (including contracts for difference) are speculative in nature and may result in losses or profit. Before you start trading, please ensure that you fully understand the risks involved.


 Source: Daily chart of EURUSD from Admiral Markets’ MetaTrader 5 platform from February 10, 2020 to June 14, 2021. Held on June 14 at 12:00 pm CEST. Please note that past returns do not guarantee future returns.
 Source: Weekly chart of GBPUSD on Admiral Markets’ MetaTrader 5 platform from November 23, 2014 to June 14, 2021. Held on June 14 at 12:05 pm CEST. Please note that past returns do not guarantee future returns.
 Source: Weekly chart of USDJPY on Admiral Markets’ MetaTrader 5 platform from October 12, 2014 to June 14, 2021. Held on June 14 at 12:10 p.m. CEST. Please note that past returns do not guarantee future returns.