By Lukman Otunuga Research Analyst, ForexTime
After blockbuster US inflation numbers and the ECB avoiding taper talk, stock markets hit all-time highs in the US with large cap growth stocks outperforming all other sectors as bond yields touched three-month lows. Declining rates are a boon to interest rate sensitive stocks like tech and investors have been moving out of value and into the growth sector for the whole of this week with the Nasdaq gaining 0.8% yesterday while the Dow edged higher by 0.1%.

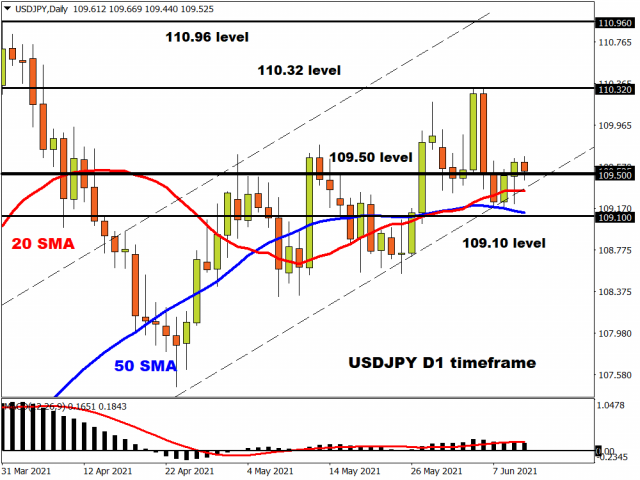
Yesterday’s consensus-busting CPI data was boosted by hefty contributions in used car prices and airline ticket prices which analysts are seeing as short-term in nature – “transitory” in the Fed’s words! Bond markets are certainly taking this view as the market has concluded that enough inflation risk is now discounted. This should see more pressure on the dollar which continues to trade around 90 after a few narrow range days this week.

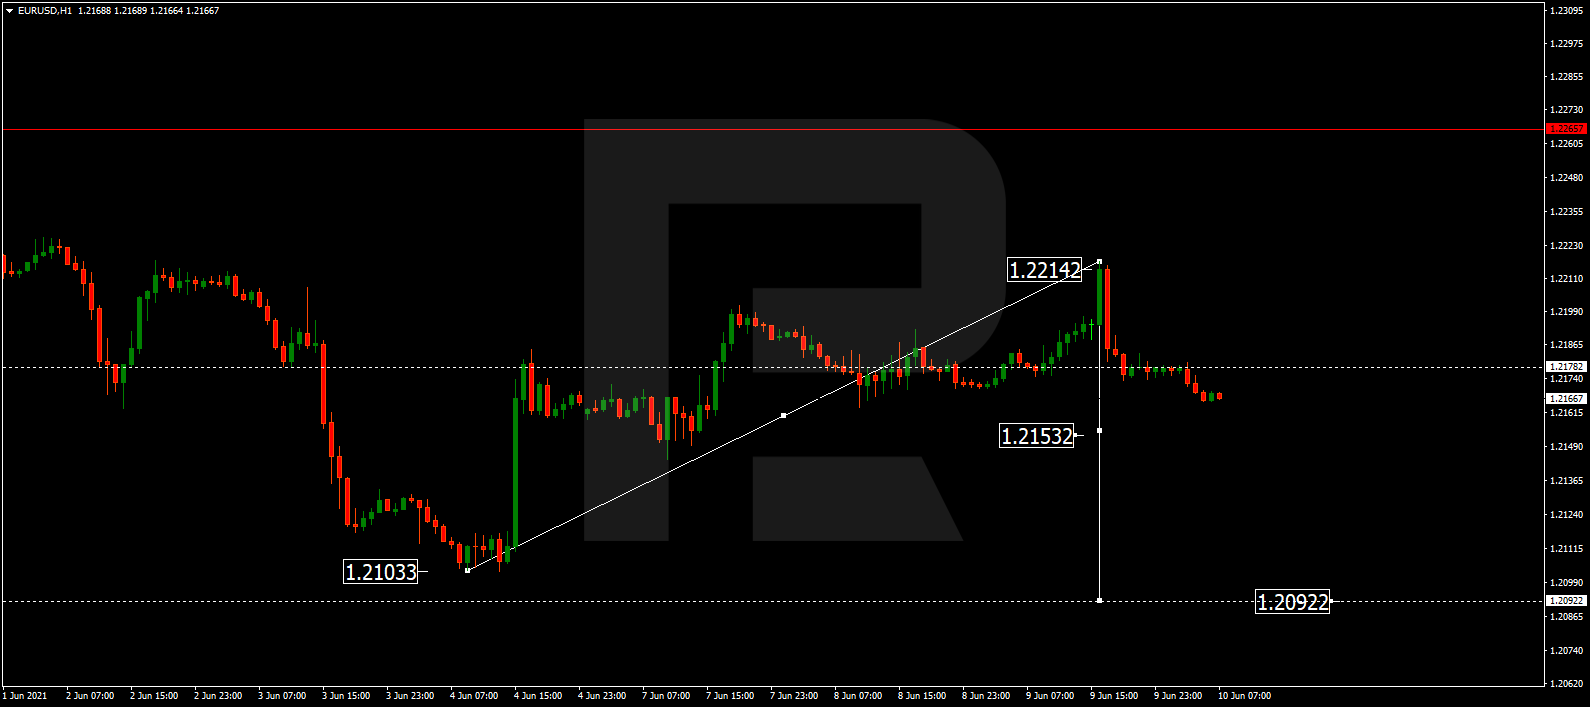
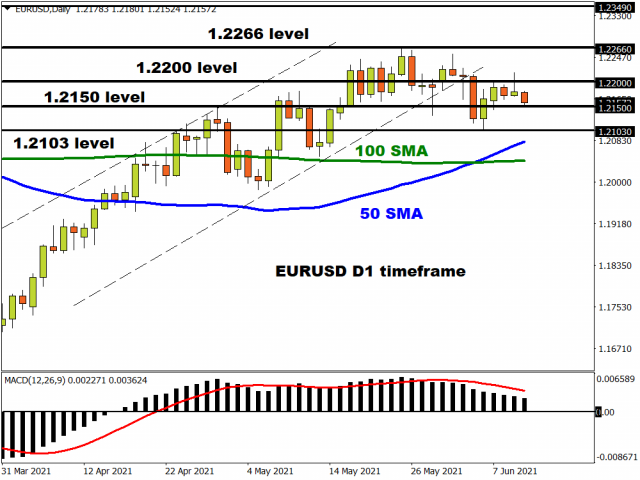
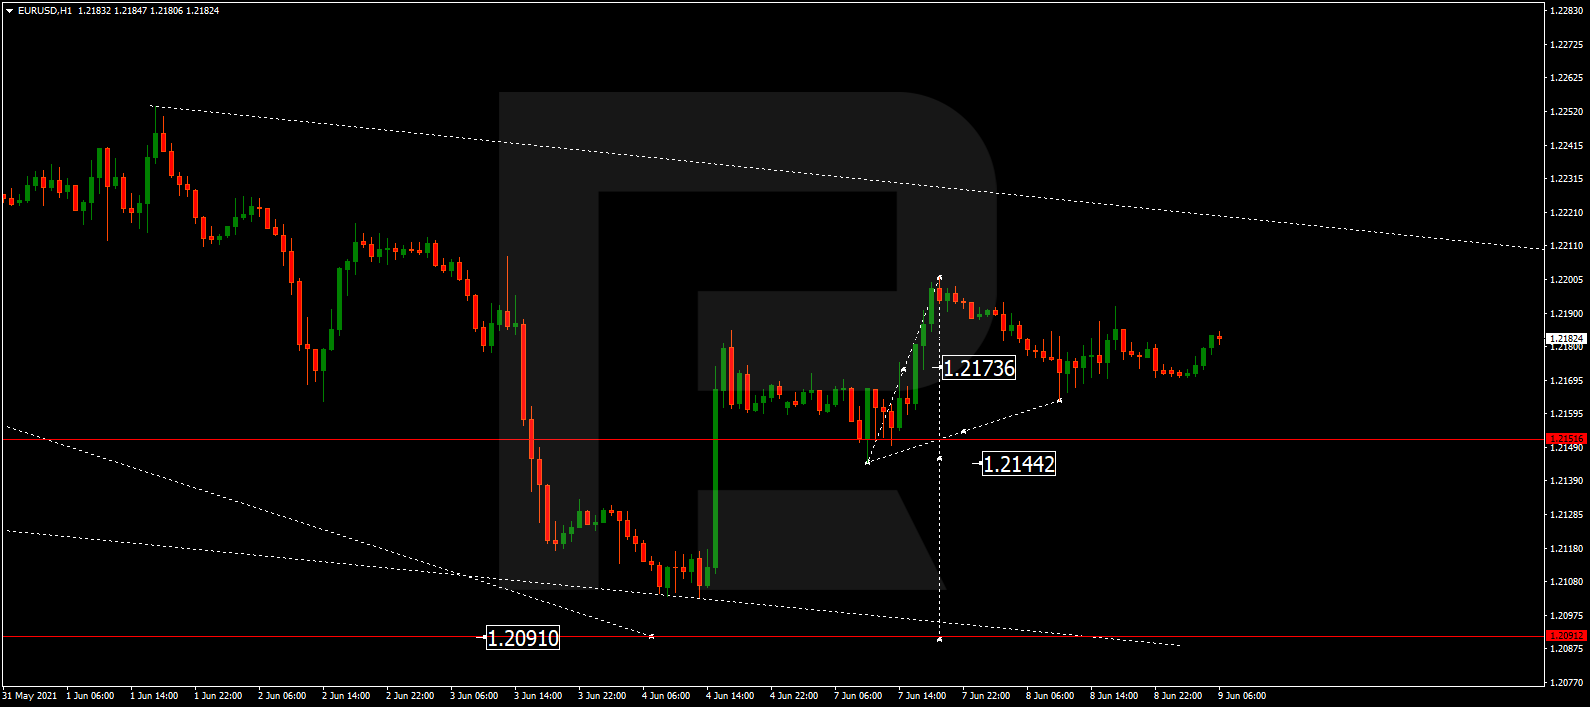
EUR/USD nears 1.22
The ECB left policy measures unchanged but their upbeat tone saw them move the balance of risks to broadly balanced. Growth and inflation forecasts were revised higher but the latter was downplayed with the 2023 projection of 1.4% pointing to a very gradual taper of bond buying. President Lagarde swatted away any taper talk during the press conference and the ECB will remain flexible on the amounts of bond buying and continue with very accommodative monetary conditions through the summer.
EUR/USD was fairly unmoved by the meeting and bulls need to claim 1.22 before they can revisit the may highs. Strong support below lies at 1.21 with the 50-day SMA just below.

FTSE eyeing new highs
The UK economy missed forecasts for its GDP figures this morning printing 2.3% m/m, up from 2.1% but one tenth below analyst estimates. The FTSE has found support above 7,000 and looks be making new highs for the month this morning. The index is trading above the upward sloping 50-day and 100-day SMA in a bullish trend. 7,100 is a round number target before the May high at 7164.

Disclaimer: The content in this article comprises personal opinions and should not be construed as containing personal and/or other investment advice and/or an offer of and/or solicitation for any transactions in financial instruments and/or a guarantee and/or prediction of future performance. ForexTime (FXTM), its affiliates, agents, directors, officers or employees do not guarantee the accuracy, validity, timeliness or completeness, of any information or data made available and assume no liability as to any loss arising from any investment based on the same.
![]() Article by ForexTime
Article by ForexTime
ForexTime Ltd (FXTM) is an award winning international online forex broker regulated by CySEC 185/12 www.forextime.com