by JustForex
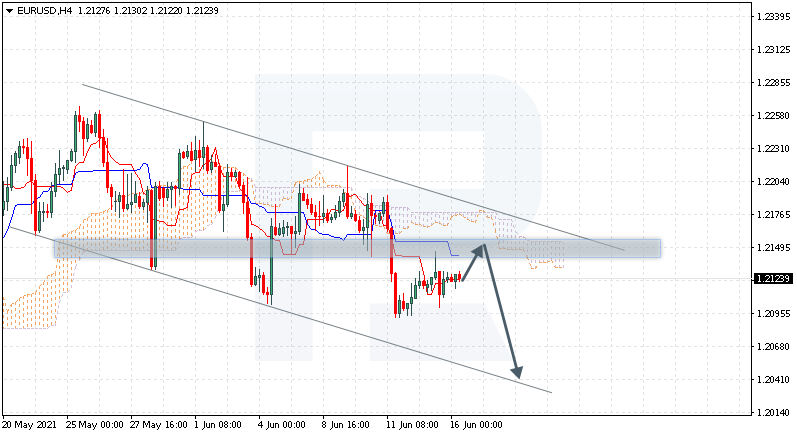
The EUR/USD currency pair
- Prev Open: 1.2125
- Prev Close: 1.1995
- % chg. over the last day: -1.08%
The EUR/USD currency pair, which has an inverse correlation to the US dollar index, fell by 1.08% on the day. The buyers’ reaction is very weak, so the price is likely to fall further. The priority change level has been corrected.
- Support levels: 1.1962, 1.1835
- Resistance levels: 1.2002, 1.2050, 1.2109, 1.2144, 1.2174, 1.2212, 1.2243
The sellers’ pressure remains high, while the buyers are very weak. The MACD indicator went into the oversold zone without any signs of divergence. The best strategy for traders is to look for sell trades from resistance levels. But considering the strong deviation from the middle line, it is also possible to look for buy trades from the support levels. Though, it is better to buy at the intraday timeframes from the 1.1962 level.
Alternative scenario: if the price breaks out through the 1.2144 resistance level and fixes above, the general uptrend is likely to resume.

- – SNB Interest Rate Decision at 10:30 (GMT+3);
- – Eurozone Consumer Price Index (m/m, y/y) at 12:00 (GMT+3);
- – US Initial Jobless Claims (w/w) at 15:30 (GMT+3);
- – US Philadelphia Fed Manufacturing Index (m/m) at 15:30 (GMT+3).
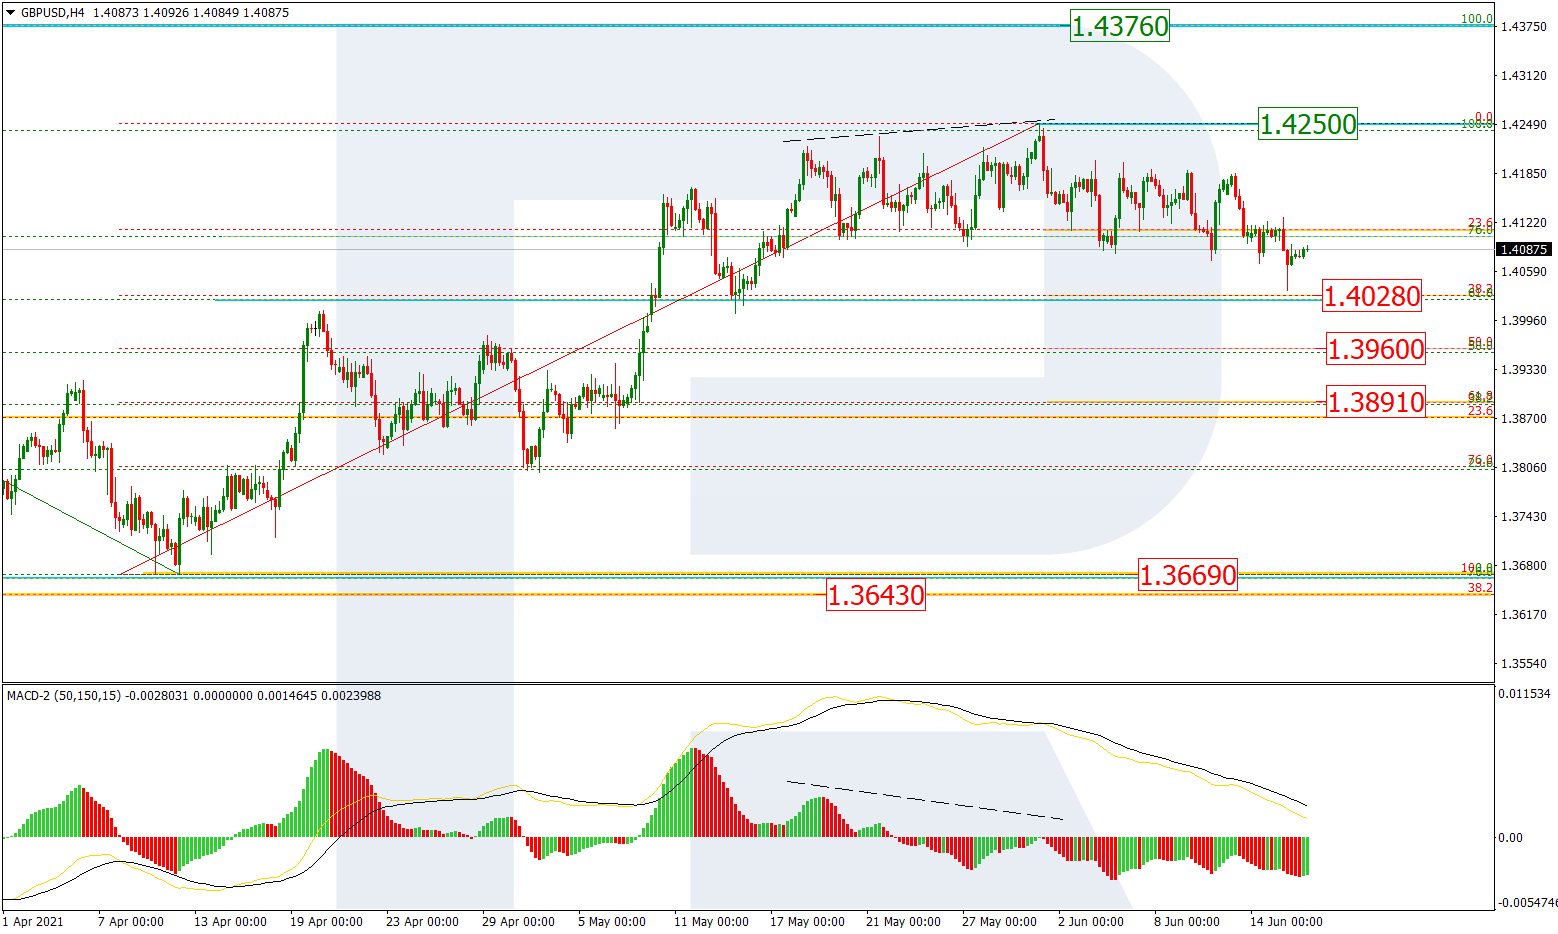
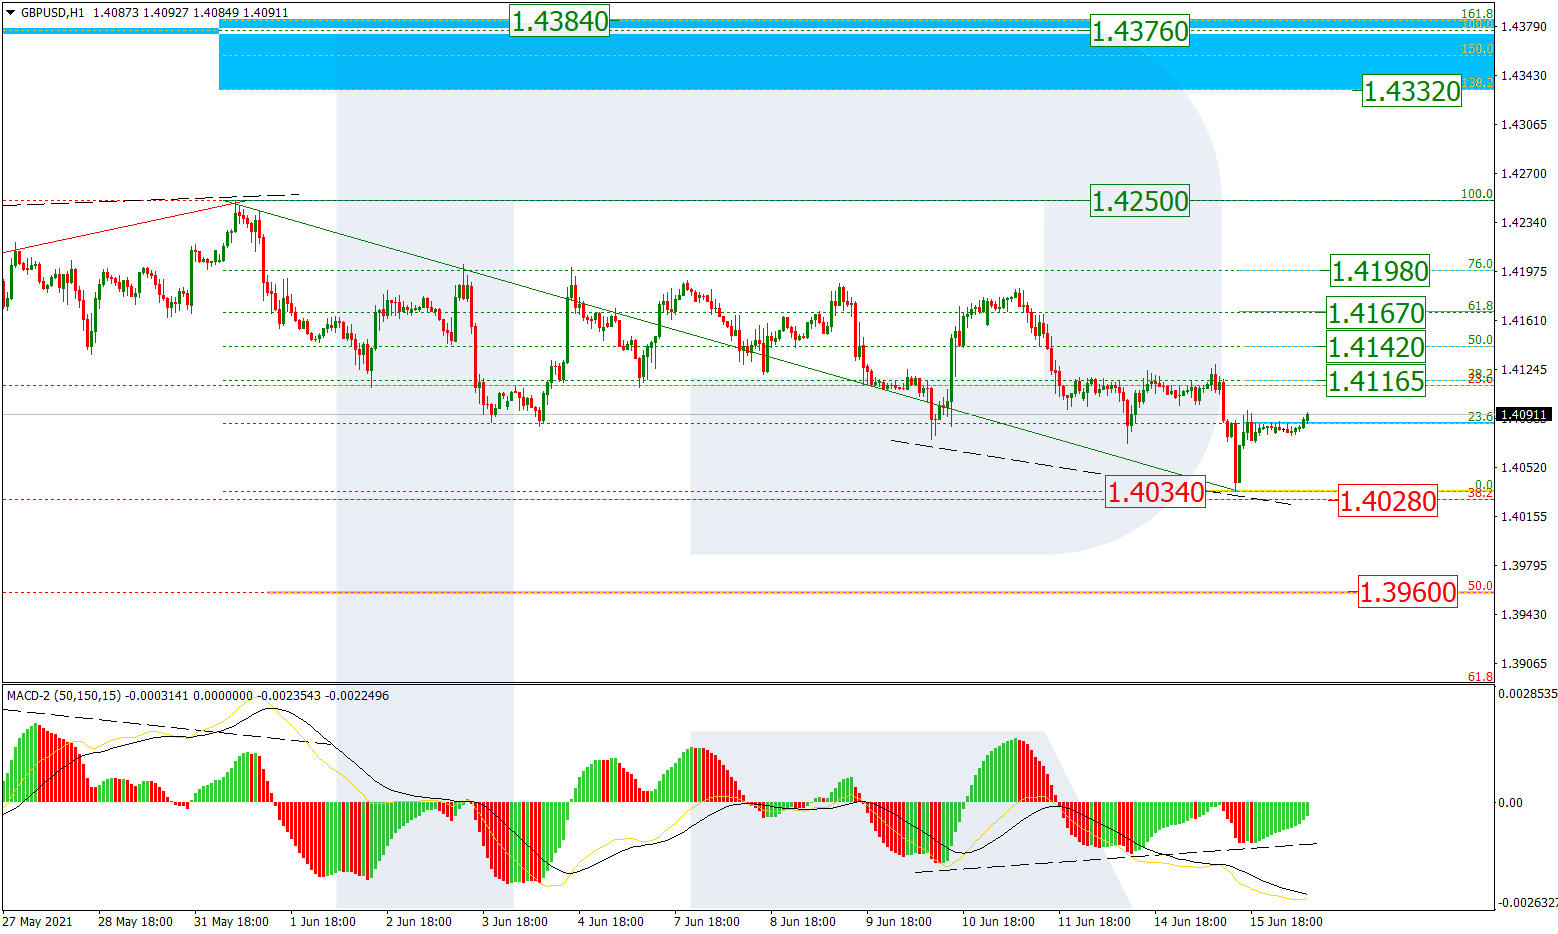
The GBP/USD currency pair
- Prev Open: 1.4078
- Prev Close: 1.3983
- % chg. over the last day: -0.68%
The GBP/USD currency pair fell below the priority change level of 1.4075. Buyers are very weak, so the probability of another wave of decline is very high. The fundamental picture for the British currency is positive, but as long as the dollar index is moving up, the GBP/USD quotes will not rise.
- Support levels: 1.3914, 1.3835, 1.3801
- Resistance levels: 1.4002, 1.4075, 1.4100, 1.4138, 1.4191
The trend on the GBP/USD currency pair has changed to bearish on the H1 timeframe. At the moment, the price is trading below the moving average. The MACD indicator is oversold with no sign of divergence. Under such market conditions, traders are better to look for sell trades from resistance levels. Still, considering the strong deviation from the moving average, traders can also look for buy trades from the support level of 1.3914 on the intraday timeframes.
Alternative scenario: if the price breaks out through the 1.4138 resistance level and consolidates above, the bearish scenario is likely to be canceled.

The USD/JPY currency pair
- Prev Open: 110.03
- Prev Close: 110.69
- % chg. over the last day: +0.60%
The USD/JPY currency pair jumped by 0.6% amid the rise in the dollar index. The uptrend has accelerated. Sellers are still inactive. The priority change level has been corrected.
- Support levels: 110.31, 110.08, 109.83, 109.62, 109.31
- Resistance levels: 110.73 110.94, 111.48
The trend is bullish as the price is above the priority change level of 109.83. Now the price has reached the resistance level, and the MACD indicator is in the overbought zone. Considering the strong deviation from the moving average, there is a high probability of a small downward correction. Traders are better to look for buy trades from support levels after the correction. Sell positions can only take place on intraday timeframes and only with short targets. Trading against the trend is not recommended.
Alternative scenario: if the price falls below 109.83, the general downtrend is likely to resume.

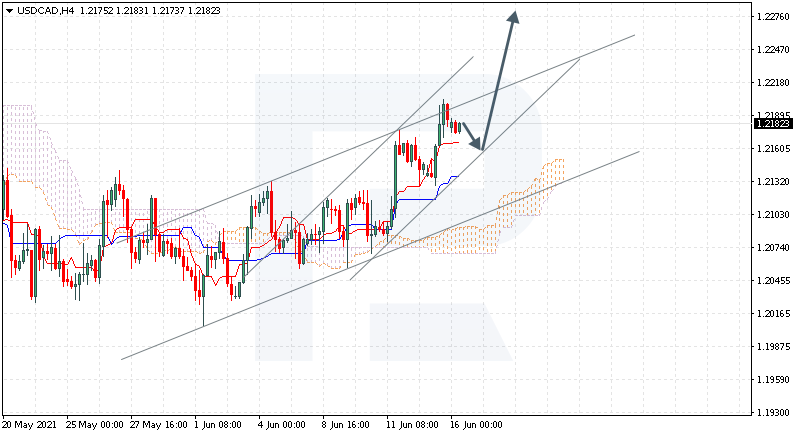
The USD/CAD currency pair
- Prev Open: 1.2176
- Prev Close: 1.2276
- % chg. over the last day: +0.82%
The USD/CAD currency pair increased sharply by 0.82% on Wednesday. The USD/CAD quotes are strongly correlated with the dollar index now. So the currency pair follows the US dollar.
- Support levels: 1.2251, 1.2190, 1,2148 1.2121, 1.2096
- Resistance levels: 1.2321, 1.2388, 1.2519
Technically, the trend remains bullish. The price is trading above the moving average. The MACD indicator is in the overbought zone, but there are no signs of reversal. Under such market conditions, traders are better to look for buy trades from support levels, but considering the strong deviation from the moving average, traders should wait for a slight downward correction.
Alternative scenario: if the price breaks down through the 1.2121 support level and fixes below, the downtrend is likely to be resumed.

- – Canada BOC Governor Tiff Macklem Speaks at 01:30 (GMT+3).
by JustForex
This article reflects a personal opinion and should not be interpreted as an investment advice, and/or offer, and/or a persistent request for carrying out financial transactions, and/or a guarantee, and/or a forecast of future events.