
Article By RoboForex.com
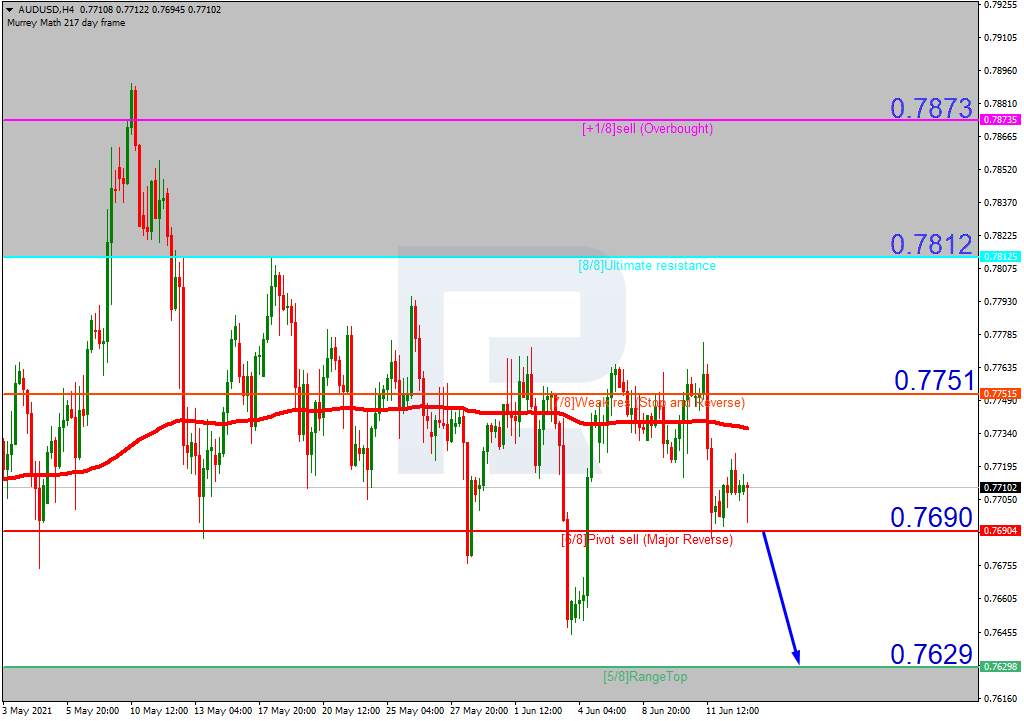
AUDUSD, “Australian Dollar vs US Dollar”
In the H4 chart, after breaking the 200-day Moving Average, AUDUSD is trading below it to indicate a possible descending tendency. In this case, the price is expected to break 6/8 and then continue moving downwards to reach the support at 5/8. However, this scenario may be canceled if the price breaks 7/8 to the upside. After that, the instrument may reverse and grow towards the resistance at 8/8.

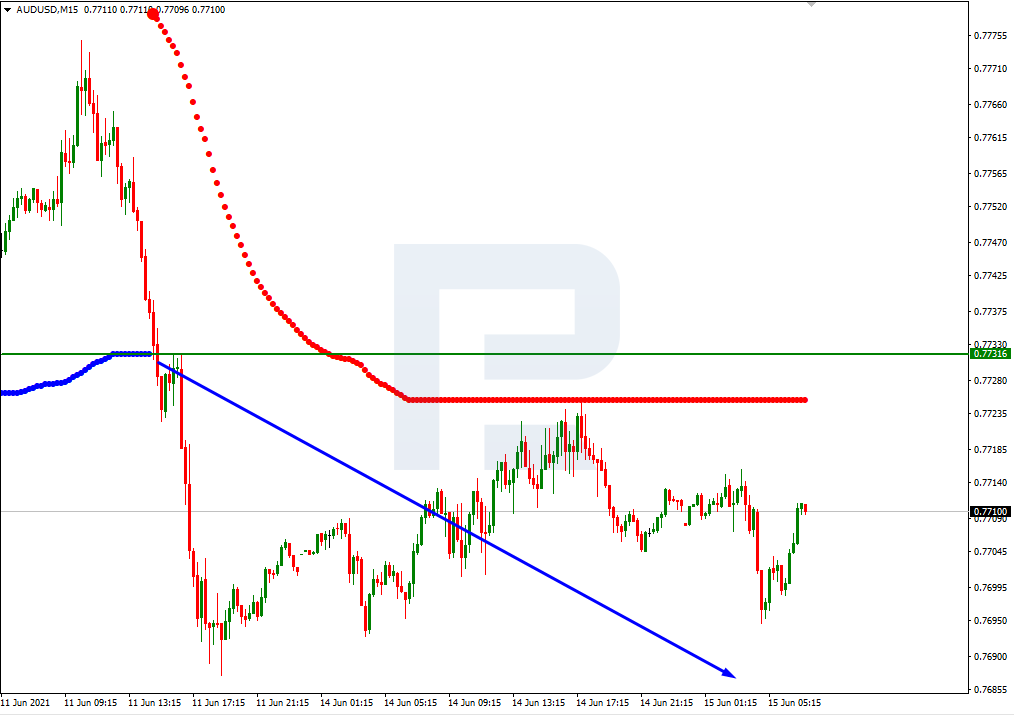
As we can see in the M15 chart, the pair has broken the downside line of the VoltyChannel indicator and, as a result, may continue trading downwards.
Free Reports:
 Get our Weekly Commitment of Traders Reports - See where the biggest traders (Hedge Funds and Commercial Hedgers) are positioned in the futures markets on a weekly basis.
 Download Our Metatrader 4 Indicators – Put Our Free MetaTrader 4 Custom Indicators on your charts when you join our Weekly Newsletter
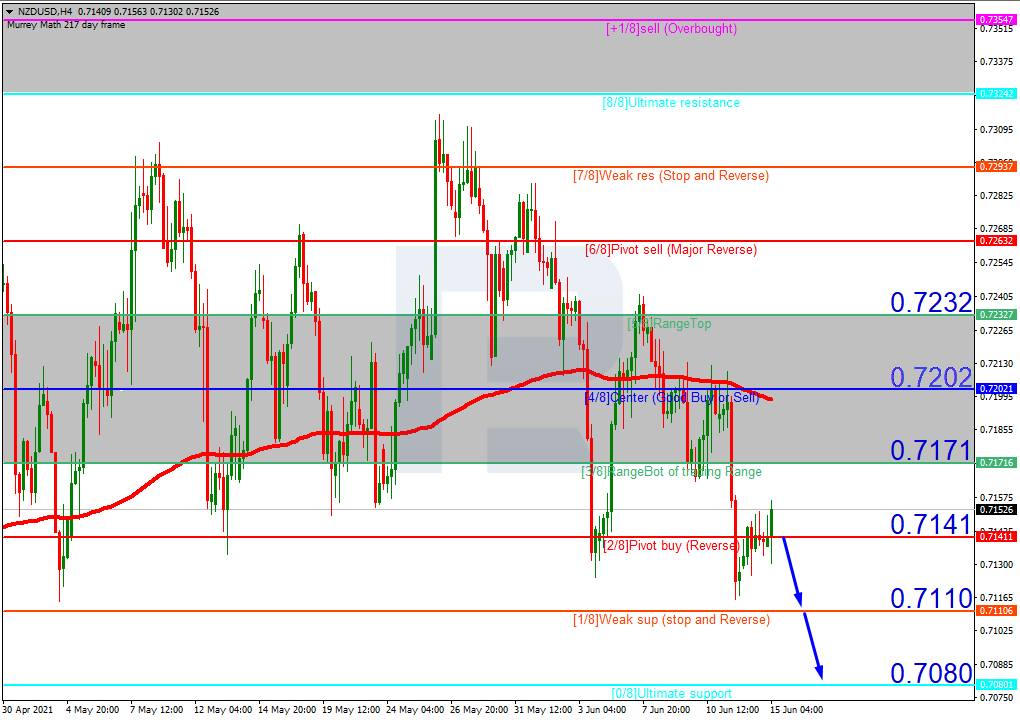
NZDUSD, “New Zealand Dollar vs US Dollar”
In the H4 chart, NZDUSD is trading below the 200-day Moving Average to indicate a descending tendency. In this case, the price is expected to break 2/8 and then continue falling to reach the support at 0/8. However, this scenario may no longer be valid if the price breaks 3/8 to the upside. In this case, the instrument may grow towards 5/8.
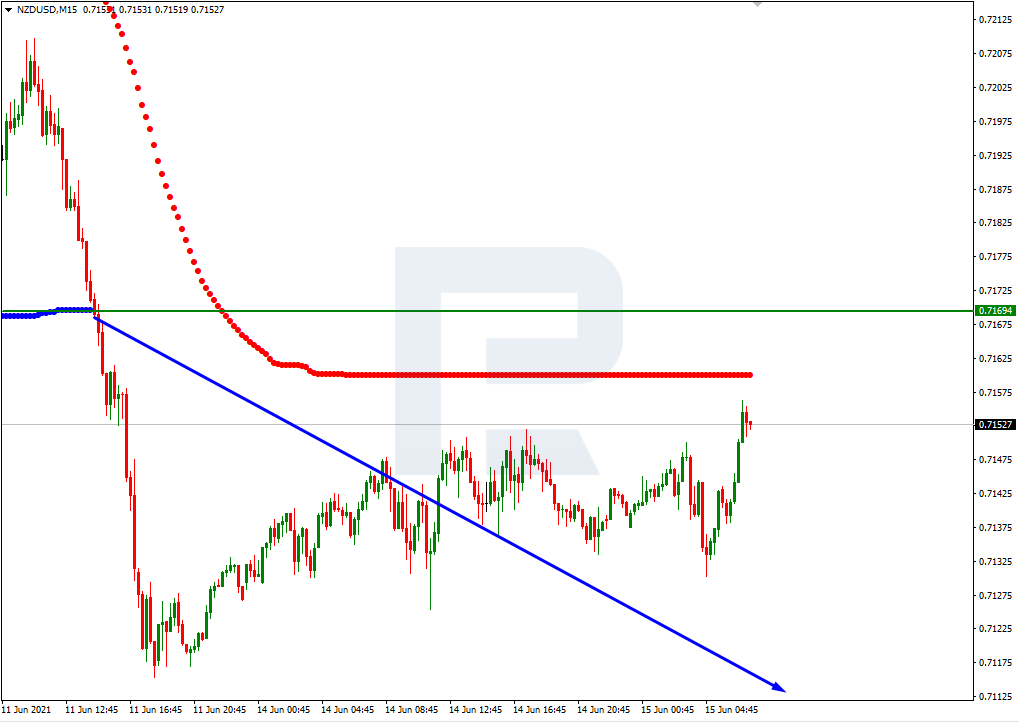
As we can see in the M15 chart, the pair has broken the downside line of the VoltyChannel indicator and, as a result, may continue its decline to reach 0/8 from the H4 chart.
Article By RoboForex.com
Attention!
Forecasts presented in this section only reflect the author’s private opinion and should not be considered as guidance for trading. RoboForex LP bears no responsibility for trading results based on trading recommendations described in these analytical reviews.

- GBP/USD at Month’s Lows: The Outlook Remains Weak Jul 29, 2026
- Crude oil falls below $80 per barrel. Australia sees inflation slowdown Jul 29, 2026
- The US Tech sector hit by sell‑off. Oil prices decline on renewed negotiations Jul 28, 2026
- Gold Declines, Focus on Fed and Falling Oil Prices Jul 28, 2026
- This week will be one of the most crowded for central‑bank meetings Jul 27, 2026
- EUR/USD Ahead of a Key Week: Holding Near Lows Jul 27, 2026
- COT Metals Charts: Weekly Speculator Changes led by Copper Jul 26, 2026
- COT Bonds Charts: Speculator Bets led by SOFR 3-Months & 5-Year Bonds Jul 26, 2026
- COT Energy Charts: Weekly Speculator Bets led by WTI Crude & Natural Gas Jul 26, 2026
- COT Soft Commodities Charts: Weekly Speculator Bets led by Corn & Soybeans Jul 26, 2026