By Orbex
Many traders, especially when they are starting, are worried about margin and their account size. Those are important concerns, but not as fundamental as the not so commonly talked about “pip value.”
Indeed, it’s an important aspect of calculating your potential profit and, more crucially, your exposure risk.
Trading across currency pairs is not the same because each currency has a different value. This means that if a particular pair changes price, the impact on your account once you complete the trade will be different.
You can make more or less money on virtually identical trades depending simply on which currency pair you are using.
What is “pip value”?
Basically, it’s how much money in your account each pip of price change is worth.
For example, if you have a dollar-denominated account, and you are trading one lot of the EURUSD, it means that each pip is worth $10. It doesn’t matter what margin you have, or how much you have in your account.
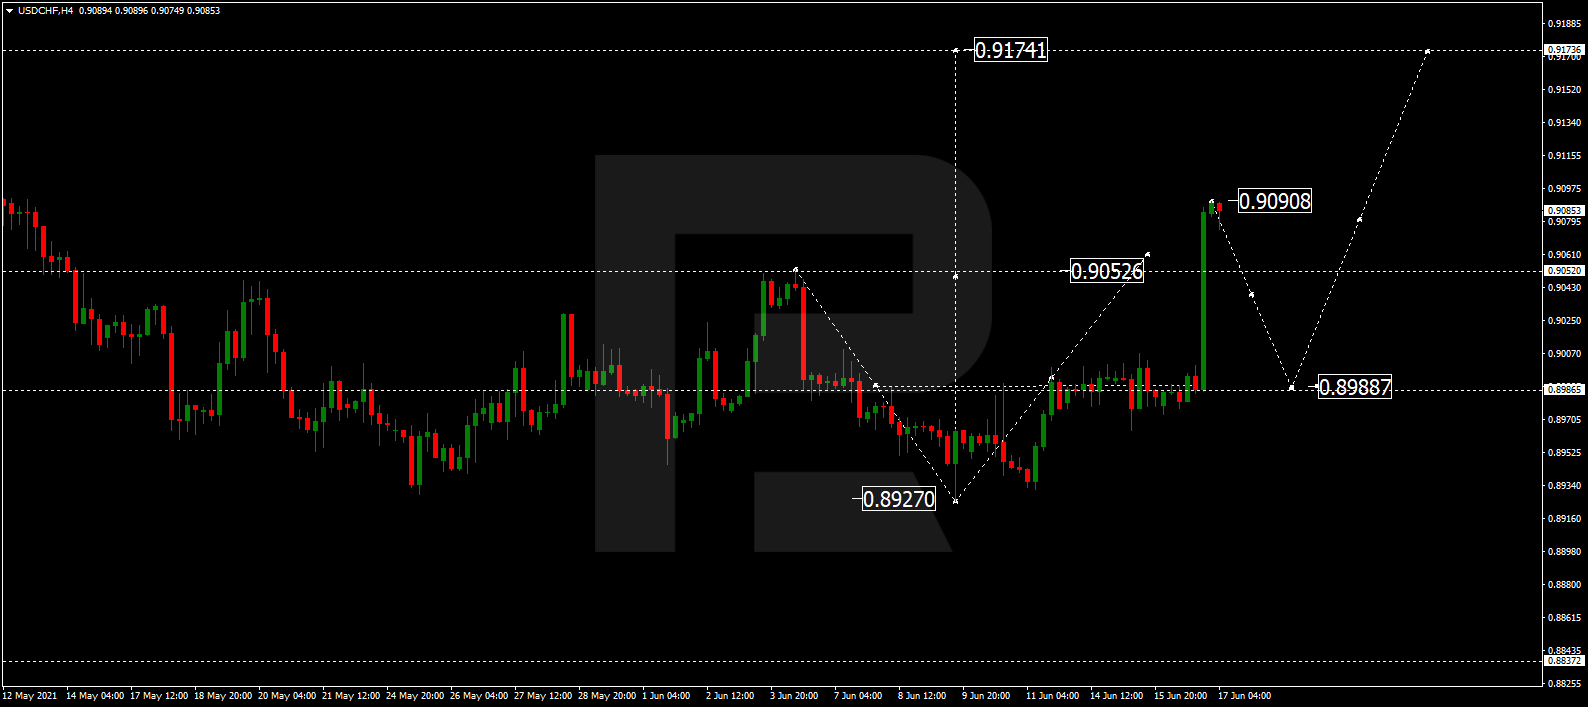
But if you are trading one lot of USDCHF at around 0.9000, in the very same account, then one pip change is going to be worth $11. So, you can be using the same strategy, with the same amount of money in your account, at the same margin, but suddenly you are making more money.
Wait, what just happened?
To be fair, you are also taking a bigger risk. And given the importance of portfolio diversity, you want to know just how much you are risking as well.
So, we have to remember that the currency pair, like the EURUSD, has two components; the “base currency” (EUR) and the “quote currency” (USD). The “price” is the value of the euro quoted in dollars. In other words, how many dollars it takes to buy a euro.
If the EURUSD price is 1.2000, that means in order for you to buy one lot, you need $120,000. Now, of course, you don’t put all that up yourself; you use margin. But that’s beside the point here. We want to focus on what happens when the price goes from 1.2000 to 1.2001 – it goes up one pip.
Now you need $120,010 to buy that same lot of euros. This means that the value of one lot euros has gone up by $10. So, the “pip value” of one lot of EURUSD with a dollar-denominated account is $10.
So for every pip you trade, you can expect to gain or lose $10.
But what happened with the Swiss franc?
In the USDCHF pair, the dollar is the base, and the franc is the quoted currency. In other words, how many Swiss francs does it take to buy a dollar?
If the USDCHF price is 0.9000, that means in order to buy one lot of dollars, you need CHF90,000. If we do the same process with the price, where the USDCHF goes up to 0.9001, then now you need 90,010 Swiss francs to buy one lot of dollars. That’s an increase of CHF10.
But there is a problem: you don’t have francs in your account. You have dollars. This means that the change of value needs to be exchanged into dollars to match your account.
So CHF10/0.9010 = $11.09.
In other words, for each pip of change in the USDCHF, your account is going to be impacted by a larger amount.
But the currency is changing price constantly
In the case of the USDCHF, the pip value is constantly changing slightly as the price of the pair changes.
However, for major currency pairs, the change is relatively small, and can usually be rounded when you calculate your exposure (we’re talking about two decimal places after a couple of percentage points). But if the price action is over 10%, then you might want to reevaluate your pip price.
One thing that makes this easier, though, is that if the quote currency is the same as your account currency, then the pip value of one lot will be 10 units of your account’s currency. Here, we are talking about an account denominated in dollars.
So, for EURUSD (the dollar is quoted), the pip value for one lot is $10.
But if you had an account denominated in francs, for example, then the situation would be reversed. So, one lot of USDCHF would have a pip value of CHF10.
Hang on, why do you keep qualifying these statements with “one lot”?
Glad you asked, clever reader.
The standard unit in forex is, of course, one lot. But you can also trade mini lots of 10,000 and micro lots of just 1,000.
So, if the pip value of EURUSD is $10 for one lot, it means that the pip value of EURUSD for a mini lot is… $1. You just divide by the decimal places that are changed. A micro lot would have a pip value of $0.10.
How do I use this in my trading?
Knowing the pip value of each currency pair you are trading allows you to tweak your exposure, and make the same profit across pairs. For example, if one pair has a pip value of $10, and another of $5, then you can double the position while keeping your risk within the same parameters.
By Orbex