Article By RoboForex.com
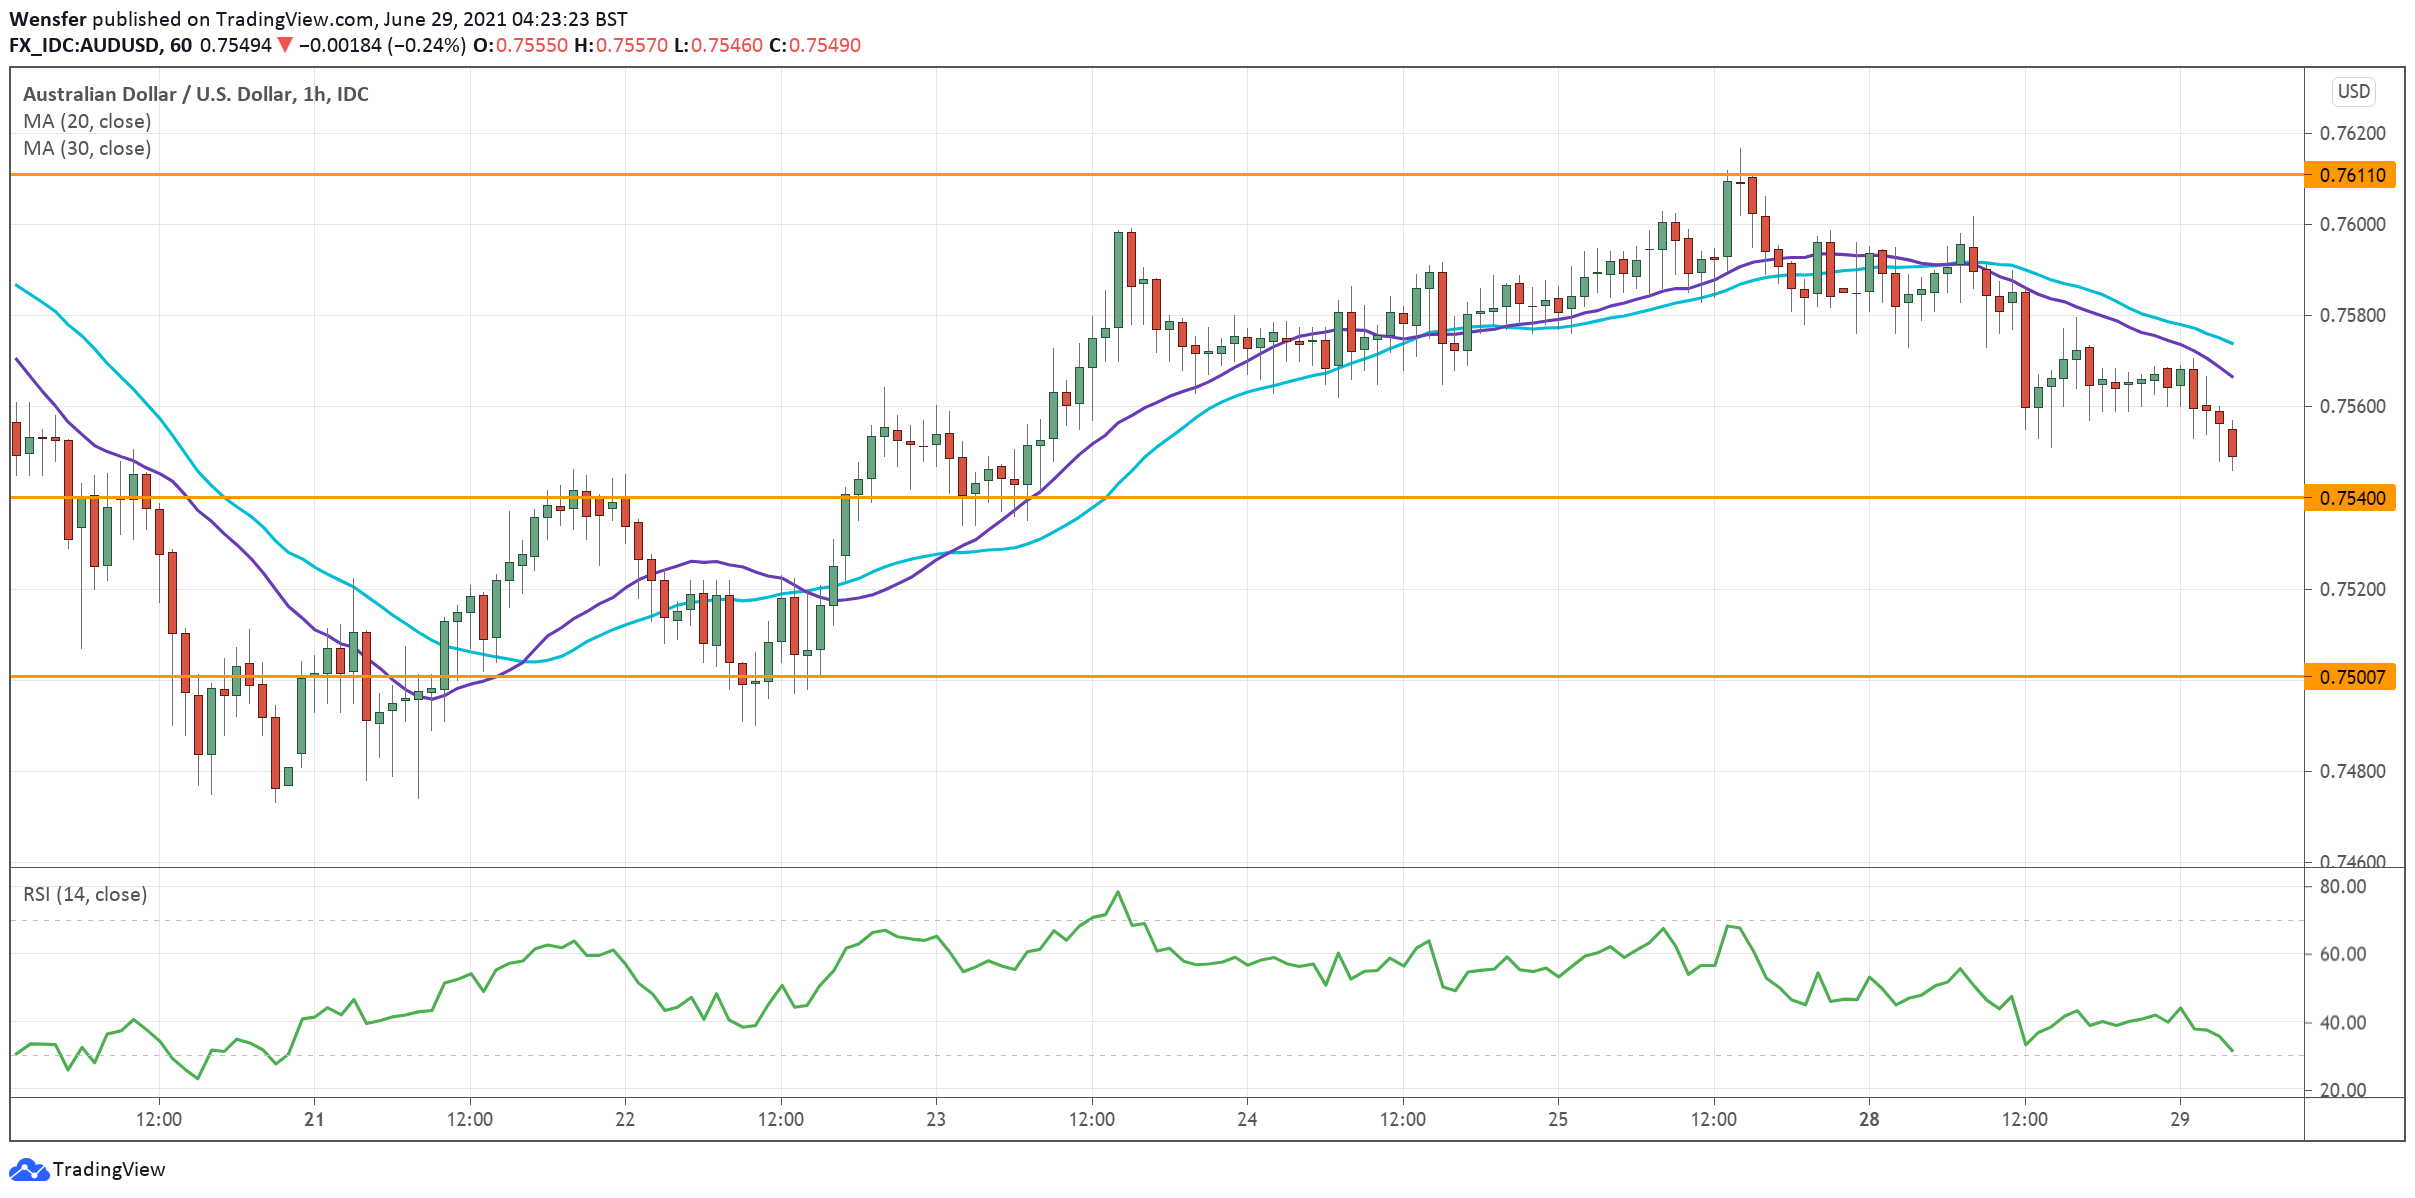
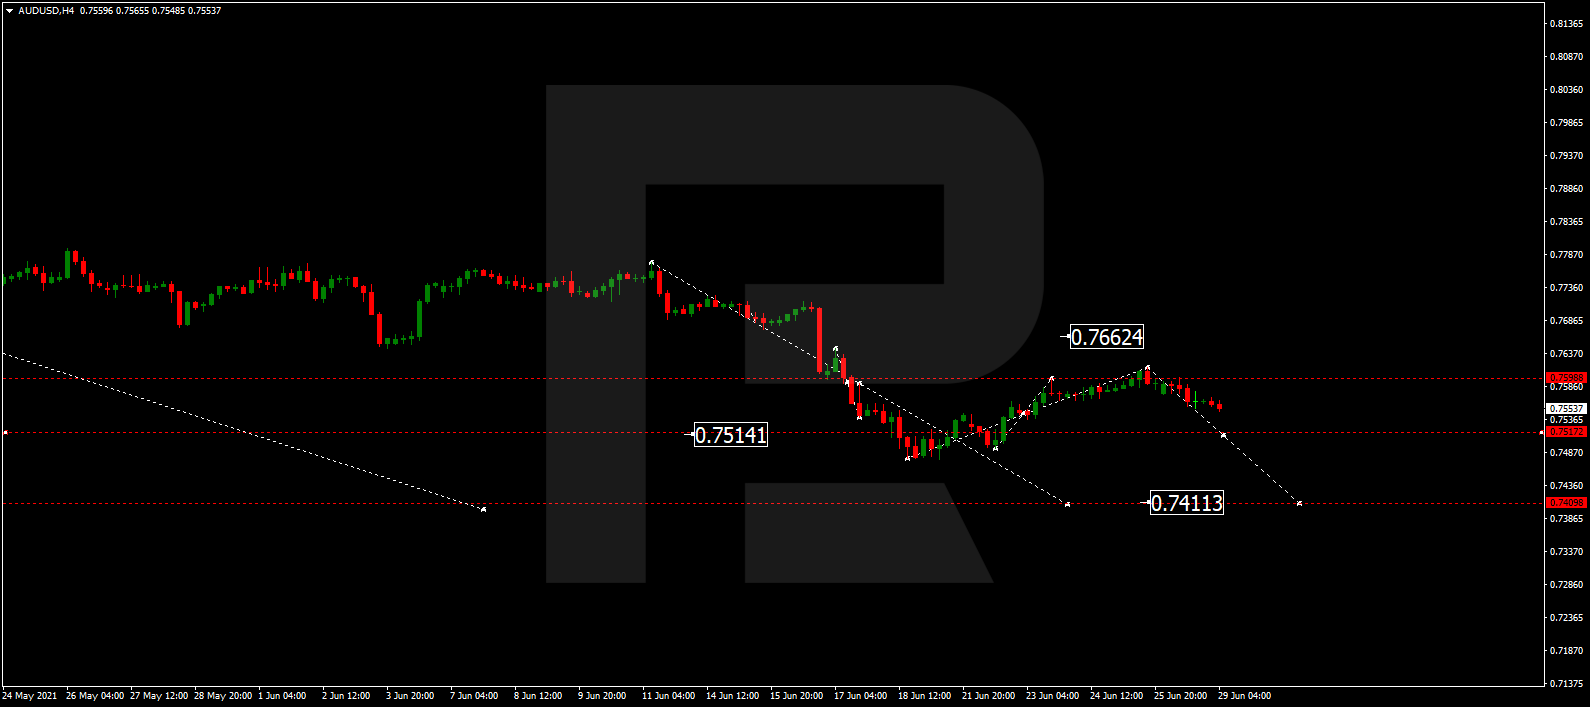
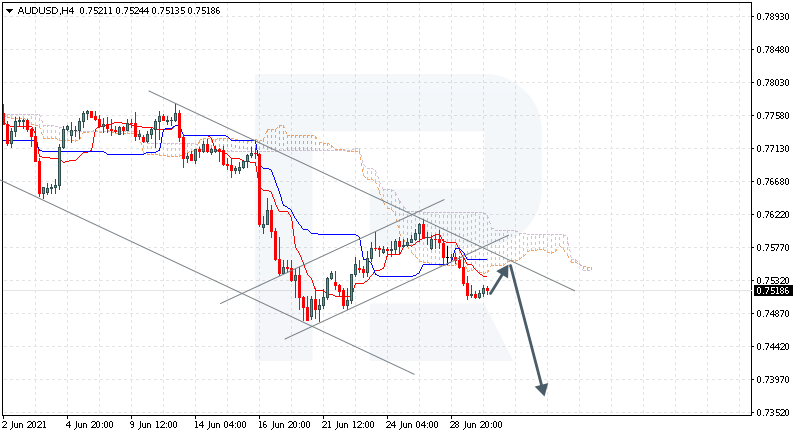
AUDUSD, “Australian Dollar vs US Dollar”
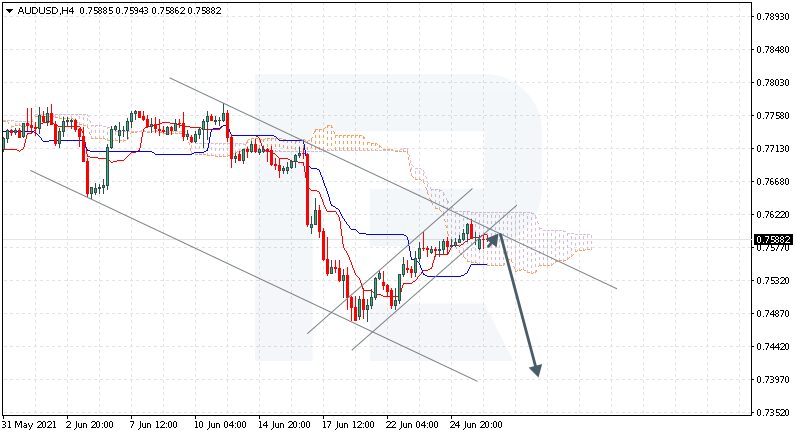
AUDUSD is trading at 0.7518; the instrument is moving below Ichimoku Cloud, thus indicating a descending tendency. The markets could indicate that the price may test the cloud’s downside border at 0.7550 and then resume moving downwards to reach 0.7375. Another signal in favor of a further downtrend will be a rebound from the descending channel’s upside border. However, the bearish scenario may no longer be valid if the price breaks the cloud’s upside border and fixes above 0.7665. In this case, the pair may continue growing towards 0.7755.

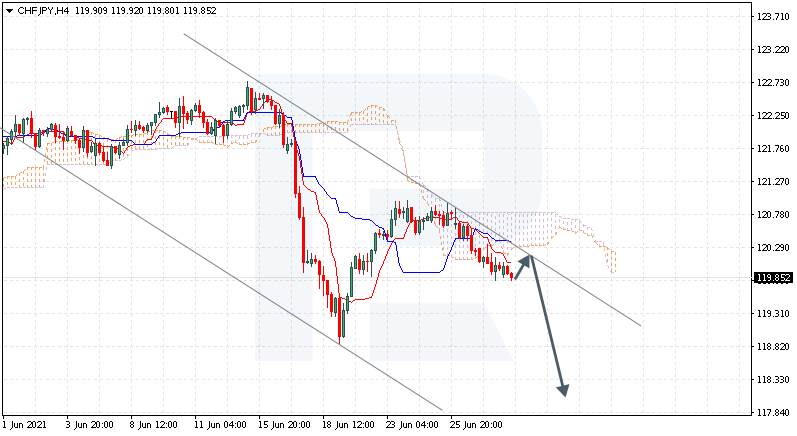
CHFJPY, “Swiss Franc vs Japanese Yen”
CHFJPY is trading at 119.85; the instrument is moving below Ichimoku Cloud, thus indicating a descending tendency. The markets could indicate that the price may test Tenkan-Sen and Kijun-Sen at 120.25 and then resume moving downwards to reach 118.05. Another signal in favor of a further downtrend will be a rebound from the bearish channel’s upside border. However, the bearish scenario may no longer be valid if the price breaks the cloud’s upside border and fixes above 121.35. In this case, the pair may continue growing towards 122.25.
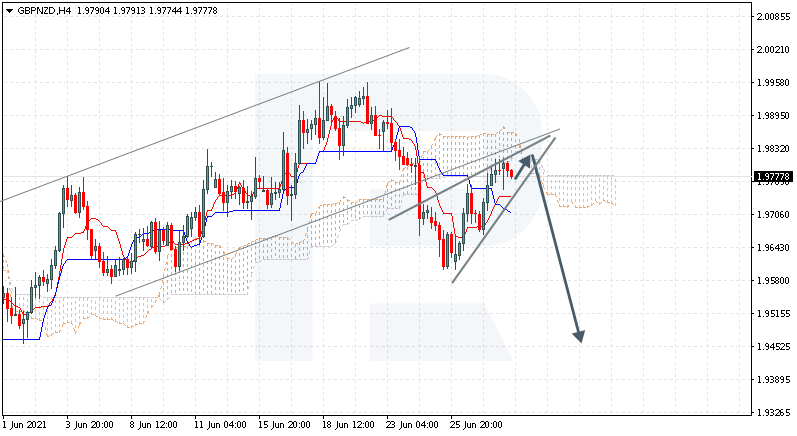
GBPNZD, “Great Britain Pound vs New Zealand Dollar”
GBPNZD is trading at 1.9777; the instrument is moving below Ichimoku Cloud, thus indicating a descending tendency. The markets could indicate that the price may test the cloud’s downside border at 1.9805 and then resume moving downwards to reach 1.9425. Another signal in favor of a further downtrend will be a rebound from the rising channel’s downside border. However, the bearish scenario may no longer be valid if the price breaks the cloud’s upside border and fixes above 1.9845. In this case, the pair may continue growing towards 1.9935. To confirm further decline, the asset must break the downside border of the Wedge pattern and fix below 1.9705.
Article By RoboForex.com
Attention!
Forecasts presented in this section only reflect the author’s private opinion and should not be considered as guidance for trading. RoboForex LP bears no responsibility for trading results based on trading recommendations described in these analytical reviews.