By Lukman Otunuga Research Analyst, ForexTime
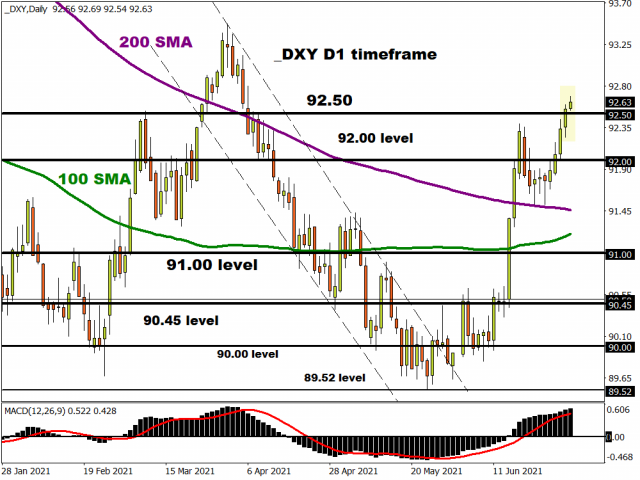
We’ve seen an unrelenting bid in the greenback across the board recently with the Dollar Index hitting a fresh three-month high this morning.
All eyes are inevitably on the US non-farm payrolls report released at 12.30 GMT with expectations for more bumper job gains to confirm the ongoing recovery in the world’s most important economy.
Labour market report key for July trading
After two disappointing months, the median estimate of the great and the good on Wall Street is for 711k job gains in June from the 278k and 559k previously and an unemployment rate of 5.6% from the 5.8% in May. Traders will also be keeping an eye out for revisions to the prior headline prints and if wage growth is rising due to labour shortages.
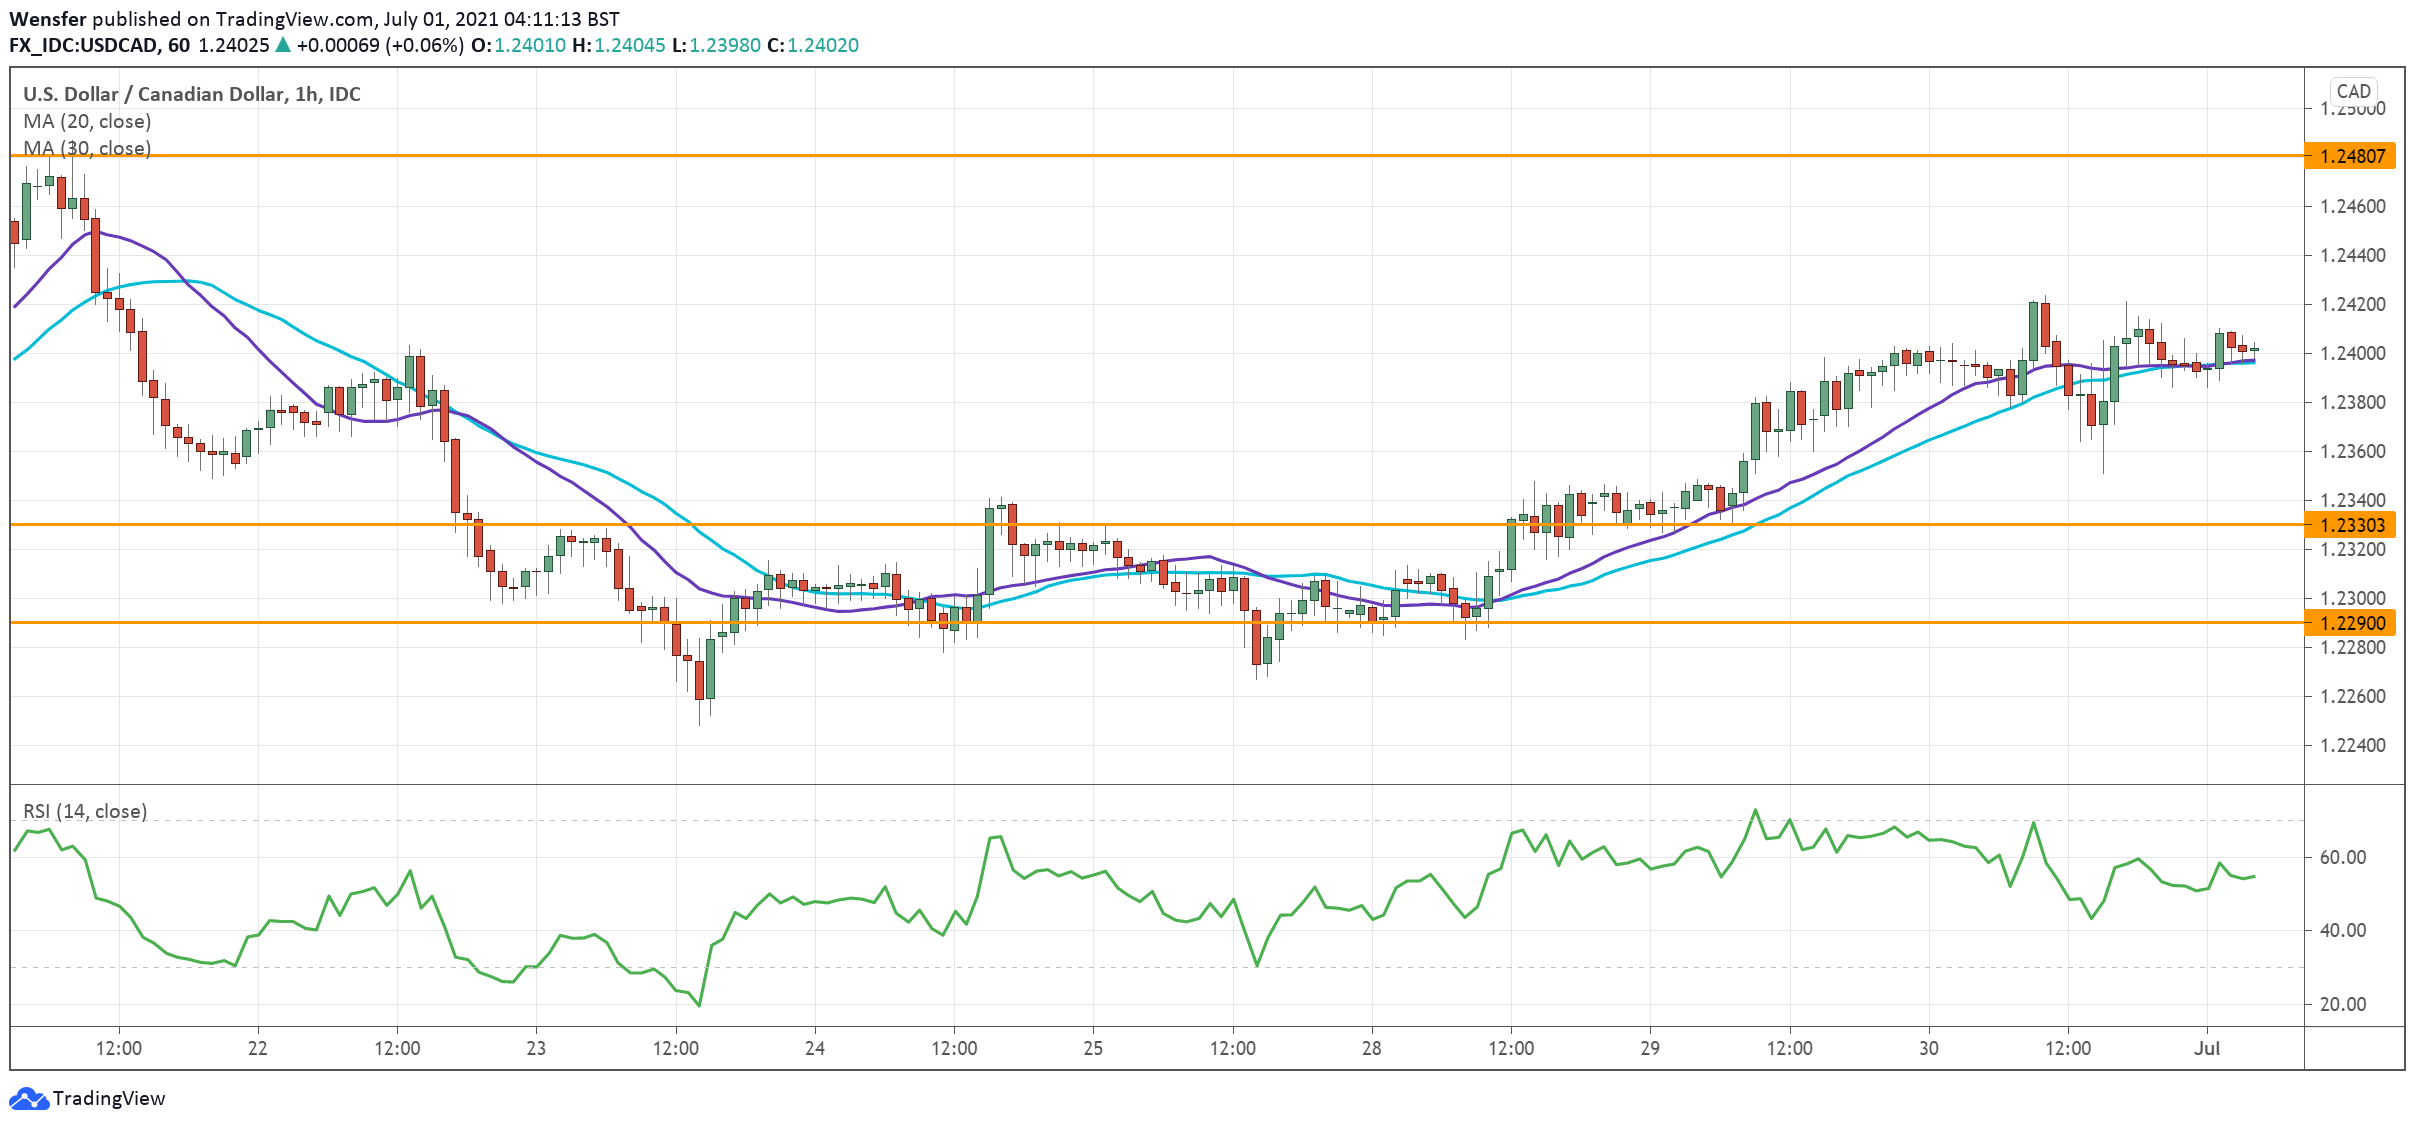
Yesterday’s weekly jobless claims data came in lower than expected, a promising sign ahead of today’s report. With state benefits and job support being turned off by many states, expectations are for a big jump in payrolls at some point, with the range of analyst estimates between 495k and 1,050k for what it’s worth. This year has seen NFP misses generate more downside compared to the upside on a stronger report and a weaker headline print would see selling in the dollar and give a bid to stock markets. This is because a below-consensus number would mean the Fed can continue to put off its tightening cycle, allowing stocks to benefit from lower rates for longer. Higher-beta currencies like the commodity-dollars CAD, AUD and NZD should be bid up if this is the case.
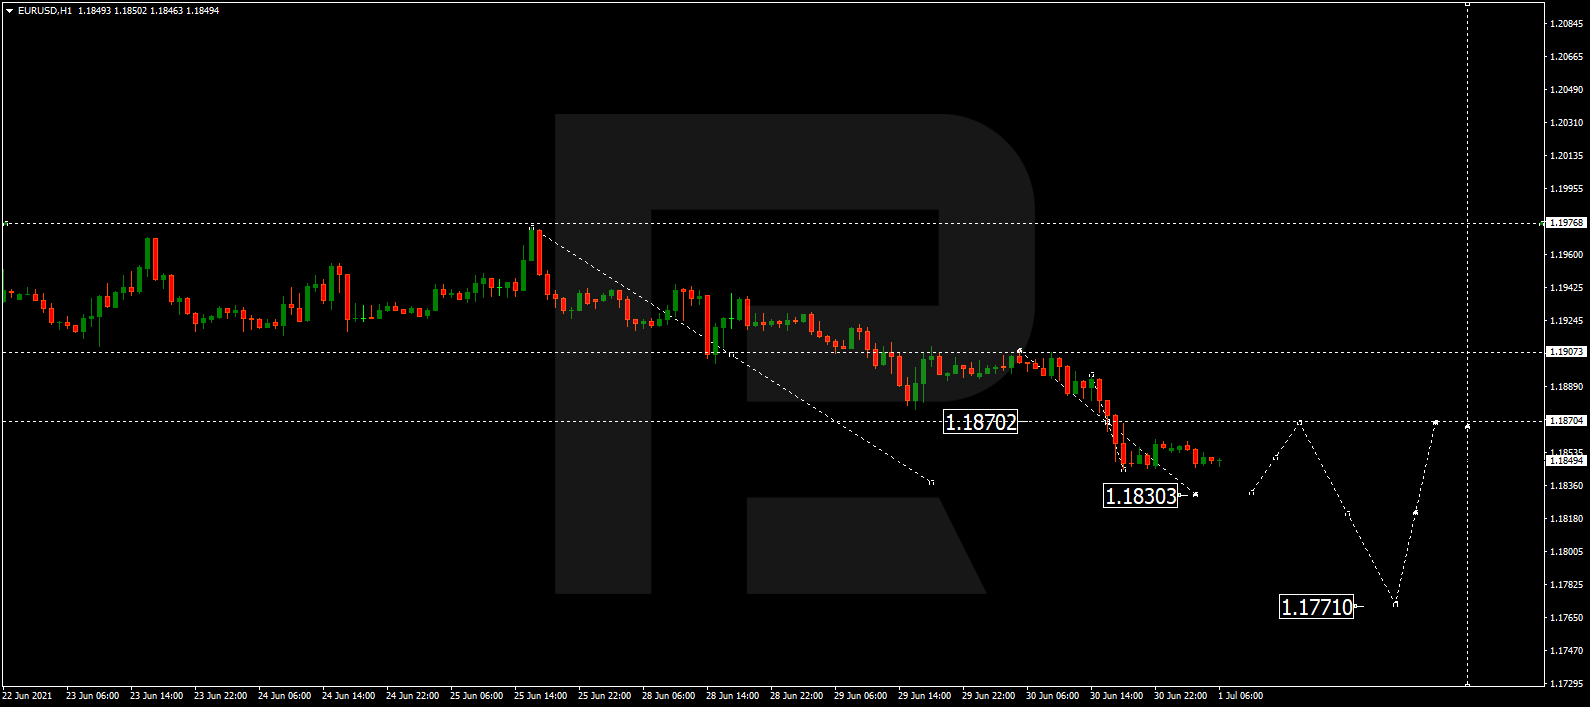
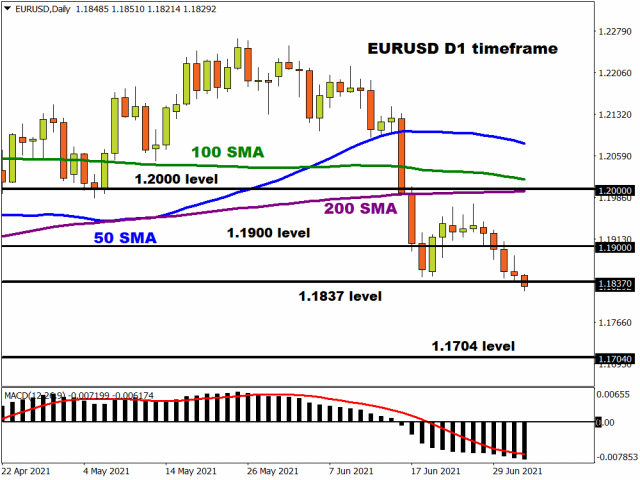
EUR/USD is already moving this morning breaking through the 76% retracement of the end of March to May move at 1.1837. If this break holds, the door is open for a full retracement to the 1.1704 area. But the pair is oversold on the daily RSI and this has acted as a rebound point in the recent past. Prices would need to get up beyond 1.19 to slow the bearish momentum as we head into the 4th of July Independence Day Holiday.
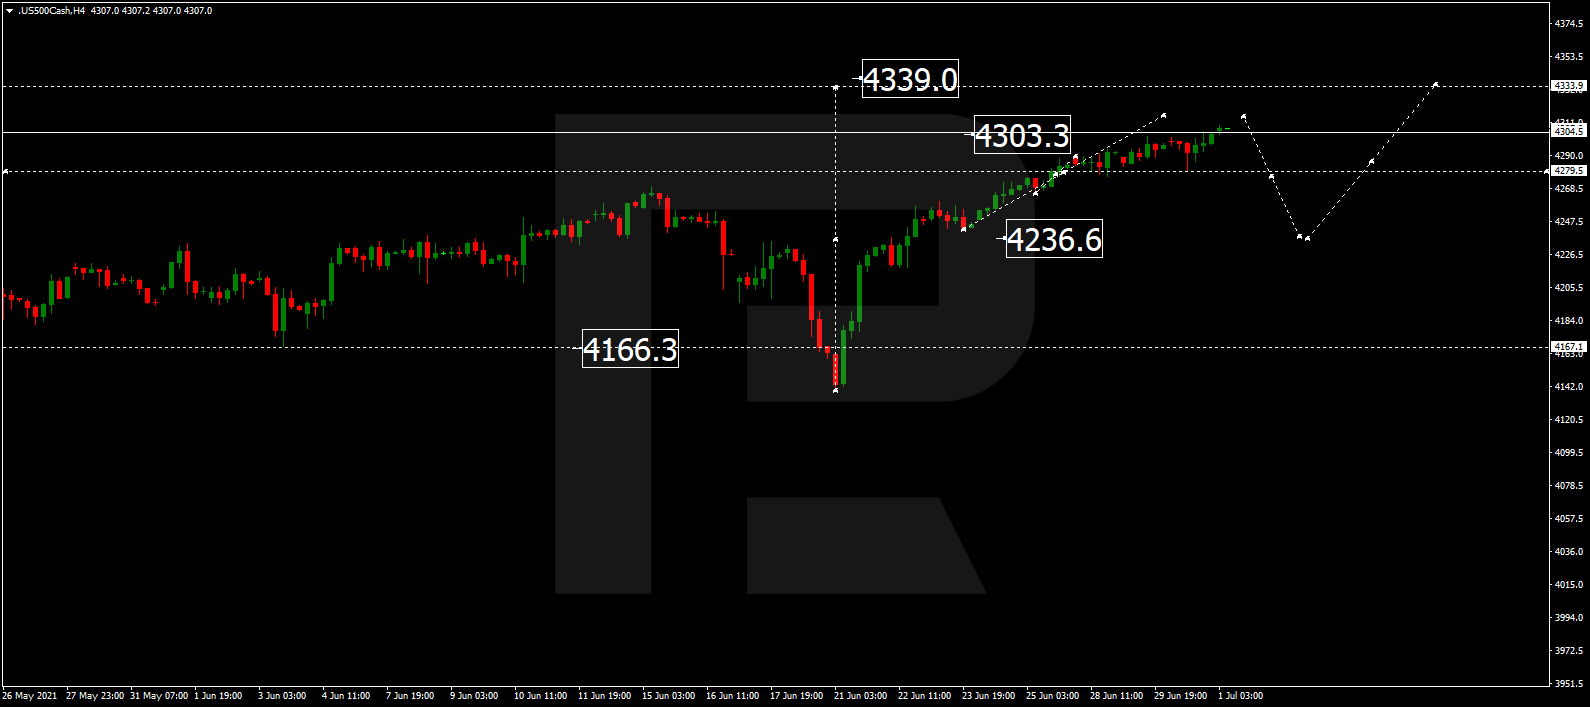
Stocks onwards and upwards
US stocks enjoyed a positive start to the new quarter and second half of the year, marking new record highs. While in Asia, China stocks are on pace to post their biggest one-day drop in more than three months on concerns over slowing economic growth and tighter credit conditions. European bourses have opened up in the green, as investors decide if the glass half full approach is the name of the game today.
Disclaimer: The content in this article comprises personal opinions and should not be construed as containing personal and/or other investment advice and/or an offer of and/or solicitation for any transactions in financial instruments and/or a guarantee and/or prediction of future performance. ForexTime (FXTM), its affiliates, agents, directors, officers or employees do not guarantee the accuracy, validity, timeliness or completeness, of any information or data made available and assume no liability as to any loss arising from any investment based on the same.
![]() Article by ForexTime
Article by ForexTime
ForexTime Ltd (FXTM) is an award winning international online forex broker regulated by CySEC 185/12 www.forextime.com