
Article By RoboForex.com
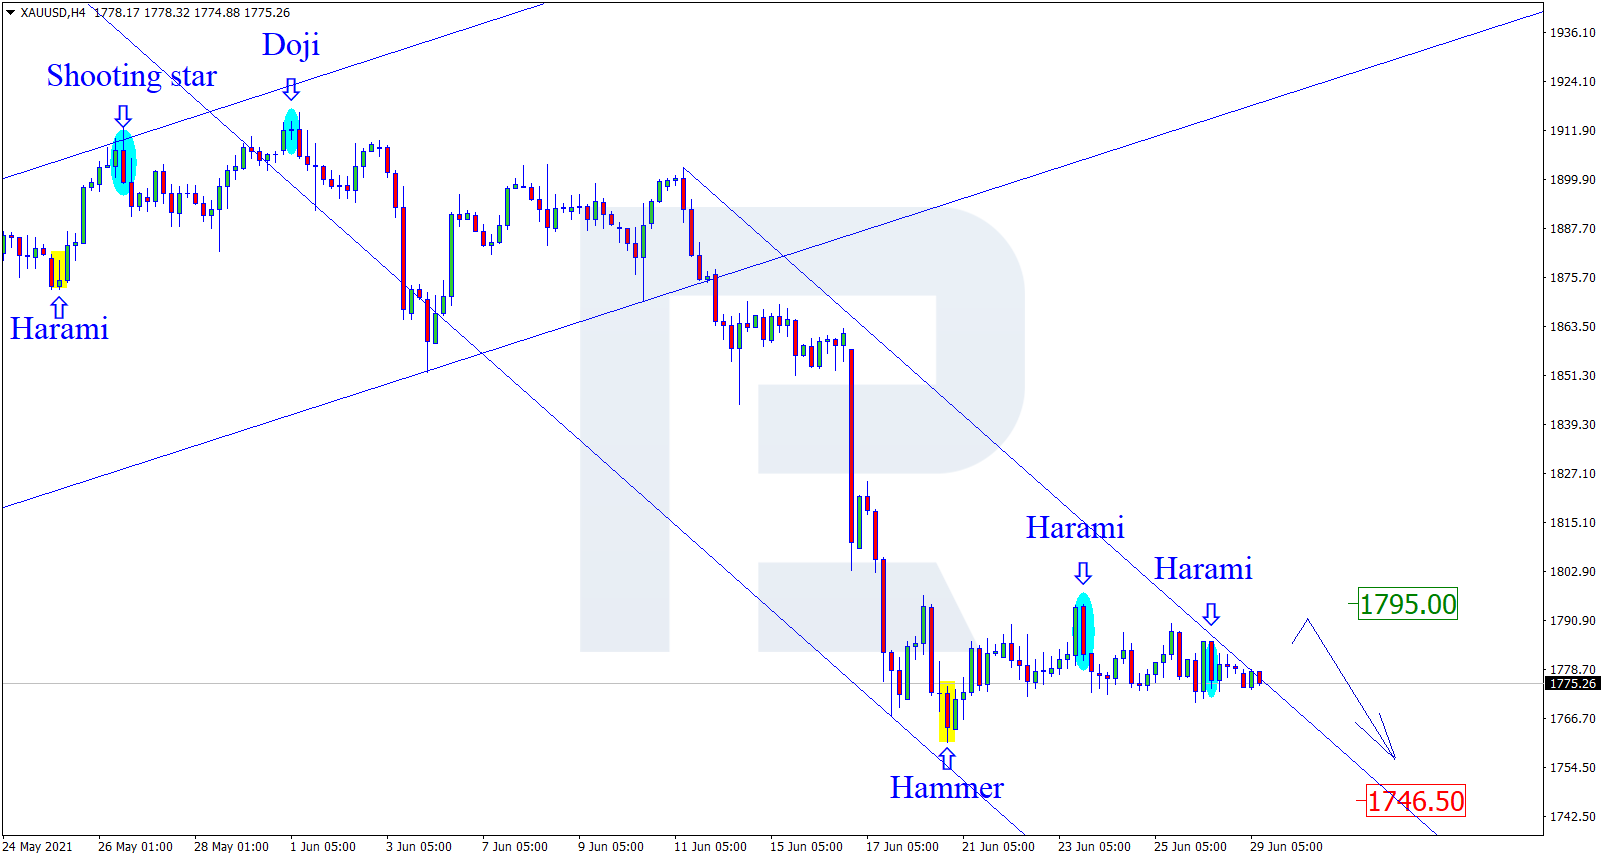
XAUUSD, “Gold vs US Dollar”
As we can see in the H4 chart, the asset continues moving sideways not far from the support level, where it has formed several reversal patterns, such as Harami. At the moment, XAUUSD may reverse and start a new decline to reach the support area at 1746.50. At the same time, an opposite scenario implies that the price may correct towards 1795.00 before resuming the descending tendency.

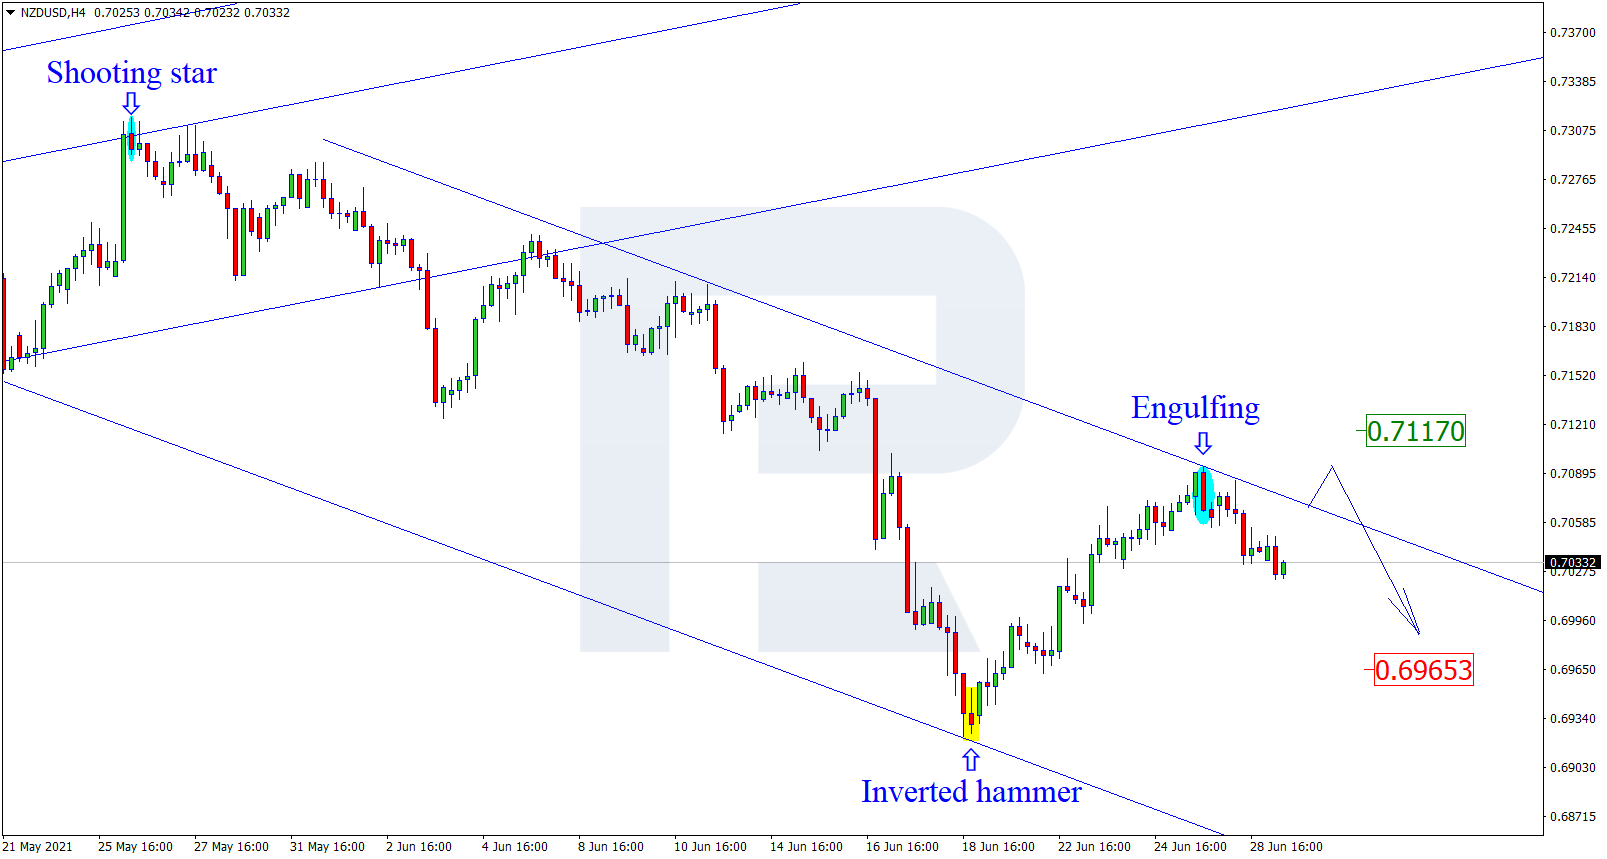
NZDUSD, “New Zealand vs US Dollar”
As we can see in the H4 chart, the descending tendency continues. By now, NZDUSD has formed several reversal patterns, such as Engulfing, close to the resistance level. At the moment, the pair is reversing and may later fall towards the support area at 0.6965. After testing this level, the asset may break it and continue moving downwards. However, an alternative scenario implies that the price may correct towards 0.7117 and then resume falling.
Free Reports:
 Get our Weekly Commitment of Traders Reports - See where the biggest traders (Hedge Funds and Commercial Hedgers) are positioned in the futures markets on a weekly basis.
 Sign Up for Our Stock Market Newsletter – Get updated on News, Charts & Rankings of Public Companies when you join our Stocks Newsletter
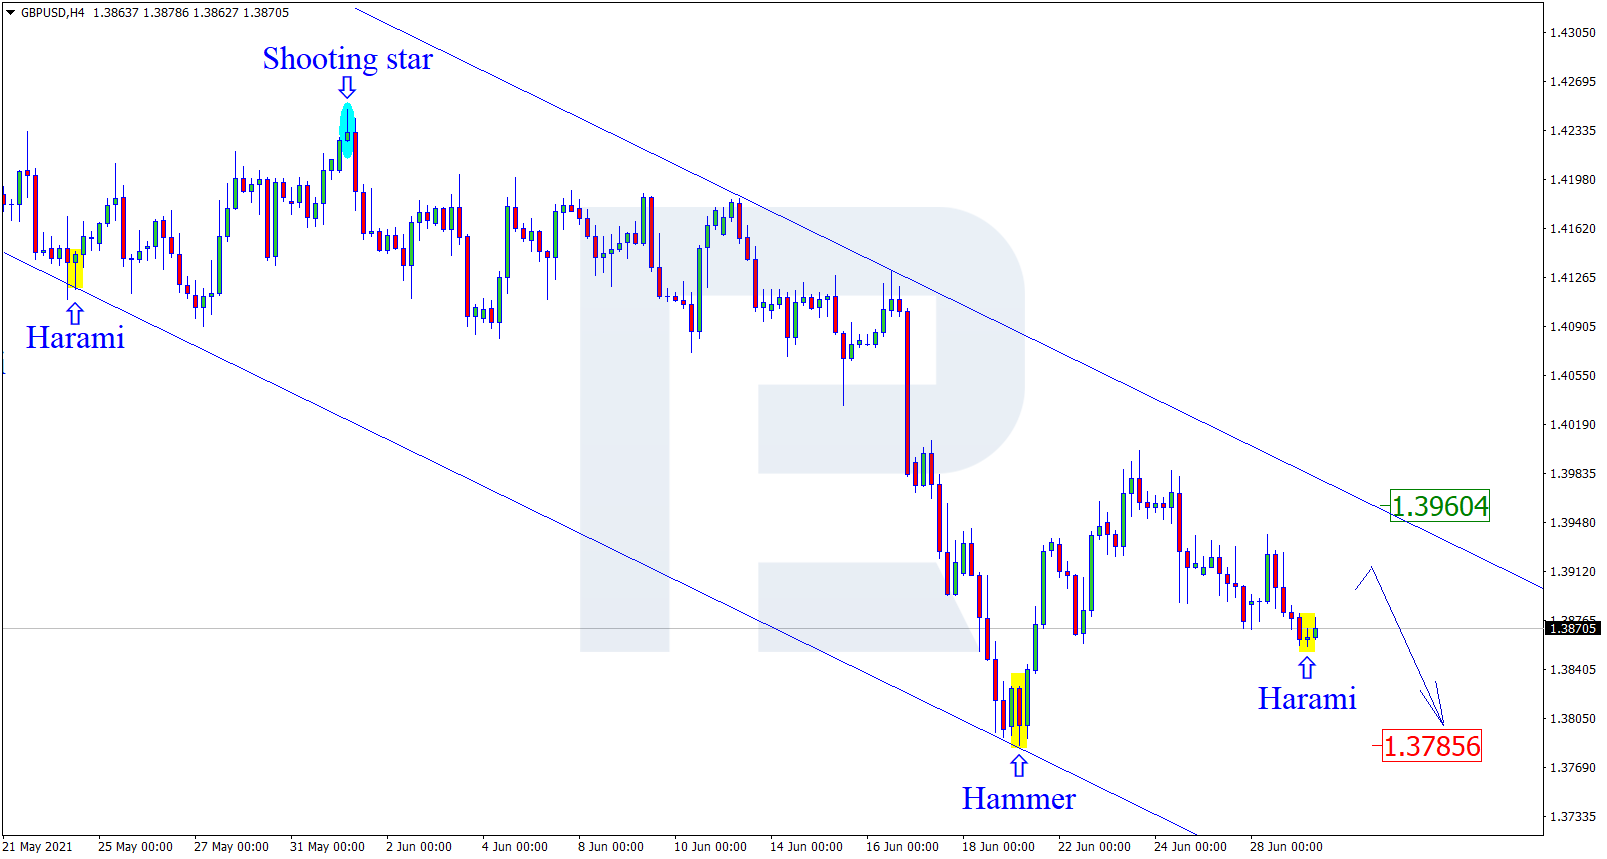
GBPUSD, “Great Britain Pound vs US Dollar”
As we can see in the H4 chart, the asset is forming another correction within the downtrend. By now, GBPUSD has formed several reversal patterns, such as Harami, not far from the support area. At the moment, the pair may reverse and start a new pullback towards the channel’s upside border. In this case, the correctional target may be the resistance level at 1.3960. After testing it, the market may rebound and resume falling with the target at 1.3785.
Article By RoboForex.com
Attention!
Forecasts presented in this section only reflect the author’s private opinion and should not be considered as guidance for trading. RoboForex LP bears no responsibility for trading results based on trading recommendations described in these analytical reviews.

- The US Tech sector hit by sell‑off. Oil prices decline on renewed negotiations Jul 28, 2026
- Gold Declines, Focus on Fed and Falling Oil Prices Jul 28, 2026
- This week will be one of the most crowded for central‑bank meetings Jul 27, 2026
- EUR/USD Ahead of a Key Week: Holding Near Lows Jul 27, 2026
- COT Metals Charts: Weekly Speculator Changes led by Copper Jul 26, 2026
- COT Bonds Charts: Speculator Bets led by SOFR 3-Months & 5-Year Bonds Jul 26, 2026
- COT Energy Charts: Weekly Speculator Bets led by WTI Crude & Natural Gas Jul 26, 2026
- COT Soft Commodities Charts: Weekly Speculator Bets led by Corn & Soybeans Jul 26, 2026
- The US introduces new import tariffs for 60 countries. Brent crude surpasses $100 per barrel Jul 24, 2026
- USD/JPY Breaks Records: Nothing Slows the Yen’s Decline Jul 24, 2026