By Lukman Otunuga Research Analyst, ForexTime
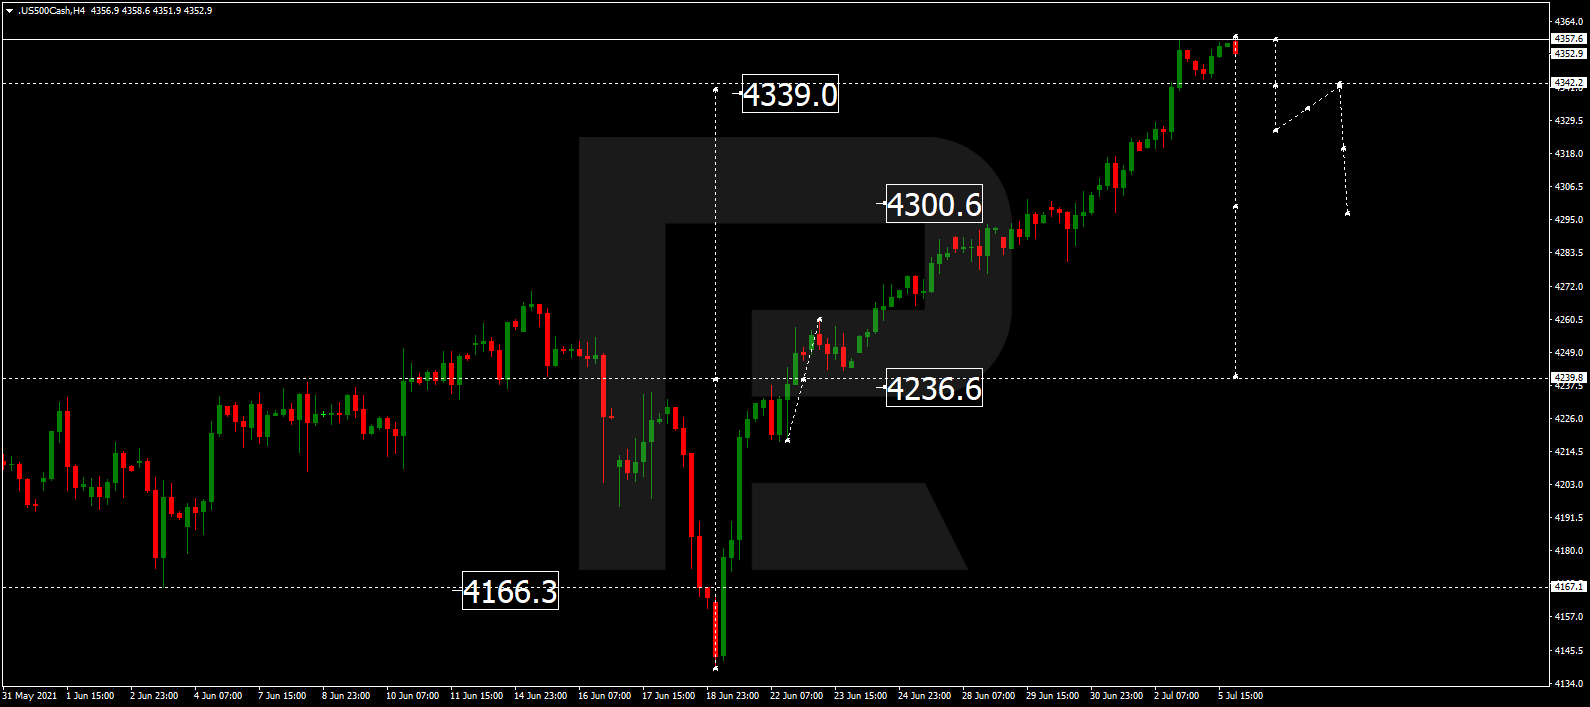
After several days of record closes, stock markets finally took a breather amid rising concerns over the reflation trade, slowing economic data and the Delta variant. Coming back from a long weekend break, Wall Street got off to a weak start as even the S&P500 broke a seven-day streak of gains with value names like financials and energy stocks suffering and also hurting the Dow which closed lower by 0.6%. US stock futures are modestly in the green this morning with European bourses also firmer.
Plunging US bond yields
The yield on the US 10-year Treasury touched 1.34% yesterday while real yields which take into account inflation touched -1%. This dragged down the small cap Russell index while helping the tech-laden Nasdaq to a new all-time high on the close. Bond yields were pushed to the lowest level since February on the back of a disappointing survey which showed a slight cooling in the red-hot US services sector, though at 60.1, the ISM index is still historically high. In among the details of the report, it seems there is a speed limit to the recovery amid a shortage of inputs and labour, alongside still elevated costs.
As we move further into the summer months, low volumes across markets may mean we get a lot of noise and less concrete signals. Traders will be watching big levels in the US 10-year Treasury yield with 1.20-1.25% as the next key support level and resistance now in the 1.40-1.45% area.
Dollar back to recent highs, FOMC minutes eyed
With the shift in risk mood, dollar buyers were out in force and pushed the DXY index close to recent highs.
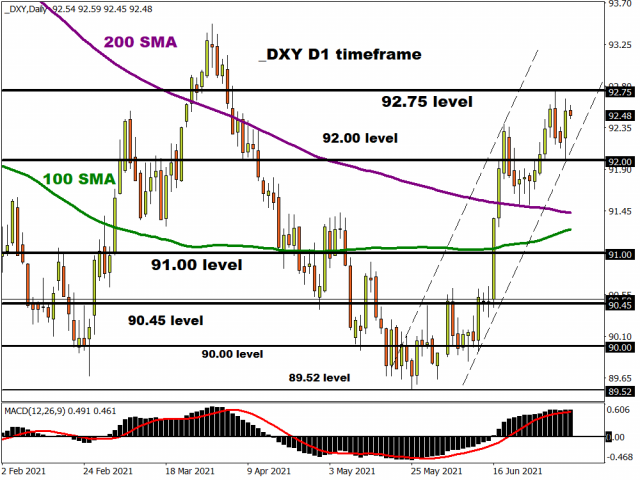
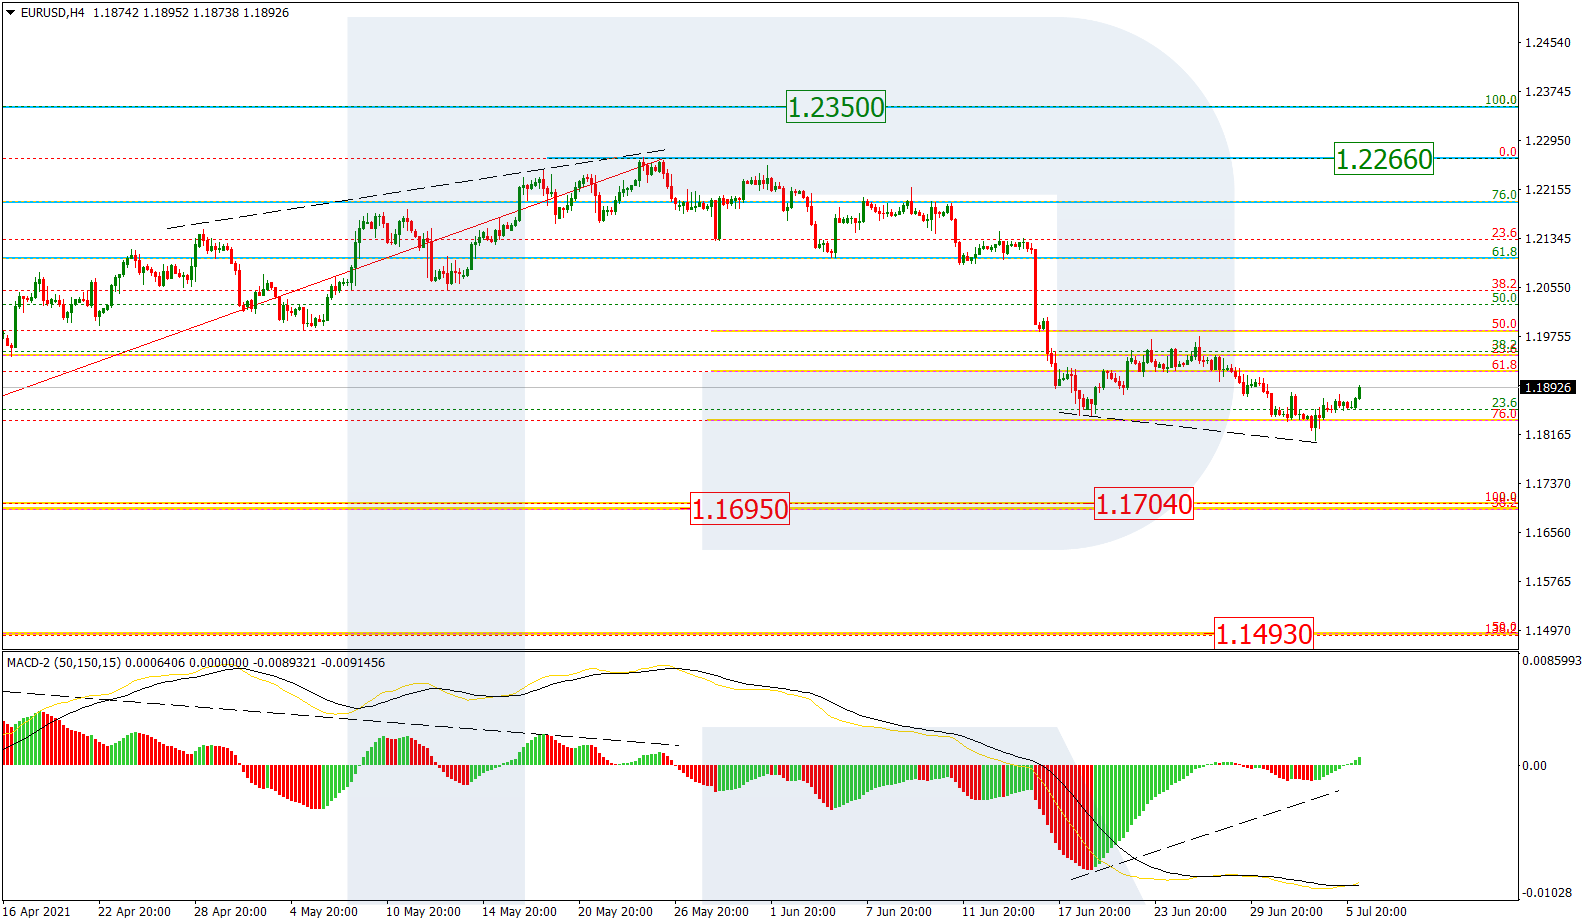
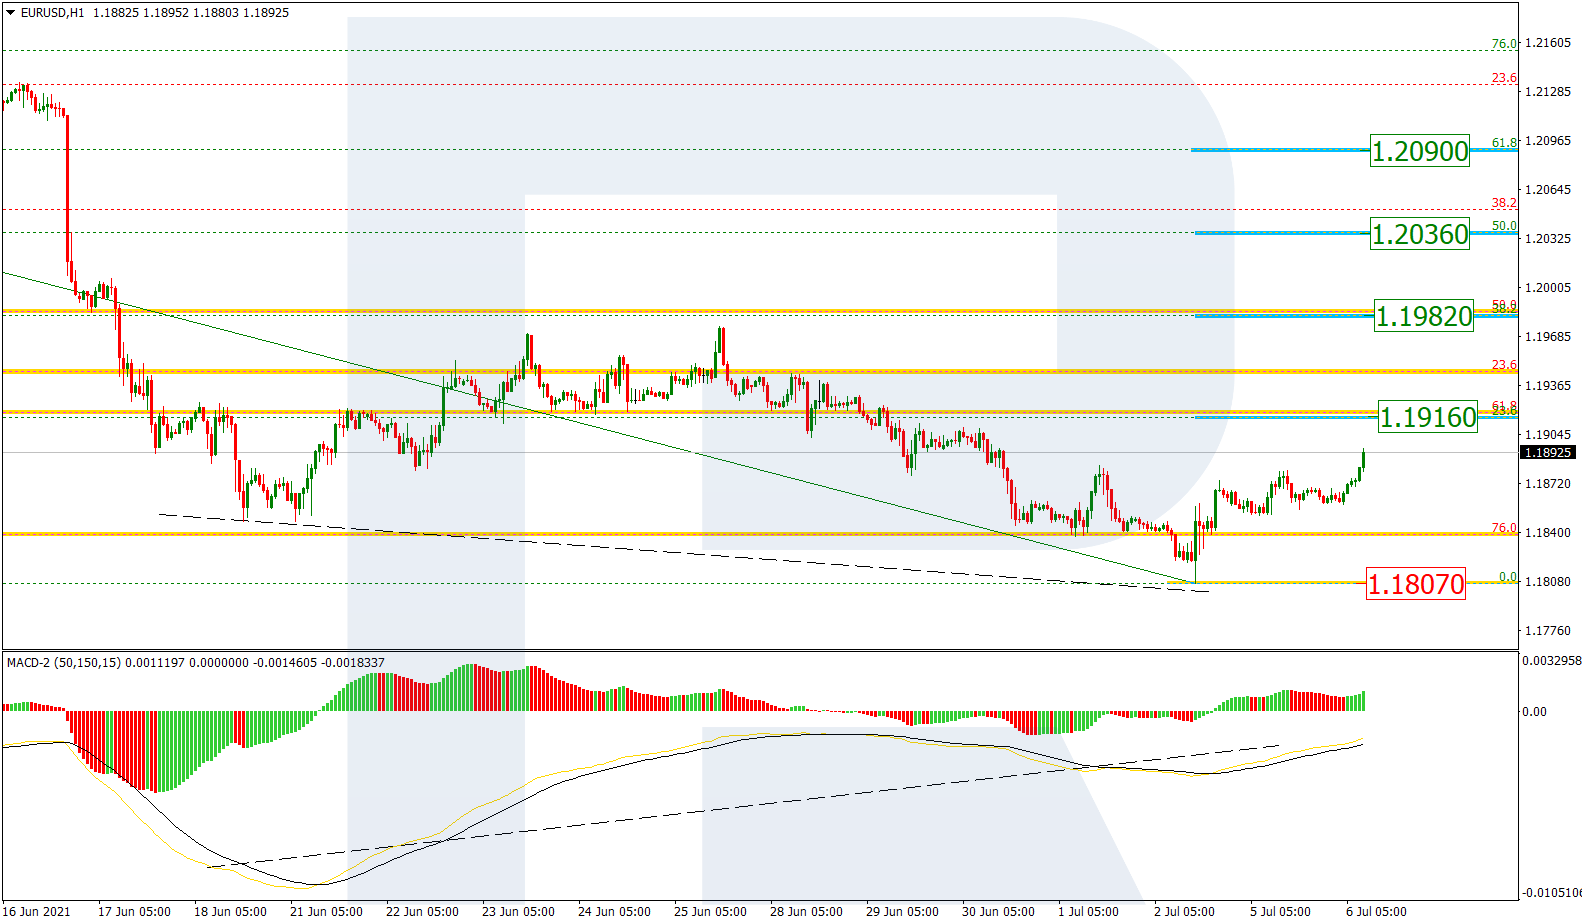
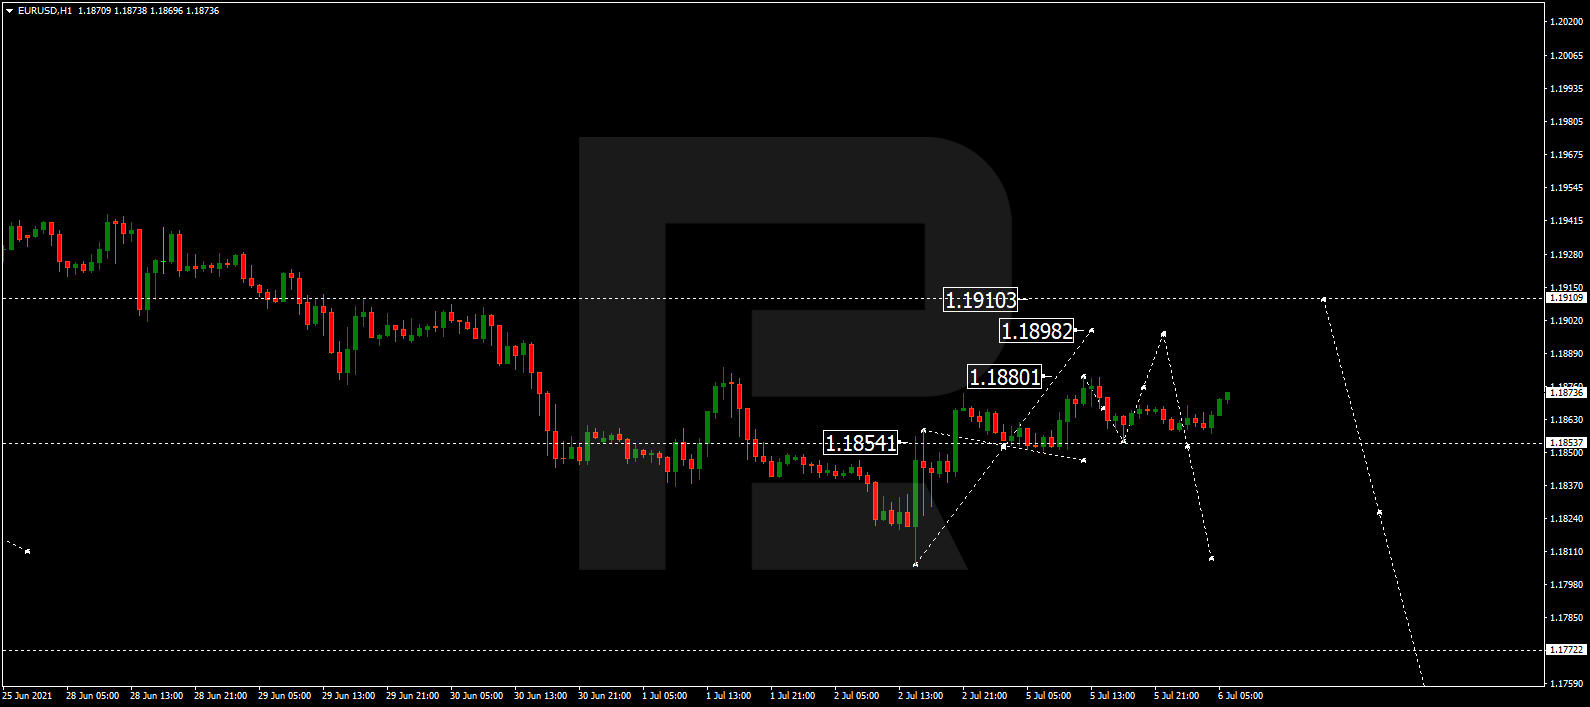
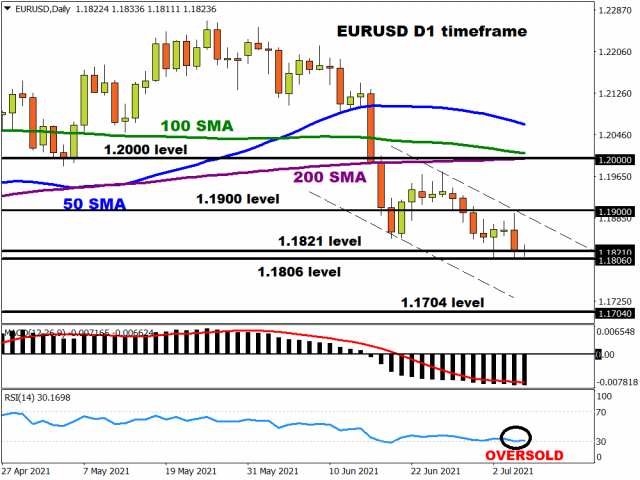
Minutes of the Fed’s June policy meeting due later today might show how serious members were about tapering their asset buying and how early rate hikes could begin after the bullish moves in the “dot plot”. Expectations of a hawkish tone have also helped the greenback with the euro dropping back to 1.1821, near its lowest since March.
There is little support beyond 1.1806/07 in EUR/USD ahead of this year’s low at 1.1704. The daily RSI is touching oversold levels once again, but it seems dollar strength can linger with a fairly sanguine risk environment not damaging for DXY.
Disclaimer: The content in this article comprises personal opinions and should not be construed as containing personal and/or other investment advice and/or an offer of and/or solicitation for any transactions in financial instruments and/or a guarantee and/or prediction of future performance. ForexTime (FXTM), its affiliates, agents, directors, officers or employees do not guarantee the accuracy, validity, timeliness or completeness, of any information or data made available and assume no liability as to any loss arising from any investment based on the same.
![]() Article by ForexTime
Article by ForexTime
ForexTime Ltd (FXTM) is an award winning international online forex broker regulated by CySEC 185/12 www.forextime.com