by JustForex
The EUR/USD currency pair
- Prev Open: 1.1823
- Prev Close: 1.1790
- % chg. over the last day: -0.28%
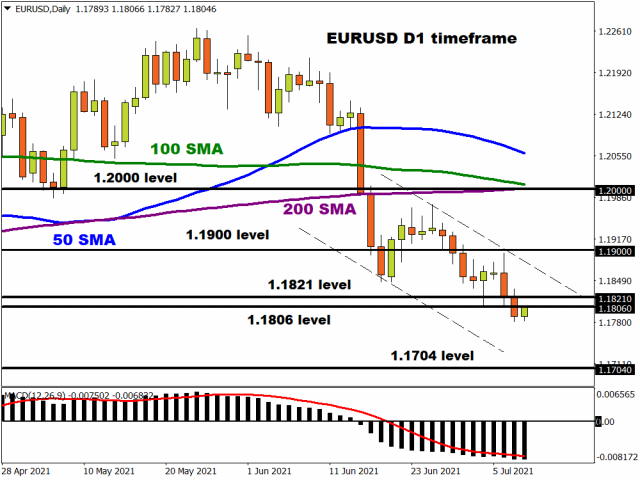
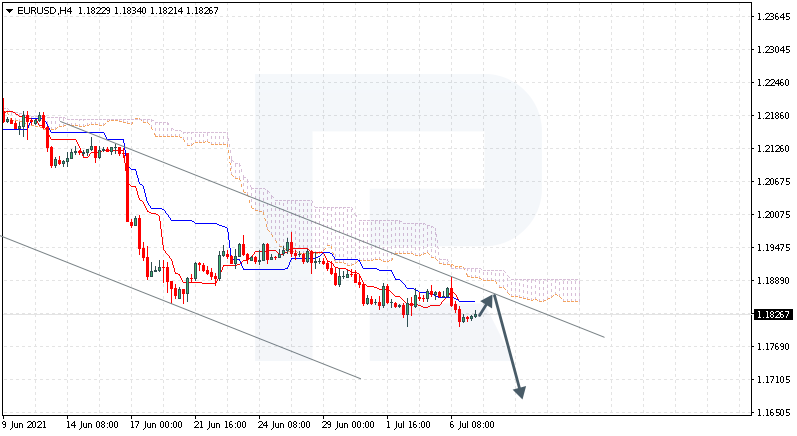
Because of the dollar index growth, the EUR/USD currency pair fell by another 0.28%, breaking through the support level of 1.1809. The overall fundamental picture is starting to change as the United States is planning to cut the QE program, and Europe is not doing it so far. It will push the EUR/USD quotes down. The ECB monetary policy meeting is expected today.
- Support levels: 1.1746, 1.1609
- Resistance levels: 1.1809, 1.1847, 1.1889, 1.1934, 1.1969
The trend is still bearish. The price broke through the support level of 1.1809 and fixed lower. The initiative from the buyers is very weak. The MACD indicator is in the negative zone, and there are signs of divergence on the higher timeframes. Under such market conditions, it is better to trade intraday. To sell, traders need to wait for a pullback to the nearest resistance levels. It is necessary to be careful with buy trades, as the price can drop to the next support level.
Alternative scenario: if the price breaks out through the 1.1889 resistance level and fixes above, the general uptrend is likely to be resumed.

- – ECB Monetary Policy Statement at 14:30 (GMT+3);
- – US Initial Jobless Claims (w/w) at 15:30 (GMT+3).
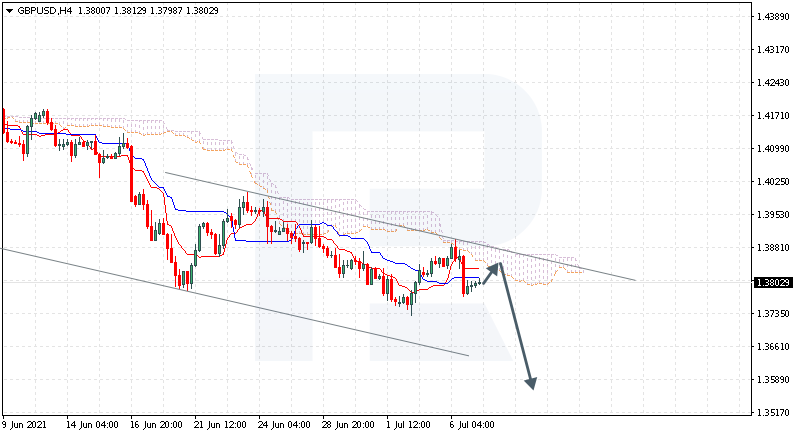
The GBP/USD currency pair
- Prev Open: 1.3795
- Prev Close: 1.3798
- % chg. over the last day: +0.02%
The British pound looks a bit more confident than the euro. First of all, it is because the UK is a major supplier of Brent crude oil. However, for the last 2 days, oil is also correcting downward, so against the background of the dollar index growth, the British pound is slowly sliding to the support level of 1.3756.
- Support levels: 1.3756
- Resistance levels: 1.3835, 1.3923, 1.4002, 1.4075, 1.4101, 1.4138, 1.4191
The GBP/USD trend is bearish on the H1 timeframe. Buying pressure has become weak now; the price drops below the moving average. The MACD indicator is in the negative zone, but there are signs of divergence. Under such market conditions, traders are better to look for both sell trades from the resistance levels and buy trades from the support levels on the intraday timeframes.
Alternative scenario: if the price breaks out through the 1.3922 resistance level and consolidates above, the bearish scenario is likely to be canceled.

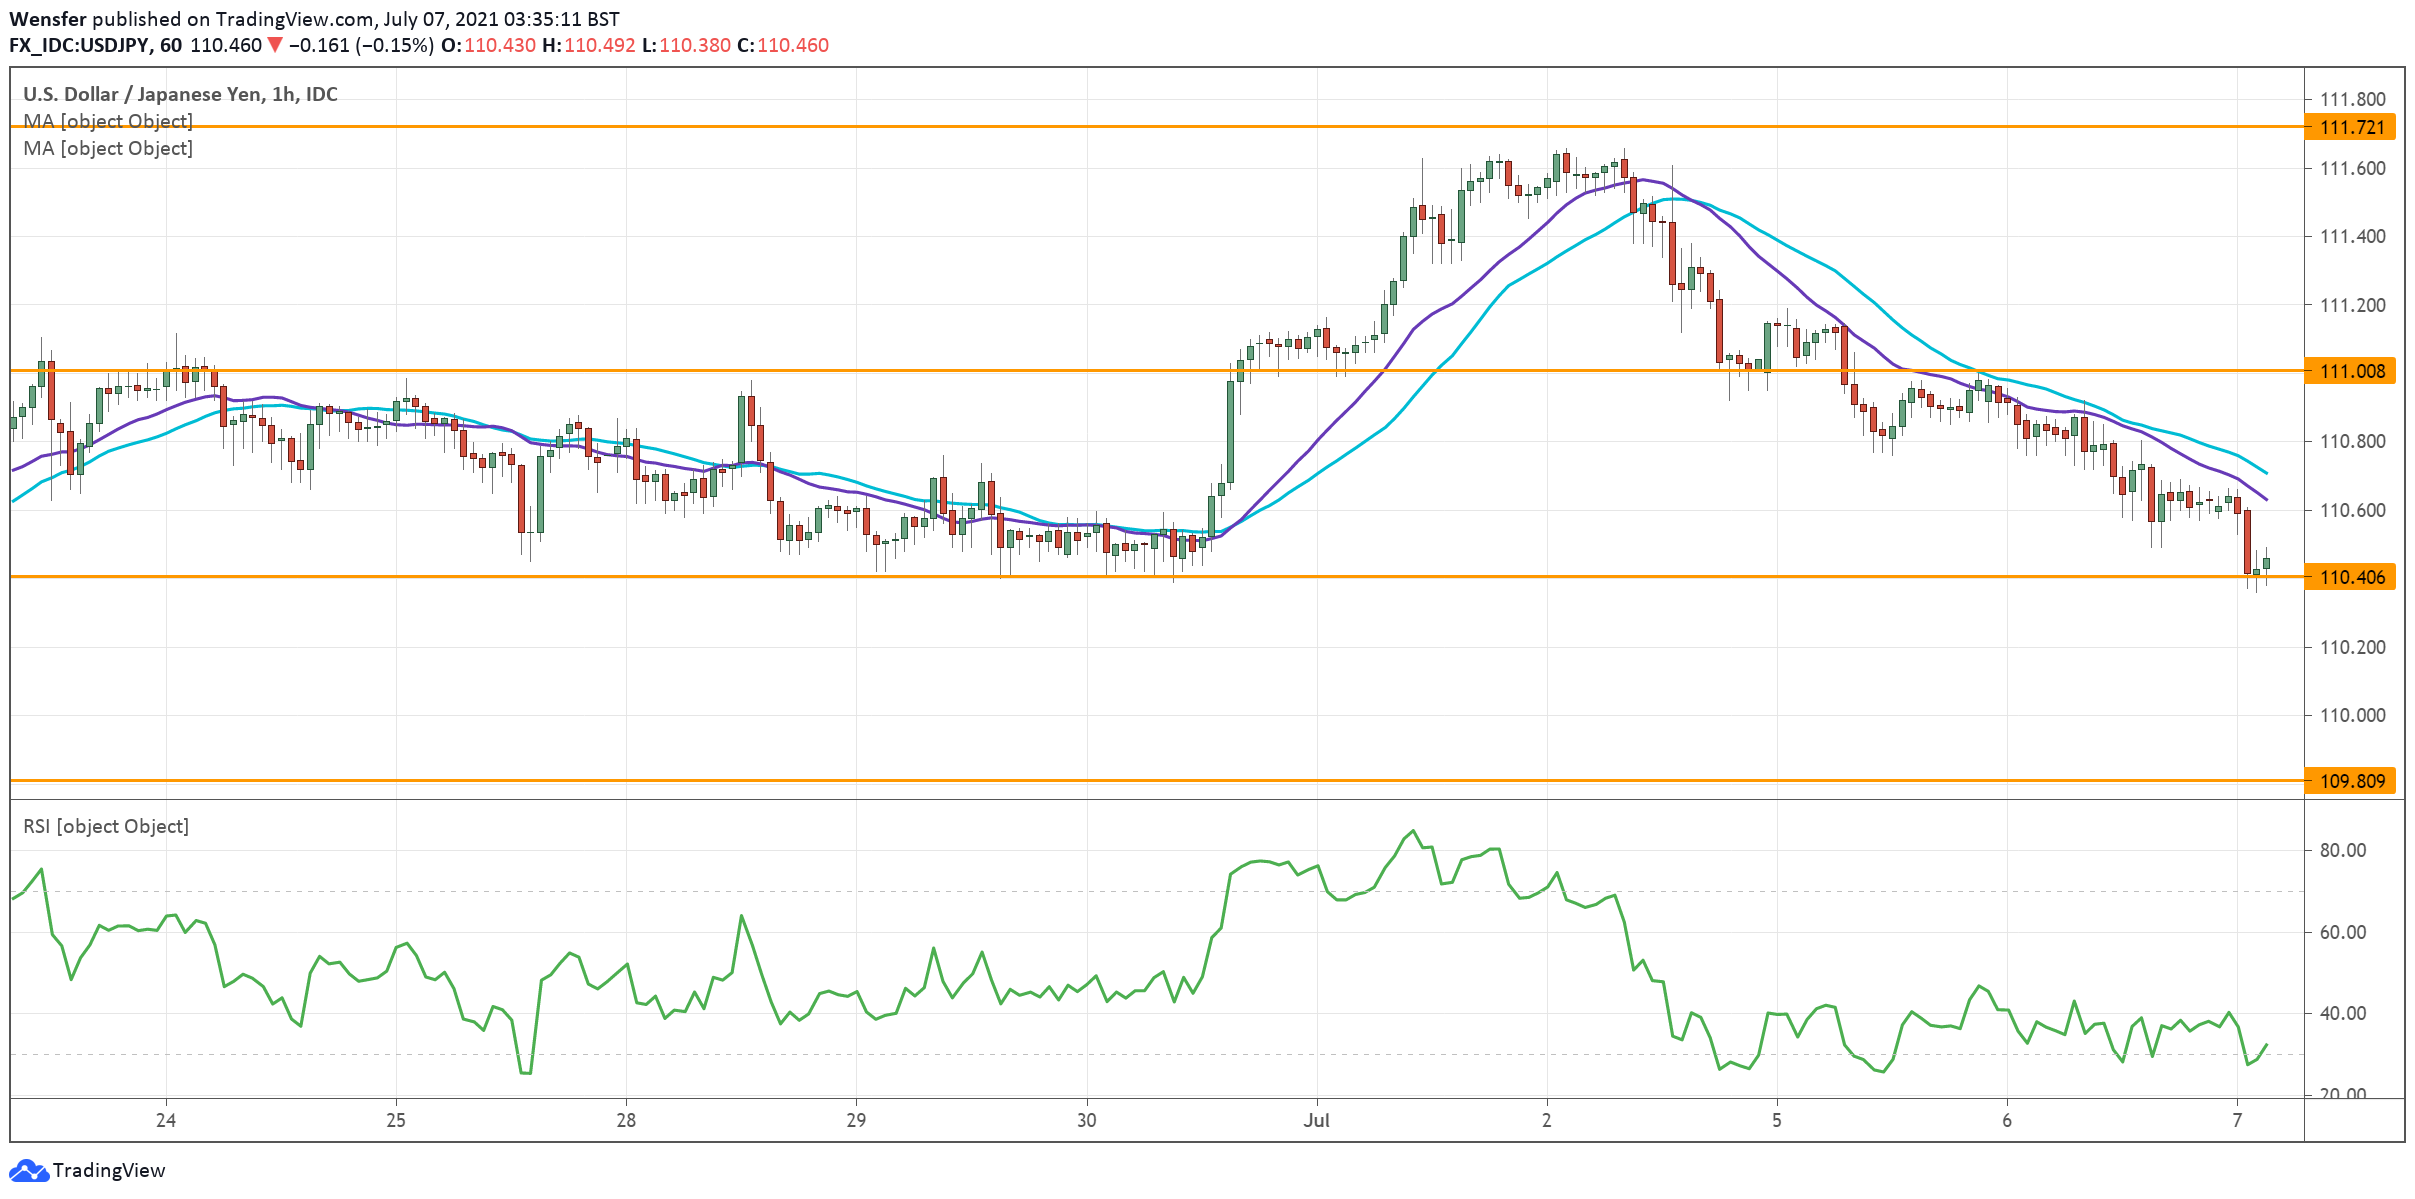
The USD/JPY currency pair
- Prev Open: 110.61
- Prev Close: 110.61
- % chg. over the last day: 0.00%
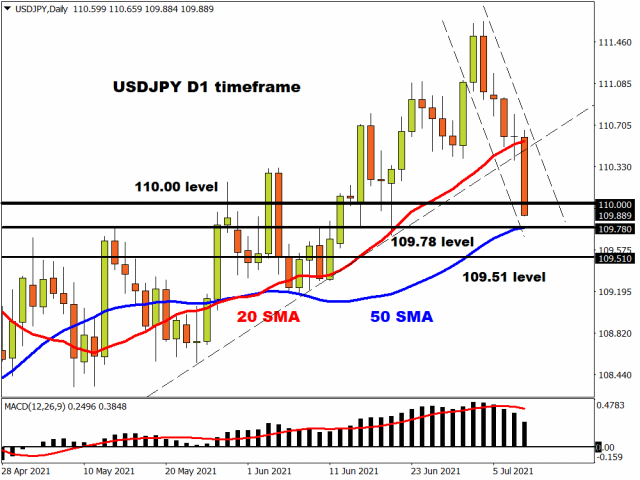
The situation with the USD/JPY currency pair remains the same. The Japanese Yen futures are growing as well as the dollar index futures. It turns out that both currencies are strengthening, even with a slight advantage to the strengthening of the yen. Such a fundamental picture contributes to the formation of trading corridors on the charts.
- Support levels: 110.47, 109.83, 109.62, 109.31
- Resistance levels: 110.73, 111.06, 111.48, 110.73, 112.18
From the point of view of technical analysis, the trend remains bullish. The price reached the change priority level yesterday and tried to break down through it, but the buyers managed to defend their positions. Today, the sellers are trying to break the priority change level again during the morning session. It’s better to wait for the price to consolidate below the 110.47 level. There is no optimal entry point for buying now, only if a false breakout occurs and the price sharply returns above the 110.47 level.
Alternative scenario: if the price falls below 110.47, the general downtrend is likely to be resumed.

The USD/CAD currency pair
- Prev Open: 1.2459
- Prev Close: 1.2483
- % chg. over the last day: +0.19%
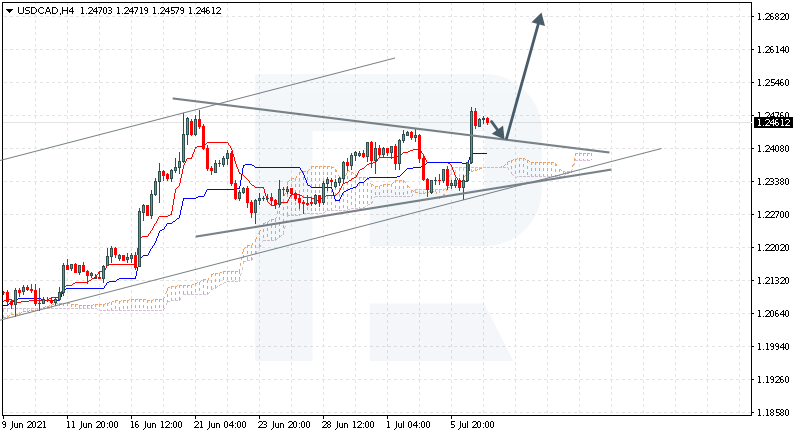
The growth of the dollar index and the fall in oil prices contributes to the upward trend on the USD/CAD currency pair. The price easily breaks throughout all resistance levels, but the first signs of a corrective wave have already appeared.
- Support levels: 1.2478, 1.2404, 1.2347, 1.2312, 1.2260, 1.2190
- Resistance levels: 1.2519, 1.2587
Technically, the trend remains bullish. The price is trading above the moving average, but there is a strong deviation from the midline. The MACD indicator has returned to the positive zone but with signs of divergence. Under such market conditions, it is best to trade on the lower timeframes. Buyers need to wait for a slight pullback to the nearest support levels. Traders can also look for entry points on intraday timeframes for short positions, but only with short targets because it will be trading against the trend.
Alternative scenario: if the price breaks down through the 1.2312 support level and fixes below, the downtrend is likely to be resumed.

by JustForex
This article reflects a personal opinion and should not be interpreted as an investment advice, and/or offer, and/or a persistent request for carrying out financial transactions, and/or a guarantee, and/or a forecast of future events.