Archive for Forex and Currency News – Page 247

EURUSD Testing Significant Support

By Dmitriy Gurkovskiy, Chief Analyst at RoboForex

This week’s key highlight will be the US Federal Reserve meeting and it might well be that sellers break important support at 1.1755 on expectations of the above-mentioned event. Despite being very concerned about a new coronavirus strain and possible lockdowns all around the world, financial markets continue pushing the American regulator to make it tighten its monetary policy. Inflation is high and may force the American regulator to be more aggressive. Also, there are risks of seeing a reduction in liquidity on behalf of the Fed, while the European Central Bank is expanding its money printing press capacity. Taken together, these factors are in favour of further USD strengthening.

The statistics published today showed that the German Ifo Business Climate dropped to 100.8 points. It means that the German businesses are predisposed more negatively than before as there are serious delivery issues, which, in their turn, put significant pressure on both industrial and retail sectors of the economy. It was said that over 60% of the companies reported a shortage of raw materials required for manufacturing, as well as an upsurge in raw material prices. In this light, the German industry can not operate at its normal pace. Unfortunately for the European currency, it is happening at a time when the USA is experiencing a relatively powerful economic recovery and this will put additional pressure on the major currency pair.

In the H4 chart, EUR/USD is falling towards 1.1725 and may later correct to reach 1.1800. After that, the instrument may resume trading downwards with the target at 1.1690. From the technical point of view, this scenario is confirmed by MACD Oscillator: its signal line is trading below 0, thus confirming a further downtrend on the price chart.

As we can see in the H1 chart, after falling and reaching 1.1755, EUR/USD has completed the ascending correctional impulse at 1.1800. Possibly, the pair may rebound from the latter level and resume trading within the downtrend with the short-term target at 1.1725. From the technical point of view, this scenario is confirmed by the Stochastic Oscillator: after rebounding from 80, its signal line is steadily moving downwards to reach 50. Later, the line may break 50 and continue falling towards 20.

Disclaimer

Any forecasts contained herein are based on the author’s particular opinion. This analysis may not be treated as trading advice. RoboForex bears no responsibility for trading results based on trading recommendations and reviews contained herein.

NZDUSD Has Cycle Intervening Wave X Ended?

By Orbex

The current structure of the NZDUSD pair hints at the completion of an intervening wave x of the cycle degree. The pattern has taken the form of a primary double zigzag.

In the last section of the chart, we see an upward move, which could indicate the development of the initial part of the cycle wave y. This could also be a primary double zigzag, like the previous wave x.

We can expect the end of the first actionary wave Ⓦ in the area of 0.731. This was formed by the intervening wave Ⓧ.

There is a possible second option, where the formation of the cycle intervening wave x has not yet ended. Perhaps its last primary wave Ⓨ is still under development, or rather its intermediate wave (Y).

Wave (Y) suggests a bearish triple zigzag, which consists of minor sub-waves W-X-Y-X-Z.

In the near future, the pair will continue to decline in wave Z to 0.679, where primary waves Ⓦ and Ⓨ will be equal.

By Orbex

Japanese Candlesticks Analysis 26.07.2021 (USDCAD, AUDUSD, USDCHF)

Article By RoboForex.com

USDCAD, “US Dollar vs Canadian Dollar”

As we can see in the H4 chart, the asset continues the correction. After forming several reversal patterns, such as Hammer and Engulfing, close to the support area, USDCAD may reverse and start a new growth towards the resistance level at 1.2755. However, an alternative scenario implies that the asset may continue falling to reach 1.2520 before resuming its growth.

USDCAD
Risk Warning: the result of previous trading operations do not guarantee the same results in the future

AUDUSD, “Australian Dollar vs US Dollar”

As we can see in the H4 chart, AUDUSD has formed several reversal patterns during the pullback, such as Doji, not far from the resistance level. At the moment, the asset may reverse in the form of a new decline within the descending channel. In this case, the downside target may be the support area at 0.7260. At the same time, an opposite scenario implies that the price may correct towards the resistance level at 0.7400 and then resume the descending tendency.

AUDUSD
Risk Warning: the result of previous trading operations do not guarantee the same results in the future

USDCHF, “US Dollar vs Swiss Franc”

As we can see in the H4 chart, the correction continues. By now, the pair has formed several reversal patterns, for example, Shooting Star, close to the resistance area. At the moment, USDCHF may reverse and start a new pullback. In this case, the correctional target may be the support level at 0.9160. Still, there might be an alternative scenario, according to which the asset may grow towards 0.9245 without testing the support level.

USDCHF

Article By RoboForex.com

Attention!
Forecasts presented in this section only reflect the author’s private opinion and should not be considered as guidance for trading. RoboForex LP bears no responsibility for trading results based on trading recommendations described in these analytical reviews.

The Analytical Overview of the Main Currency Pairs on 2021.07.26

by JustForex

The EUR/USD currency pair

Technical indicators of the currency pair:
  • Prev Open: 1.1769
  • Prev Close: 1.1771
  • % chg. over the last day: +0.02%

Compared to Friday, the situation on the EUR/USD currency pair has not changed. Last week, the ECB hinted at a longer period of monetary support, as a new wave of the coronavirus pandemic could pose a risk to eurozone economic recovery. But Friday’s business activity (PMI) data showed a positive growth trend, jumping to the highest level since June 2006.

Trading recommendations
  • Support levels: 1.1761, 1.1746, 1.1609
  • Resistance levels: 1.1822, 1.1834, 1.1879, 1.1934, 1.1969

From the technical point of view, the trend is still bearish. Now the price is trading in a narrow range within a broader 1.1761-1.1823 price range. The negative situation for the European currency remains unchanged, but short-term upward movements are not excluded. In such market conditions, traders should look for the sell positions from the resistance levels. Buy positions can be considered only on the intraday timeframes after the price breaks through the narrow range upwards.

Alternative scenario: if the price breaks through the 1.1879 resistance level and fixes above, the general uptrend is likely to be resumed.

EUR/USD
News feed for 2021.07.26:
  • – Germany Ifo Business Climate Index (m/m) at 11:00 (GMT+3);
  • – US New Home Sales (m/m) at 17:00 (GMT+3).

The GBP/USD currency pair

Technical indicators of the currency pair:
  • Prev Open: 1.3749
  • Prev Close: 1.3741
  • % chg. over the last day: +0.06%

The British pound looks more confident than the euro. But due to the rapid spread of the delta strain in the UK and across Europe, economic growth forecasts for July are expected to be weak as more people are forced to self-isolate in accordance with government regulations. Because of a growing shortage of supermarket goods in the UK, food retail staff won’t be quarantined for ten days if someone has been in close contact with the infected person.

Trading recommendations
  • Support levels: 1.3721, 1.3676 ,1.3641, 1.3614, 1.3525
  • Resistance levels: 1.3805, 1.3899, 1.3923, 1.4002, 1.4075, 1.4101

The trend on the GBP/USD currency pair is downward on the H1 timeframe. But buyers are still able to keep the course from falling. The MACD indicator has become inactive. Under such market conditions, traders are better to look for both sell deals from the resistance levels within the trend and buy deals from the support levels, but only on the intraday timeframes and with short targets.

Alternative scenario: if the price breaks through the 1.3839 resistance level and consolidates above, the bearish scenario is likely to be canceled.

GBP/USD
There is no news feed for today.

The USD/JPY currency pair

Technical indicators of the currency pair:
  • Prev Open: 110.12
  • Prev Close: 110.54
  • % chg. over the last day: +0.38%

The manufacturing activity of Japan showed the weakest growth over the past five months in July as the country is faced with serious challenges because of COVID-19 cases, which are forcing the government to extend restrictions and hinder economic recovery. Meanwhile, the services sector of Japan declined even more sharply in July. The stronger contraction in this sector came on the back of stronger declines in production, new orders, and new export orders.

Trading recommendations
  • Support levels: 110.17, 109.70, 109.19, 108.65
  • Resistance levels: 110.41, 110.73, 111.06, 111.48, 110.73, 112.18

In terms of technical analysis, the situation has become uncertain. On the one hand, the price broke through the priority change level on Friday. On the other hand, the price failed to consolidate higher and returned back under the level. Traders are better to consider intraday trading now. For buy positions, it’s better to wait for a pullback to the nearest support level. Sell positions should be considered only from resistance levels and with short targets.

Alternative scenario: if the price falls below 109.70, the downtrend is likely to be resumed.

USD/JPY
There is no news feed for today.

The USD/CAD currency pair

Technical indicators of the currency pair:
  • Prev Open: 1.2562
  • Prev Close: 1.2560
  • % chg. over the last day: -0.01%

The situation with the USD/CAD currency pair has not changed. The Canadian dollar is a commodity currency and is highly dependent on oil price movements. Oil is now trading in the narrow price corridor, causing a consolidation on the USD/CAD currency pair. Analysts expect a short-term downward correction of oil, which will lead to an increase in USD/CAD quotes. Statistical Department of Canada released the data on retail sales on Friday. In May, receipts fell by 2.1% due to the COVID-19 shutdown, but sales increased by 4.4% as restrictions in the country were weakened. Also, the Federal agency reported on creating 230,700 new jobs for June.

Trading recommendations
  • Support levels: 1.2561, 1.2519, 1.2448, 1.2404, 1.2347, 1.2312
  • Resistance levels: 1.2671, 1.2787, 1,2951

Technically, the trend remains bullish. But the price is trading right at the priority change level. The MACD indicator is inactive. Traders are better to play it safe and take action only after the price moves to one side of the narrow price range.

Alternative scenario: if the price breaks through the 1.2561 support level and fixes below, the downtrend is likely to be resumed.

USD/CAD
There is no news feed for today.

by JustForex


This article reflects a personal opinion and should not be interpreted as an investment advice, and/or offer, and/or a persistent request for carrying out financial transactions, and/or a guarantee, and/or a forecast of future events.

COT Speculator Extremes: Brazil Real leads weekly Bullish Standings, Mexican Peso is most Bearish

By CountingPips.com COT Home | Data Tables | Data Downloads | Newsletter 

The latest update for the weekly Commitment of Traders (COT) report was released by the Commodity Futures Trading Commission (CFTC) on Friday for data ending on Tuesday July 20 2021.

This weekly Extreme Positions report highlights the Most Bullish and the Most Bearish Positions for the speculator category. Extreme positioning in these markets can foreshadow strong moves in the underlying instrument.

To signify an extreme position, we use the Strength Index (also known as the COT Index) of each instrument, which has been a common method among many leading COT practitioners. The Strength Index is simply a comparison of current trader positions against the range of positions over the previous 3 years. We use over 80 percent as extremely bullish and under 20 percent as extremely bearish. (Compare Strength Index scores across all markets in the data tables)


Speculators or Non-Commercials Explained:

Speculators, classified as non-commercial traders by CFTC, are made up of large trading funds, hedge funds, commodity funds and other significant for-profit participants. The Specs are generally regarded as trend-followers in their behavior towards price action – net speculator bets and prices tend to go in the same directions. These traders often look to buy when prices are rising and sell when prices are falling. To illustrate this point, many times speculator contracts can be found at their most extremes (bullish or bearish) when prices are also close to their highest or lowest levels.

These extreme levels can potentially be a signal of overbought and oversold conditions and other times can signal a breakout and possibly a counter-trend move taking in the price trend. These processes can play out in weeks to over many months and even years.


Here Are This Week’s Most Bullish Speculator Positions:

Brazil Real

Brazil Real leads most extreme cot standings and currencies
The Brazil Real speculator trader’s futures position comes in as the most bullish extreme standing this week for a second straight week. The BRL speculator level is currently at a 99 percent score of its 3-year range just down from last week’s 100% strength score (meaning speculative sentiment is at the highest level over past three years).

The extreme positioning shows that speculators have been shedding their bearish sentiment in the real that had prevailed in the currency since the second half of 2019. The BRLUSD price has been on the back-foot against the dollar for some time now but perhaps the newfound positive sentiment among speculators portends a potential breakout higher in the future.


Coffee Futures

Coffee Futures Extreme Positions Bullish

Coffee positions are at the second highest extreme position with the Strength Index Level is now at a 95 percent score of its 3-year range. The Coffee net positions rose by 21.1 percent this week from last week. Sentiment among speculators has been bullish since late in 2019 but the Coffee prices have particularly shot up since the fourth quarter of 2020. Even earlier this week Coffee futures jumped as supply constraints continue to keep prices elevated. It would seem likely that Coffee speculator positioning may stay bullish for time to come.


2-Year Bond

2-Year Bond Speculators Bullish Extreme

The 2-Year Bond speculator trader’s futures position comes in third this week in the extreme standings. The 2-Year Strength Index Level resides at a 93 percent score of its 3-year range.

The 2-Year speculators heavily cut back on their bearish positions this week while their bullish positions rose – creating an extreme reading in positioning. This reflects a dent in the economic outlook earlier in the week (and a quick drop in longer term bond yields) perhaps due to the Delta variant. The big picture outlook in the 2-Year is not changed very much as the 2-Year price has not moved much and the 2-Year yield remains at a depressed rate of 0.20 percent.


This Week’s Most Bearish Speculator Positions:

Mexican Peso

Mexican Peso Bearish Extreme leads the Week

The Mexican Peso speculator trader’s futures position comes in as the most bearish extreme standing this week. The MXN Strength Index Level is at a 1 percent score of its 3-year range.

Peso positions are the most bearish extreme of the week for a second straight week. Peso speculators have had considerably lower sentiment for the Mexican currency since the all-time high positioning that prevailed in late 2019 and into early 2020. The MXNUSD currency pair has been trending higher since the COVID-induced crash in the currency in March 2020. However, with the current sentiment so low, a further push higher in price could prompt speculators to exit their bearish positions and help the case for peso bulls going forward.


Palladium

COT Extremes: Palladium Speculator Standings are bearish

The Palladium speculator trader’s futures position comes in next for the most bearish extreme standing on the week. The Palladium Strength Index Level is at a 7 percent score of its 3-year range.

Palladium positioning has remained very subdued since the onset of the COVID outbreak in early 2020. Speculative positioning went from very bullish (pre-COVID) to extremely bearish (post) in that time-frame. In fact, the open interest numbers show a very low participation rate in the trading with current open interest levels (contracts open in the market) about only a half to one-third the open interest levels before the outbreak. Despite this, the Palladium price has trended higher consistently and continues to be in a bull market.


Fed Funds

Rounding out the extreme bearish positions, the Fed Funds speculator’s futures position comes in as third most bearish extreme standing of the week. The FedFunds Strength Index Level resides at a 17 percent score of its 3-year range. The net speculator position was -185,934 net contracts this week saw movement by -4,942 contracts from last week. The speculator long position was a total of 49,351 contracts against the total spec short position of 235,285 contracts.


*COT Report: The weekly commitment of traders report summarizes the total trader positions for open contracts in the futures trading markets. The CFTC categorizes trader positions according to commercial hedgers (traders who use futures contracts for hedging as part of the business), non-commercials (speculators & large traders who speculate to realize trading profits) and nonreportable traders (usually small traders/speculators). Find CFTC criteria here: (https://www.cftc.gov/MarketReports/CommitmentsofTraders/ExplanatoryNotes/index.htm).
The Commitment of Traders report is published every Friday by the Commodity Futures Trading Commission (CFTC) and shows futures positions data that was reported as of the previous Tuesday (3 days behind).

Article by CountingPips – Get Our Weekly Newsletter here


COT Currency Futures Charts: US Dollar, Euro, Yen, Pound, Swiss Franc, Peso, Bitcoin

By CountingPips.com COT Home | Data Tables | Data Downloads | Newsletter

Here are the latest charts and statistics for the Commitment of Traders (COT) data published by the Commodities Futures Trading Commission (CFTC).

The latest COT data is updated through Tuesday July 20 2021 and shows a quick view of how large traders (for-profit speculators and commercial entities) were positioned in the futures markets. All currency positions are in direct relation to the US dollar where, for example, a bet for the euro is a bet that the euro will rise versus the dollar while a bet against the euro will be a bet that the euro will decline versus the dollar.


US Dollar Index Futures:

Federal Funds 30-Day Bonds Futures COT Chart
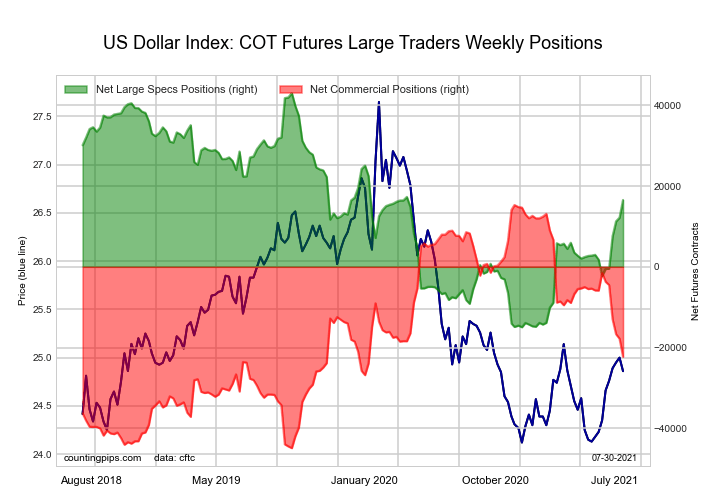
The US Dollar Index large speculator standing this week totaled a net position of 12,188 contracts in the data reported through Tuesday. This was a weekly rise of 931 contracts from the previous week which had a total of 11,257 net contracts.

This week’s current strength score (the trader positioning range over the past three years, measured from 0 to 100) shows the speculators are currently Bearish with a score of 46.8 percent. The commercials are Bearish with a score of 45.0 percent and the small traders (not shown in chart) are Bullish-Extreme with a score of 92.0 percent.

US DOLLAR INDEX StatisticsSPECULATORSCOMMERCIALSSMALL TRADERS
– Percent of Open Interest Longs:74.02.119.4
– Percent of Open Interest Shorts:42.647.95.0
– Net Position:12,188-17,8065,618
– Gross Longs:28,7828257,546
– Gross Shorts:16,59418,6311,928
– Long to Short Ratio:1.7 to 10.0 to 13.9 to 1
NET POSITION TREND:
– COT Index Score (3 Year Range Pct):46.845.092.0
– COT Index Reading (3 Year Range):BearishBearishBullish-Extreme
NET POSITION MOVEMENT INDEX:
– 6-Week Change in Strength Index:18.0-19.819.4


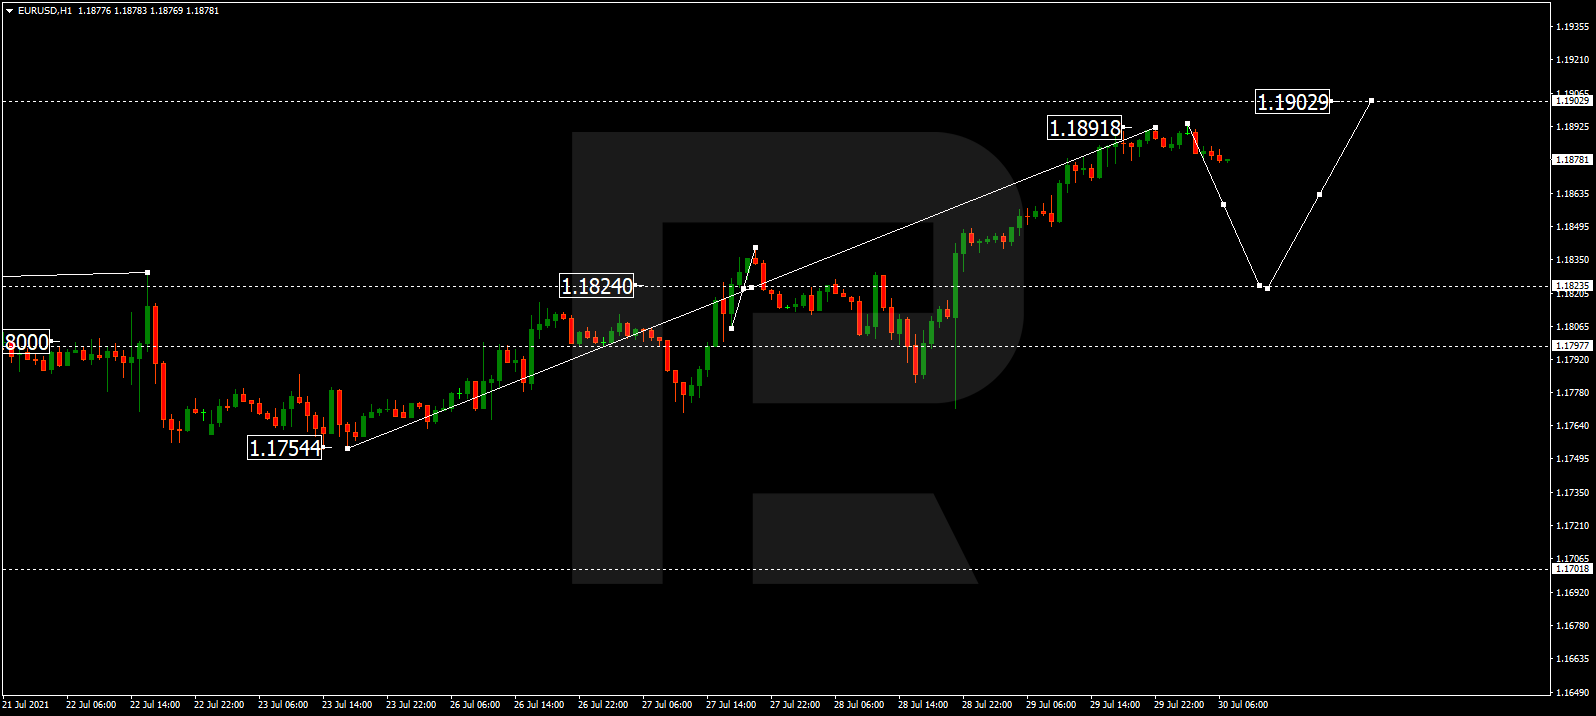
Euro Currency Futures:

2-Year Treasury Bonds Futures COT Chart
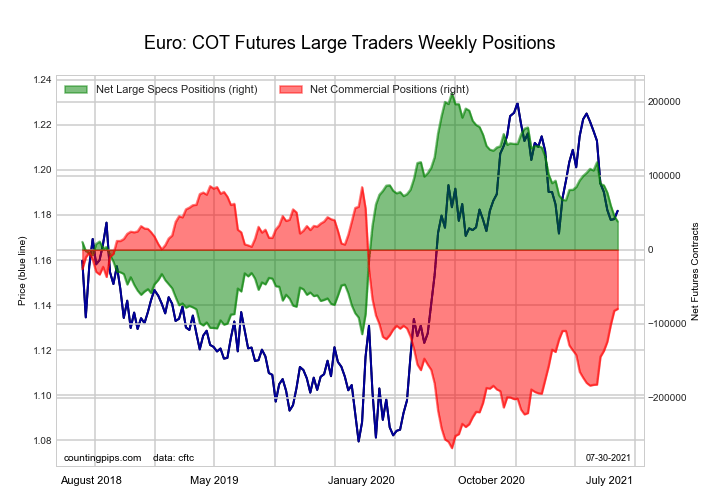
The Euro Currency large speculator standing this week totaled a net position of 45,822 contracts in the data reported through Tuesday. This was a weekly lowering of -13,891 contracts from the previous week which had a total of 59,713 net contracts.

This week’s current strength score (the trader positioning range over the past three years, measured from 0 to 100) shows the speculators are currently Bearish with a score of 49.1 percent. The commercials are Bullish with a score of 52.4 percent and the small traders (not shown in chart) are Bearish with a score of 41.6 percent.

EURO Currency StatisticsSPECULATORSCOMMERCIALSSMALL TRADERS
– Percent of Open Interest Longs:30.555.513.0
– Percent of Open Interest Shorts:23.867.67.7
– Net Position:45,822-82,40136,579
– Gross Longs:208,669379,17689,034
– Gross Shorts:162,847461,57752,455
– Long to Short Ratio:1.3 to 10.8 to 11.7 to 1
NET POSITION TREND:
– COT Index Score (3 Year Range Pct):49.152.441.6
– COT Index Reading (3 Year Range):BearishBullishBearish
NET POSITION MOVEMENT INDEX:
– 6-Week Change in Strength Index:-18.828.3-57.5


British Pound Sterling Futures:

5-Year Treasury Bonds Futures COT Chart
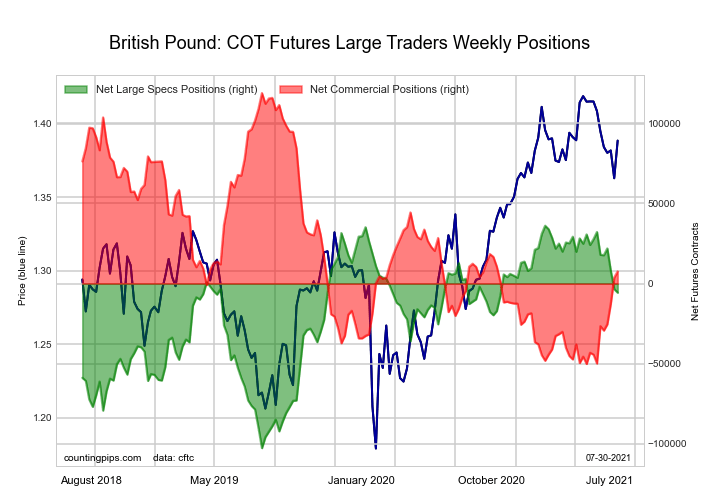
The British Pound Sterling large speculator standing this week totaled a net position of -3,497 contracts in the data reported through Tuesday. This was a weekly decrease of -11,466 contracts from the previous week which had a total of 7,969 net contracts.

This week’s current strength score (the trader positioning range over the past three years, measured from 0 to 100) shows the speculators are currently Bullish with a score of 71.5 percent. The commercials are Bearish with a score of 31.9 percent and the small traders (not shown in chart) are Bullish with a score of 55.2 percent.

BRITISH POUND StatisticsSPECULATORSCOMMERCIALSSMALL TRADERS
– Percent of Open Interest Longs:23.460.415.3
– Percent of Open Interest Shorts:25.358.415.4
– Net Position:-3,4973,732-235
– Gross Longs:44,223114,03128,931
– Gross Shorts:47,720110,29929,166
– Long to Short Ratio:0.9 to 11.0 to 11.0 to 1
NET POSITION TREND:
– COT Index Score (3 Year Range Pct):71.531.955.2
– COT Index Reading (3 Year Range):BullishBearishBullish
NET POSITION MOVEMENT INDEX:
– 6-Week Change in Strength Index:-22.528.4-34.9


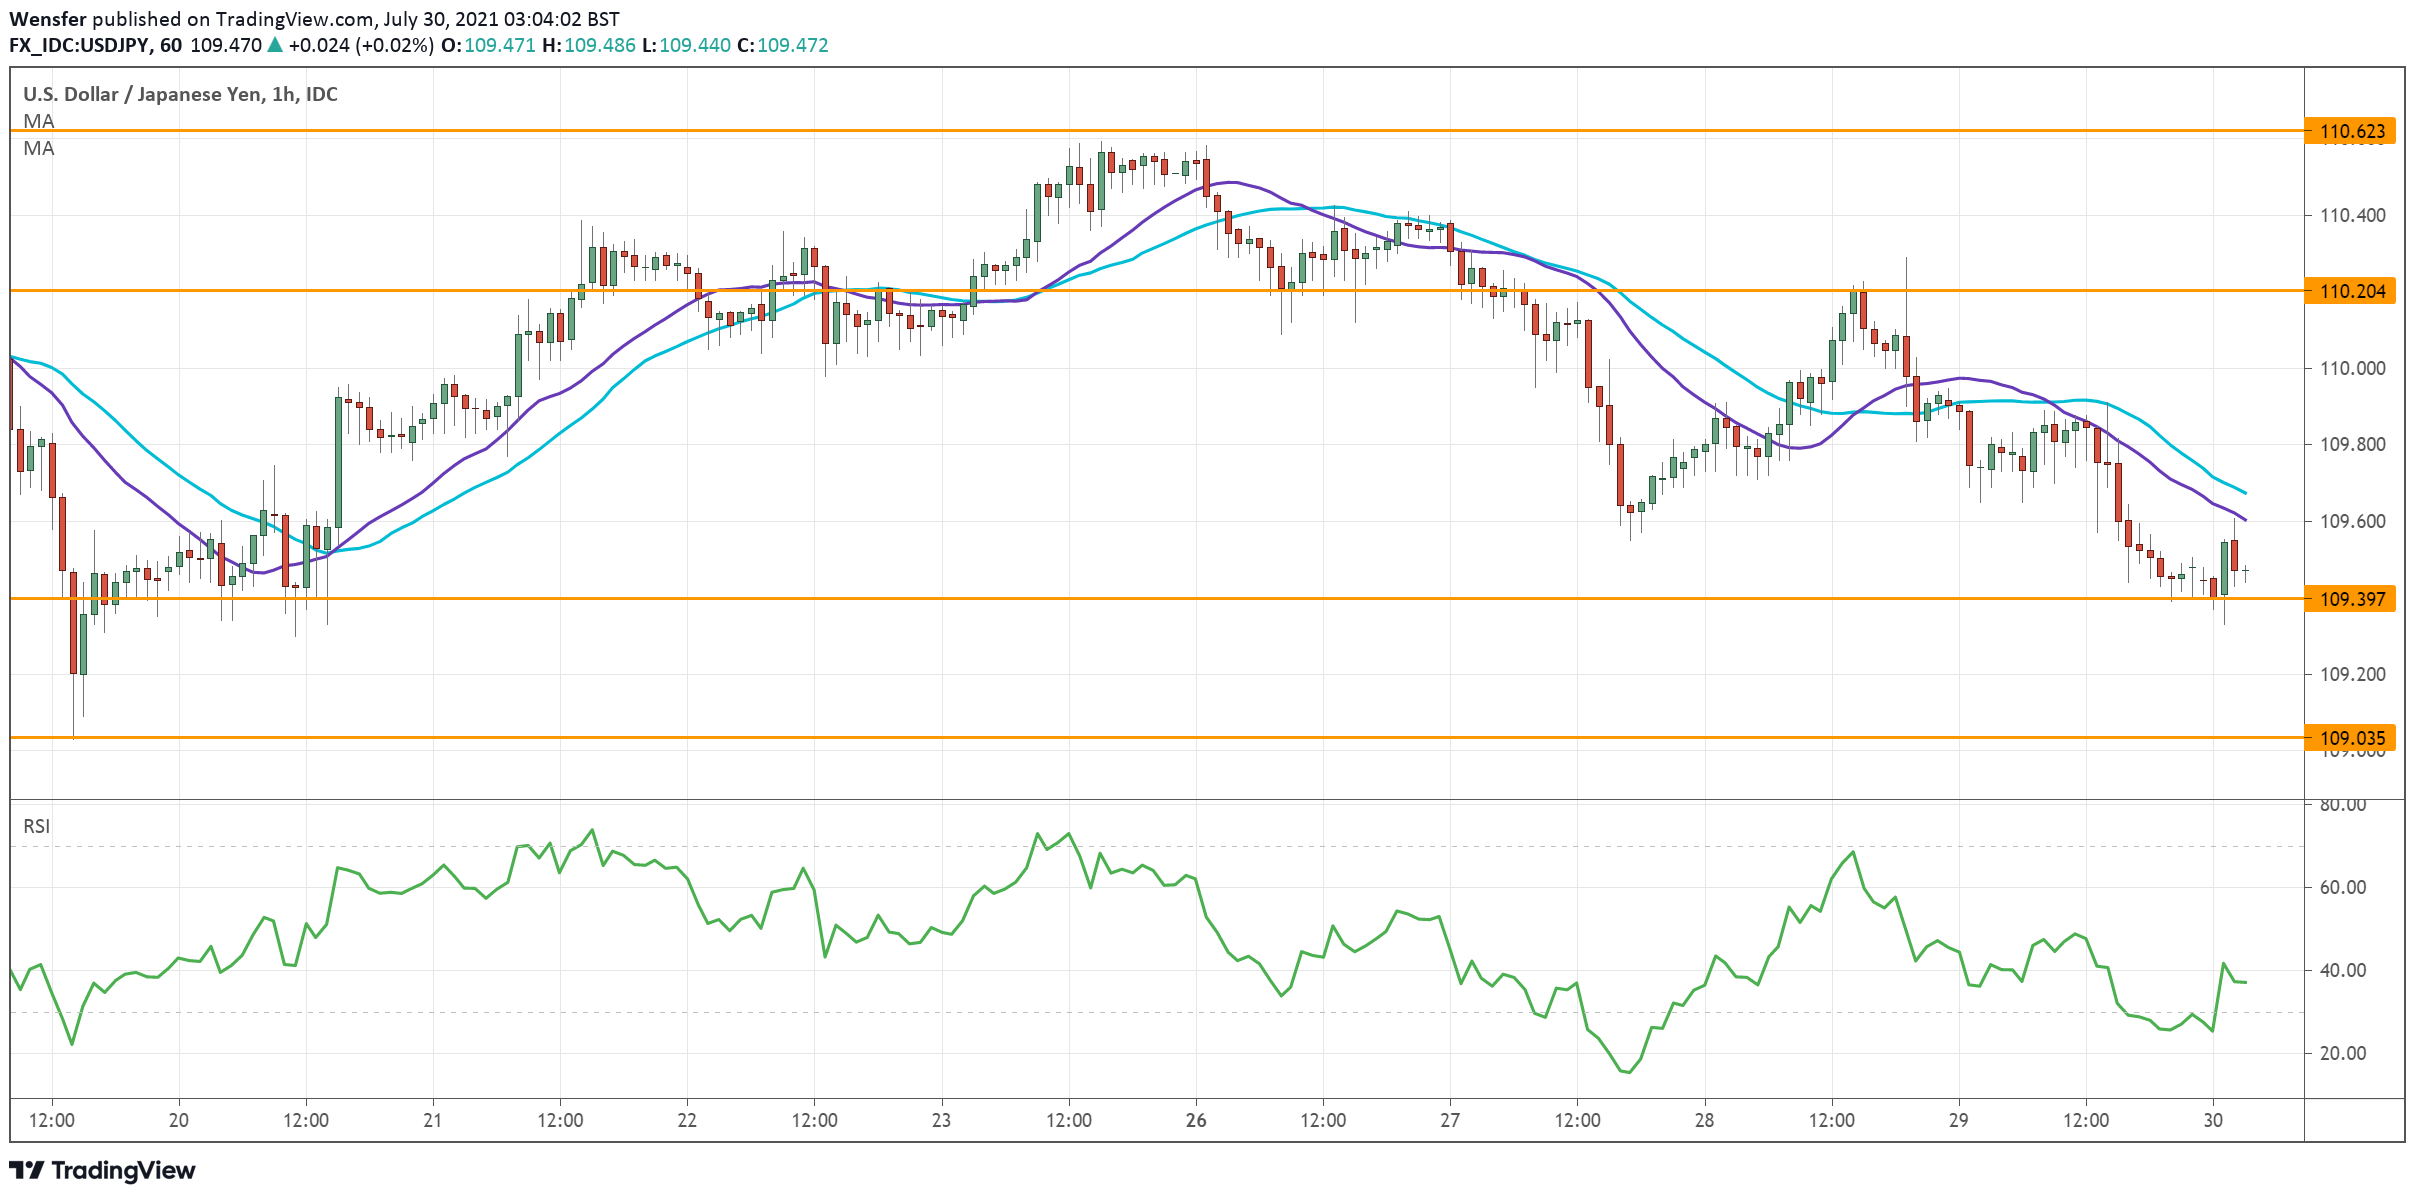
Japanese Yen Futures:

10-Year Treasury Notes Bonds Futures COT Chart
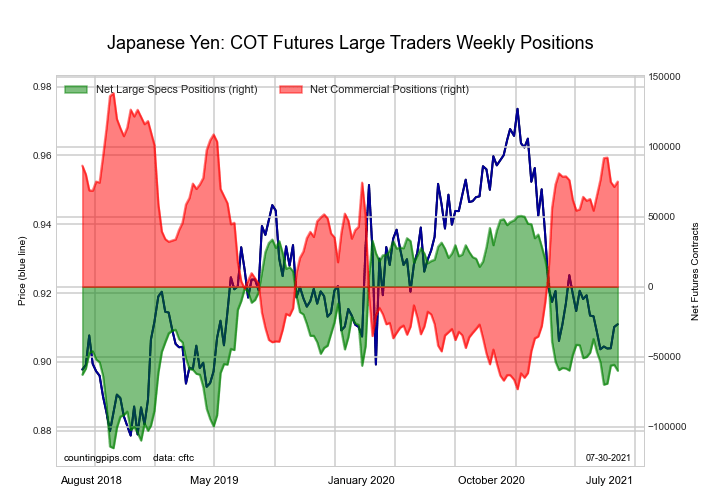
The Japanese Yen large speculator standing this week totaled a net position of -55,731 contracts in the data reported through Tuesday. This was a weekly lift of 519 contracts from the previous week which had a total of -56,250 net contracts.

This week’s current strength score (the trader positioning range over the past three years, measured from 0 to 100) shows the speculators are currently Bearish with a score of 35.9 percent. The commercials are Bullish with a score of 68.3 percent and the small traders (not shown in chart) are Bearish with a score of 26.5 percent.

JAPANESE YEN StatisticsSPECULATORSCOMMERCIALSSMALL TRADERS
– Percent of Open Interest Longs:18.472.19.2
– Percent of Open Interest Shorts:47.435.017.3
– Net Position:-55,73171,266-15,535
– Gross Longs:35,474138,57717,695
– Gross Shorts:91,20567,31133,230
– Long to Short Ratio:0.4 to 12.1 to 10.5 to 1
NET POSITION TREND:
– COT Index Score (3 Year Range Pct):35.968.326.5
– COT Index Reading (3 Year Range):BearishBullishBearish
NET POSITION MOVEMENT INDEX:
– 6-Week Change in Strength Index:-11.18.02.7


Swiss Franc Futures:

Ultra 10-Year Treasury Notes Bonds Futures COT Chart
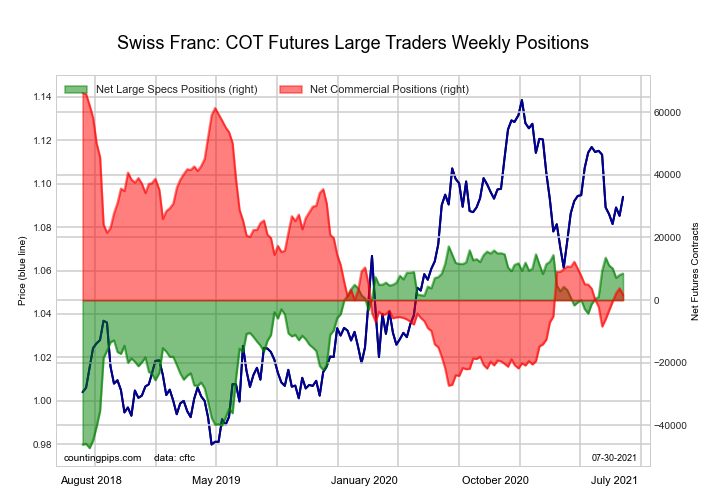
The Swiss Franc large speculator standing this week totaled a net position of 8,042 contracts in the data reported through Tuesday. This was a weekly rise of 905 contracts from the previous week which had a total of 7,137 net contracts.

This week’s current strength score (the trader positioning range over the past three years, measured from 0 to 100) shows the speculators are currently Bullish-Extreme with a score of 85.8 percent. The commercials are Bearish with a score of 33.3 percent and the small traders (not shown in chart) are Bearish with a score of 28.6 percent.

SWISS FRANC StatisticsSPECULATORSCOMMERCIALSSMALL TRADERS
– Percent of Open Interest Longs:40.441.717.9
– Percent of Open Interest Shorts:22.433.244.3
– Net Position:8,0423,796-11,838
– Gross Longs:18,06118,6467,993
– Gross Shorts:10,01914,85019,831
– Long to Short Ratio:1.8 to 11.3 to 10.4 to 1
NET POSITION TREND:
– COT Index Score (3 Year Range Pct):85.833.328.6
– COT Index Reading (3 Year Range):Bullish-ExtremeBearishBearish
NET POSITION MOVEMENT INDEX:
– 6-Week Change in Strength Index:10.86.4-37.9


Canadian Dollar Futures:

US Year Treasury Notes Long Bonds Futures COT Chart
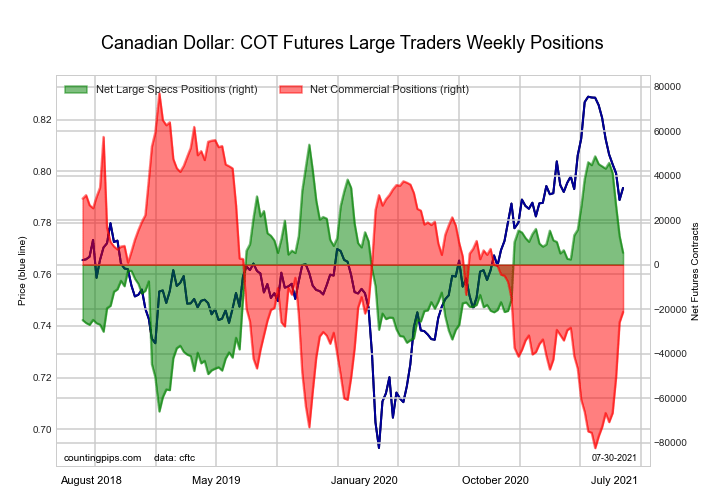
The Canadian Dollar large speculator standing this week totaled a net position of 12,915 contracts in the data reported through Tuesday. This was a weekly reduction of -13,461 contracts from the previous week which had a total of 26,376 net contracts.

This week’s current strength score (the trader positioning range over the past three years, measured from 0 to 100) shows the speculators are currently Bullish with a score of 65.8 percent. The commercials are Bearish with a score of 35.4 percent and the small traders (not shown in chart) are Bullish with a score of 66.3 percent.

CANADIAN DOLLAR StatisticsSPECULATORSCOMMERCIALSSMALL TRADERS
– Percent of Open Interest Longs:31.647.119.5
– Percent of Open Interest Shorts:24.860.712.7
– Net Position:12,915-25,87612,961
– Gross Longs:59,88389,08236,996
– Gross Shorts:46,968114,95824,035
– Long to Short Ratio:1.3 to 10.8 to 11.5 to 1
NET POSITION TREND:
– COT Index Score (3 Year Range Pct):65.835.466.3
– COT Index Reading (3 Year Range):BullishBearishBullish
NET POSITION MOVEMENT INDEX:
– 6-Week Change in Strength Index:-27.032.1-28.6


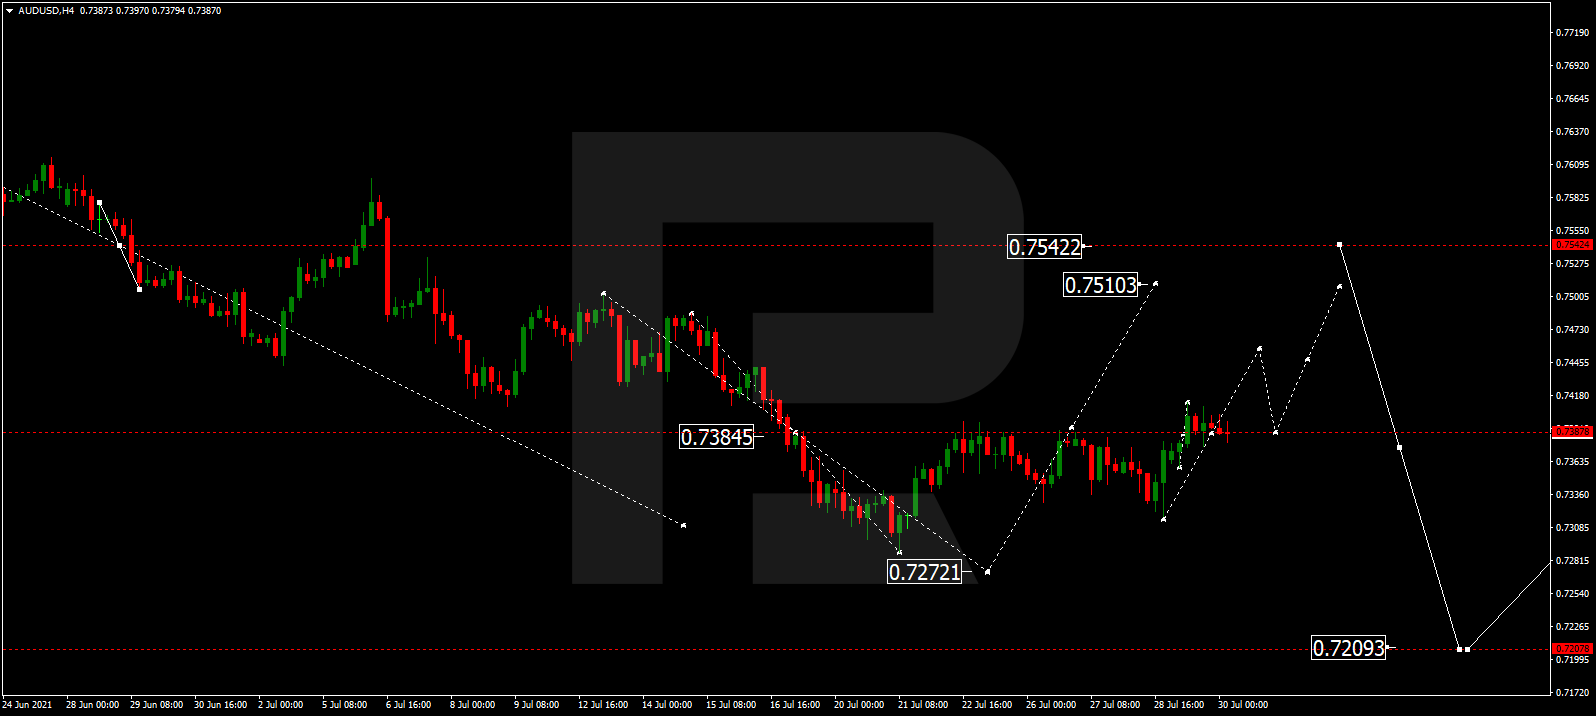
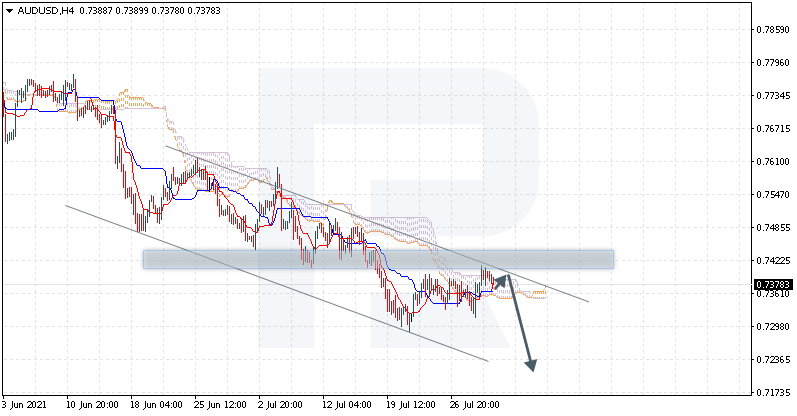
Australian Dollar Futures:

Ultra US Year Treasury Notes Long Bonds Futures COT Chart
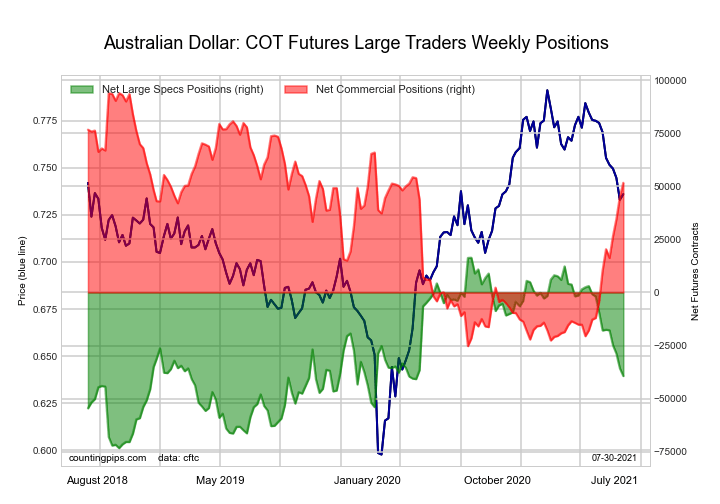
The Australian Dollar large speculator standing this week totaled a net position of -35,690 contracts in the data reported through Tuesday. This was a weekly decrease of -6,902 contracts from the previous week which had a total of -28,788 net contracts.

This week’s current strength score (the trader positioning range over the past three years, measured from 0 to 100) shows the speculators are currently Bearish with a score of 41.9 percent. The commercials are Bullish with a score of 59.0 percent and the small traders (not shown in chart) are Bearish with a score of 36.7 percent.

AUSTRALIAN DOLLAR StatisticsSPECULATORSCOMMERCIALSSMALL TRADERS
– Percent of Open Interest Longs:34.951.711.9
– Percent of Open Interest Shorts:56.724.217.6
– Net Position:-35,69044,984-9,294
– Gross Longs:57,07284,56119,452
– Gross Shorts:92,76239,57728,746
– Long to Short Ratio:0.6 to 12.1 to 10.7 to 1
NET POSITION TREND:
– COT Index Score (3 Year Range Pct):41.959.036.7
– COT Index Reading (3 Year Range):BearishBullishBearish
NET POSITION MOVEMENT INDEX:
– 6-Week Change in Strength Index:-29.341.4-50.6


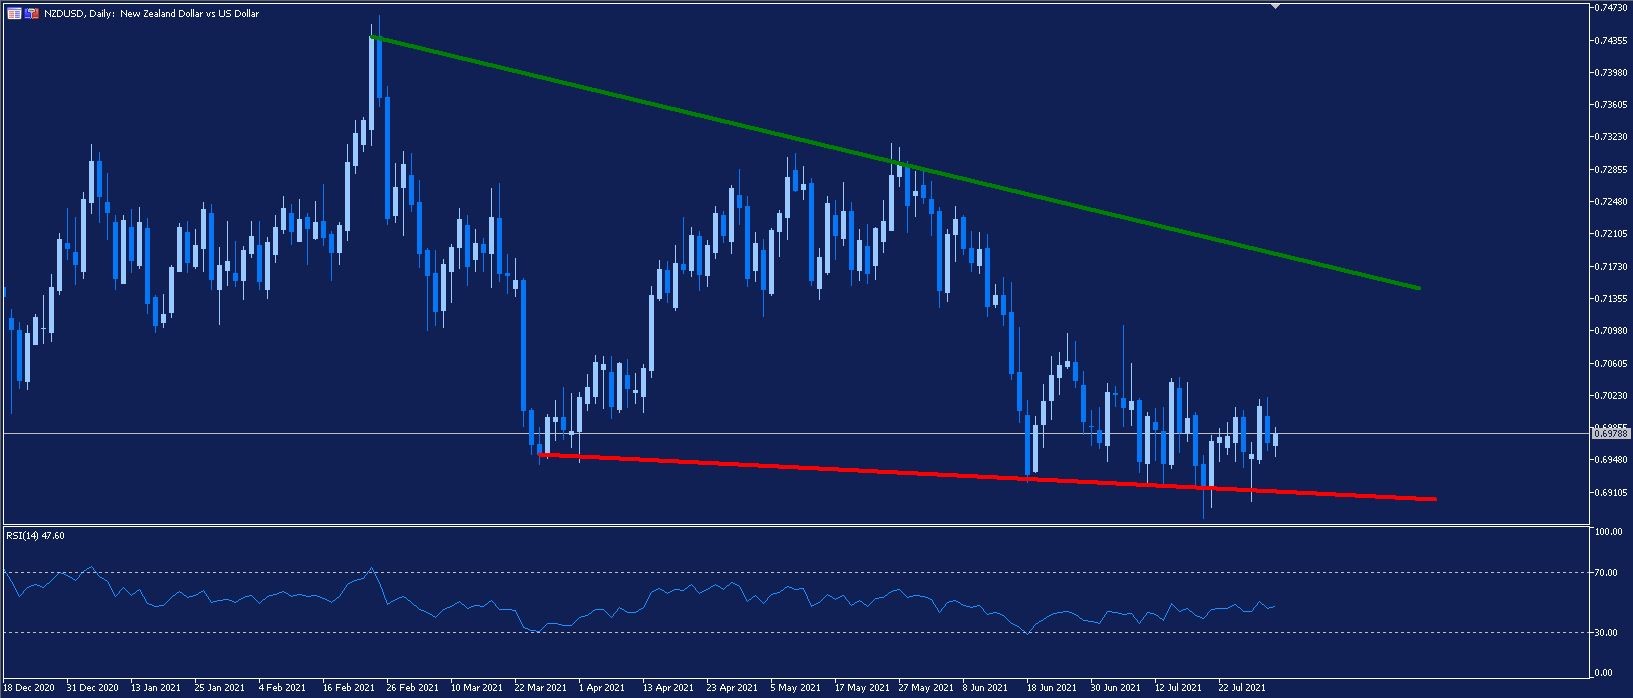
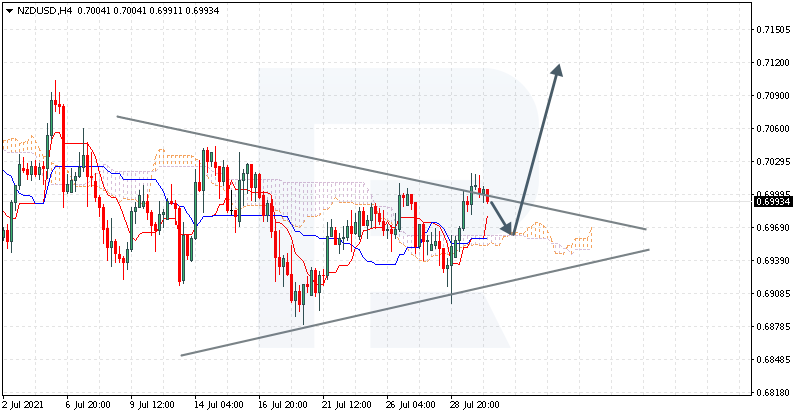
New Zealand Dollar Futures:

Eurodollar Bonds Futures COT Chart
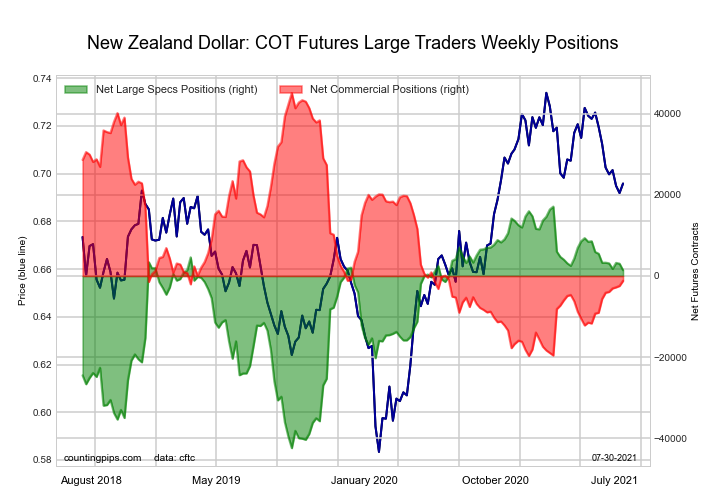
The New Zealand Dollar large speculator standing this week totaled a net position of 3,046 contracts in the data reported through Tuesday. This was a weekly decline of -184 contracts from the previous week which had a total of 3,230 net contracts.

This week’s current strength score (the trader positioning range over the past three years, measured from 0 to 100) shows the speculators are currently Bullish with a score of 76.4 percent. The commercials are Bearish with a score of 26.6 percent and the small traders (not shown in chart) are Bearish with a score of 46.9 percent.

NEW ZEALAND DOLLAR StatisticsSPECULATORSCOMMERCIALSSMALL TRADERS
– Percent of Open Interest Longs:47.441.79.5
– Percent of Open Interest Shorts:40.447.310.9
– Net Position:3,046-2,448-598
– Gross Longs:20,67118,1664,144
– Gross Shorts:17,62520,6144,742
– Long to Short Ratio:1.2 to 10.9 to 10.9 to 1
NET POSITION TREND:
– COT Index Score (3 Year Range Pct):76.426.646.9
– COT Index Reading (3 Year Range):BullishBearishBearish
NET POSITION MOVEMENT INDEX:
– 6-Week Change in Strength Index:-4.110.2-45.9


Mexican Peso Futures:

Ultra 10-Year Treasury Notes Bonds Futures COT Chart
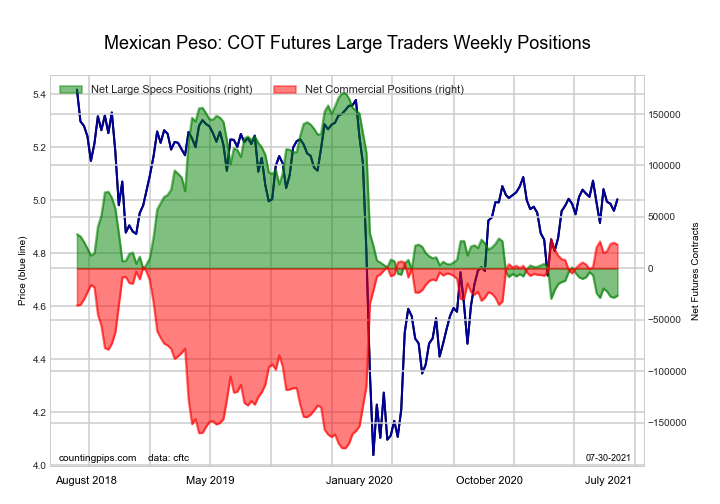
The Mexican Peso large speculator standing this week totaled a net position of -28,421 contracts in the data reported through Tuesday. This was a weekly decrease of -989 contracts from the previous week which had a total of -27,432 net contracts.

This week’s current strength score (the trader positioning range over the past three years, measured from 0 to 100) shows the speculators are currently Bearish-Extreme with a score of 0.5 percent. The commercials are Bullish-Extreme with a score of 98.5 percent and the small traders (not shown in chart) are Bullish with a score of 57.6 percent.

MEXICAN PESO StatisticsSPECULATORSCOMMERCIALSSMALL TRADERS
– Percent of Open Interest Longs:45.249.24.7
– Percent of Open Interest Shorts:64.632.12.3
– Net Position:-28,42124,9913,430
– Gross Longs:66,14172,0566,864
– Gross Shorts:94,56247,0653,434
– Long to Short Ratio:0.7 to 11.5 to 12.0 to 1
NET POSITION TREND:
– COT Index Score (3 Year Range Pct):0.598.557.6
– COT Index Reading (3 Year Range):Bearish-ExtremeBullish-ExtremeBullish
NET POSITION MOVEMENT INDEX:
– 6-Week Change in Strength Index:-10.911.6-7.0


Brazilian Real Futures:

US Year Treasury Notes Long Bonds Futures COT Chart
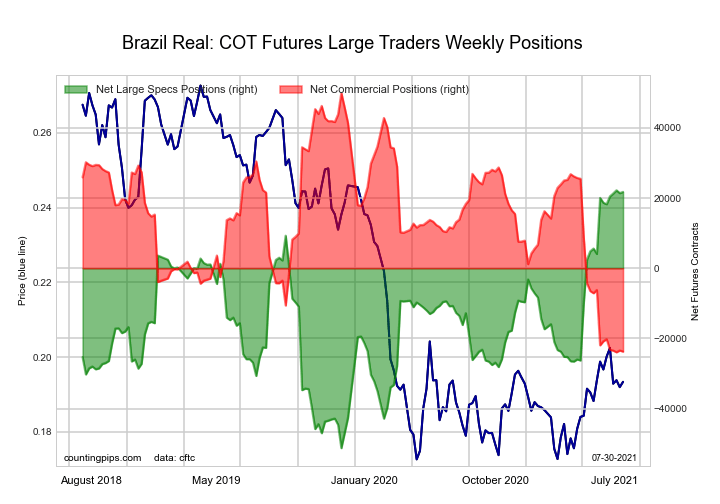
The Brazilian Real large speculator standing this week totaled a net position of 21,413 contracts in the data reported through Tuesday. This was a weekly lowering of -807 contracts from the previous week which had a total of 22,220 net contracts.

This week’s current strength score (the trader positioning range over the past three years, measured from 0 to 100) shows the speculators are currently Bullish-Extreme with a score of 98.9 percent. The commercials are Bearish-Extreme with a score of 0.7 percent and the small traders (not shown in chart) are Bullish-Extreme with a score of 91.3 percent.

BRAZIL REAL StatisticsSPECULATORSCOMMERCIALSSMALL TRADERS
– Percent of Open Interest Longs:70.818.18.8
– Percent of Open Interest Shorts:16.977.13.7
– Net Position:21,413-23,4402,027
– Gross Longs:28,1367,2023,515
– Gross Shorts:6,72330,6421,488
– Long to Short Ratio:4.2 to 10.2 to 12.4 to 1
NET POSITION TREND:
– COT Index Score (3 Year Range Pct):98.90.791.3
– COT Index Reading (3 Year Range):Bullish-ExtremeBearish-ExtremeBullish-Extreme
NET POSITION MOVEMENT INDEX:
– 6-Week Change in Strength Index:1.9-2.01.3


Russian Ruble Futures:

Ultra US Year Treasury Notes Long Bonds Futures COT Chart
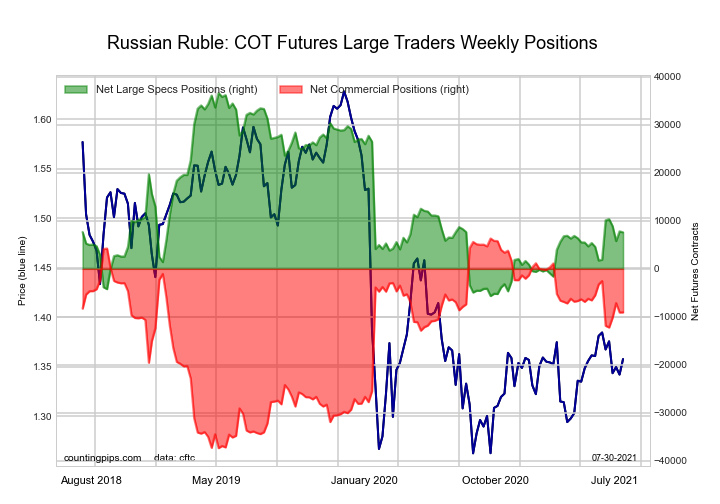
The Russian Ruble large speculator standing this week totaled a net position of 7,801 contracts in the data reported through Tuesday. This was a weekly lift of 2,010 contracts from the previous week which had a total of 5,791 net contracts.

This week’s current strength score (the trader positioning range over the past three years, measured from 0 to 100) shows the speculators are currently Bearish with a score of 31.9 percent. The commercials are Bullish with a score of 64.7 percent and the small traders (not shown in chart) are Bullish-Extreme with a score of 81.4 percent.

RUSSIAN RUBLE StatisticsSPECULATORSCOMMERCIALSSMALL TRADERS
– Percent of Open Interest Longs:35.458.65.9
– Percent of Open Interest Shorts:19.177.73.2
– Net Position:7,801-9,0841,283
– Gross Longs:16,89127,9442,811
– Gross Shorts:9,09037,0281,528
– Long to Short Ratio:1.9 to 10.8 to 11.8 to 1
NET POSITION TREND:
– COT Index Score (3 Year Range Pct):31.964.781.4
– COT Index Reading (3 Year Range):BearishBullishBullish-Extreme
NET POSITION MOVEMENT INDEX:
– 6-Week Change in Strength Index:14.3-13.4-7.1


Bitcoin Futures:

Eurodollar Bonds Futures COT Chart
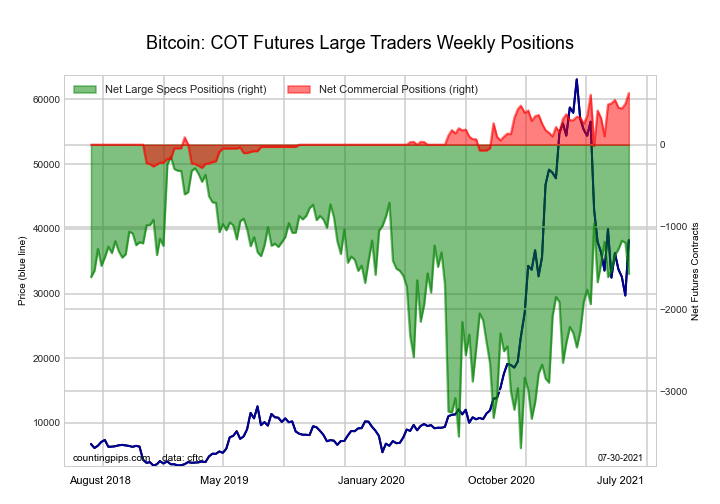
The Bitcoin large speculator standing this week totaled a net position of -1,192 contracts in the data reported through Tuesday. This was a weekly lowering of -25 contracts from the previous week which had a total of -1,167 net contracts.

This week’s current strength score (the trader positioning range over the past three years, measured from 0 to 100) shows the speculators are currently Bullish with a score of 70.4 percent. The commercials are Bullish-Extreme with a score of 87.5 percent and the small traders (not shown in chart) are Bearish-Extreme with a score of 12.6 percent.

BITCOIN StatisticsSPECULATORSCOMMERCIALSSMALL TRADERS
– Percent of Open Interest Longs:65.27.318.9
– Percent of Open Interest Shorts:79.61.410.5
– Net Position:-1,192496696
– Gross Longs:5,4046081,564
– Gross Shorts:6,596112868
– Long to Short Ratio:0.8 to 15.4 to 11.8 to 1
NET POSITION TREND:
– COT Index Score (3 Year Range Pct):70.487.512.6
– COT Index Reading (3 Year Range):BullishBullish-ExtremeBearish-Extreme
NET POSITION MOVEMENT INDEX:
– 6-Week Change in Strength Index:-0.344.3-12.6


Article By CountingPips.comReceive our weekly COT Reports by Email

*COT Report: The COT data, released weekly to the public each Friday, is updated through the most recent Tuesday (data is 3 days old) and shows a quick view of how large speculators or non-commercials (for-profit traders) were positioned in the futures markets.

The CFTC categorizes trader positions according to commercial hedgers (traders who use futures contracts for hedging as part of the business), non-commercials (large traders who speculate to realize trading profits) and nonreportable traders (usually small traders/speculators).

Find CFTC criteria here: (http://www.cftc.gov/MarketReports/CommitmentsofTraders/ExplanatoryNotes/index.htm).

The Week Ahead – UK Celebrates End Of Lockdown Amid Rising Cases

By Orbex

GBPUSD slides on cautious sentiment

GBPUSD

The pound slowly recovers while traders remain wary of the UK’s end of Covid-related restrictions.

The sterling has weakened across the board as Delta cases surged in recent days. The combination of ‘Freedom day’ and summer holidays may be a hotbed for infection.

A slowdown in economic activity and consumer spending would be detrimental to the pound. However, lower rates of death and hospitalization may limit the impact on the economy.

As a result, caution prevails as the pair climbs back to 1.3900. A bullish breakout may send the pound back to 1.4200. A drop below 1.3600 may trigger another round of sell-off.

EURUSD falls as ECB stays dovish

EURUSD

The euro retreats as the ECB keeps its policy loose. This week’s Fed meeting is likely to be uneventful as well.

Markets would expect the central bank to mirror Chairman Powell’s pledge to stay patient during his Senate hearing. With the highly contagious Delta variant now spreading across the US, the Fed will need to ride the wave before it could change its course anyway.

In the meantime, the greenback still benefits from the safe haven attribute, as investors load up dollar-denominated assets.

The pair is testing the key support at 1.1700. A rebound will need to clear 1.1970 to convince more buyers to join in.

US 30 rallies on strong corporate earnings

US30

Major US indices recouped last week’s losses on strong earnings reports.

Investors seem to be unfazed by the noise around the new Covid strain and instead pay more attention to companies’ bottom lines, which after all, are more tangible.

Economically sensitive industries like energy, banking, materials, and industrials are beating consensus left and right. This is a strong sign that the economic backbone is healing.

However, it would take harsher restrictions to derail the recovery, and that is unthinkable for now.

The Dow Jones has found buying interest at 33700. A close above 35100 would send the index to new record highs.

USOIL rises back as supply is under control

US oil

Oil prices recovered after OPEC+ reached an agreement to boost output.

The standoff between Saudi Arabia and the United Arab Emirates has come to an end after the latter was granted a higher quota.

Markets cheered as this suggests that the cartel retains its ability to control supply and that the cloud of a price war has dissipated. In fact, producers will pump out extra 400,000 barrels a day each month from August to meet demand.

Unless demand collapses with a new series of stringent restrictions, the price may have found a floor near 66, the top of a previous consolidation range. A break above 77 would further extend the rally.

By Orbex

USDCAD Has Cycle Wave W Completed?

By Orbex

The USDCAD pair is forming a double zigzag of a cycle degree.

On the chart, we see the final part of the first actionary wave w. Most likely, it is a triple zigzag consisting of primary sub-waves Ⓦ-Ⓧ-Ⓨ-Ⓧ-Ⓩ. The final actionary sub-wave Ⓩ of this pattern is currently under development.

The last intermediate wave (C) in the form of a simple impulse is currently being formed as part of the sub-wave Ⓩ. Perhaps the minute fourth correction in the form of a minute double zigzag has come to an end. This is a signal for a decline in the minute fifth wave.

Most likely, the market will update the previous low and will complete the cycle wave w significantly below the level of 1.2012.

An alternative scenario shows the formation of a cycle wave w was completed in June. Since then the market has risen, building a cycle intervening wave x.

It is quite likely that the intervening wave x takes the form of a primary simple Ⓐ-Ⓑ-Ⓒ zigzag.

It is possible that in the very near future the market will complete a bearish correction Ⓑ near 1.2416, where it will be at ½ of bullish impulse Ⓐ.

Then the market increase can continue in the primary impulse Ⓒ towards the level of 1.3208. This is where the primary waves Ⓐ and Ⓒ will be equal.

By Orbex

Fibonacci Retracements Analysis 23.07.2021 (AUDUSD, USDCAD)

Article By RoboForex.com

AUDUSD, “Australian Dollar vs US Dollar”

In the H4 chart, after breaking 61.8% fibo at 0.7379, the downtrend has failed to reach 76.0% fibo at 0.7236. At the same time, we can see divergence on MACD, which may force the asset to start a pullback to the upside. However, this ascending movement is not expected to reach the high at 0.8007. In the future, this pullback may be followed by another descending wave to reach the fractal support at 0.6991.

AUDUSD_H4
Risk Warning: the result of previous trading operations do not guarantee the same results in the future

The H1 chart of AUDUSD shows potential correctional targets after convergence on MACD, which are 23.6%, 38.2%, and 50.0% fibo at 0.7431, 0.7519, and 0.7590 respectively. A breakout of the low at 0.7289 will result in a further downtrend.

AUDUSD_H1
Risk Warning: the result of previous trading operations do not guarantee the same results in the future

USDCAD, “US Dollar vs Canadian Dollar”

As we can see in the daily chart, after finishing the first ascending wave at 23.6% fibo, USDCAD is correcting and may later resume its mid-term uptrend towards 38.2%, 50.0%, 61.8%, and 76.0% fibo at 1.3024, 1.3338, 1.3648, and 1.4028 respectively. The key support remains at the low at 1.2007.

USDCAD_D1
Risk Warning: the result of previous trading operations do not guarantee the same results in the future

The H4 chart shows a descending correction after divergence on MACD, which has already broken 23.6% fibo and may later continue towards 38.2%, 50.0%, 61.8%, and 76.0% fibo at 1.2501, 1.2406, 1.3212, and 1.21999 respectively. The local resistance is at 1.2807.

USDCAD_H4
Risk Warning: the result of previous trading operations do not guarantee the same results in the future

Article By RoboForex.com

Attention!
Forecasts presented in this section only reflect the author’s private opinion and should not be considered as guidance for trading. RoboForex LP bears no responsibility for trading results based on trading recommendations described in these analytical reviews.

Intraday Market Analysis – Euro Under Pressure

By Orbex

EURUSD hits resistance

EURUSD

The euro weakened after the ECB kept its accommodative stance unchanged. The single currency is hovering above the demand zone around 1.1710 on the daily chart.

While an RSI divergence has shown a loss in the bearish momentum, yesterday’s whipsaws so far failed to confirm a turnaround.

The break above 1.1800 has prompted sellers to cover some bets. But buyers will need to lift 1.1850 before a solid rebound could materialize.

On the flip-side, a drop below 1.1750 would lead to 1.1710.

US 30 seeks support after V recovery

US30

The Dow Jones 30 recouped previous losses, as weak jobs figures favor the prolonged loose monetary policy.

The V-shaped recovery has rekindled hopes of a new round of rally, not before the price clears the major hurdle ahead though.

Buyers are likely to run into strong selling interest around the peak at 35100. A clear cut could pave the way for a new record high.

In the meantime, a near overbought RSI may temper the enthusiasm. A pullback to the fresh support at 34480 could be a buying opportunity.

XAGUSD attempts rebound

XAGUSD

Bullions recover as the US dollar retreats across the board. Silver has so far found buying interest on the daily support level at 24.70.

Once again, a divergent RSI in the demand zone foreshadowed the rebound. The break above 25.25 is an encouraging sign as the price achieves a swing high for the first time in a week. 25.70 would be the next stop if buyers can gather enough support.

Then a bullish breakout may extend the recovery to 26.40. Below the mentioned support, silver could fall towards 24.30.

By Orbex