By Han Tan Chief Market Analyst at Exinity Group, ForexTime
With uncertainty on the China regulatory overhaul still not shifting to the background, markets are struggling this morning, even though they were more constructive overnight.
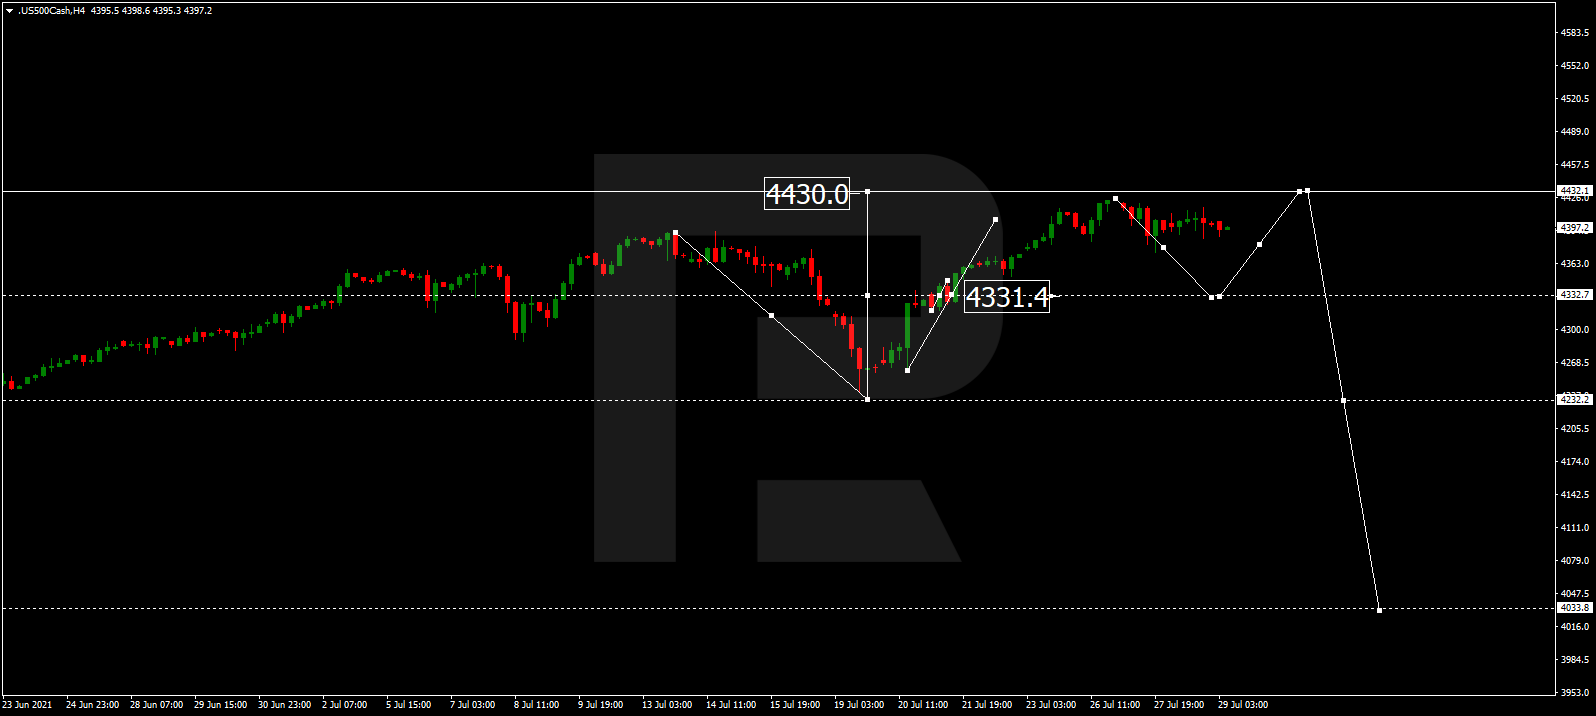
US indices had all finished in the green as expectations for continued Fed stimulus helped boost risk sentiment.
Disappointing Amazon
Amazon posted its third $100 billion quarter in a row, but the giant still came in below analyst estimates for revenue in its second quarter results, which was its first revenue miss in three years. The tech titan also gave a weaker-than-expected outlook for the third quarter, although CFO Olsavsky blamed this on tough year-over-year comparisons to its business during Covid-19 lockdowns.
Amazon’s guidance echoes similar warnings by Facebook and Apple who said in quarterly earnings earlier this week that revenue growth rates would slow down from pandemic highs.
The stock fell more than 7% in extended trading on Thursday and the broader market Nasdaq futures are firmly in the red.
On a technical basis, Amazon could be forming a classic double top reversal pattern with initial support just above $3500. If this plays out, then $3400 and below would be the target for the sellers.

Top tier Eurozone data out today
European stock markets have all opened firmly in the red following on from Asia’s weak showing. European bourses had been helped by upbeat earnings on Thursday with results from Swiss chipmaker STMicroelectronics and French Societe Bic propelling the region-wide Stoxx 600 benchmark to another new record high.
We get Q2 GDP data for eurozone countries this morning. France’s numbers have already been released and were modestly better than expected, while Spain’s handsomely beat estimates. The region is expected to grow by 1.5% q/q but the rebound from a technical recession should not shift the ECB’s current dovish stance.
The flash estimate of the bloc’s CPI data is also released with the important core reading still forecast to remain subdued at 0.7%. The headline print is expected to rise a tenth to 2% year-on-year from 1.9% in June.
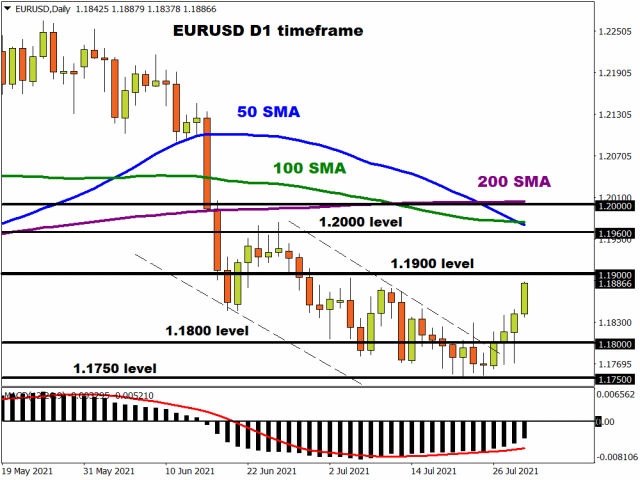
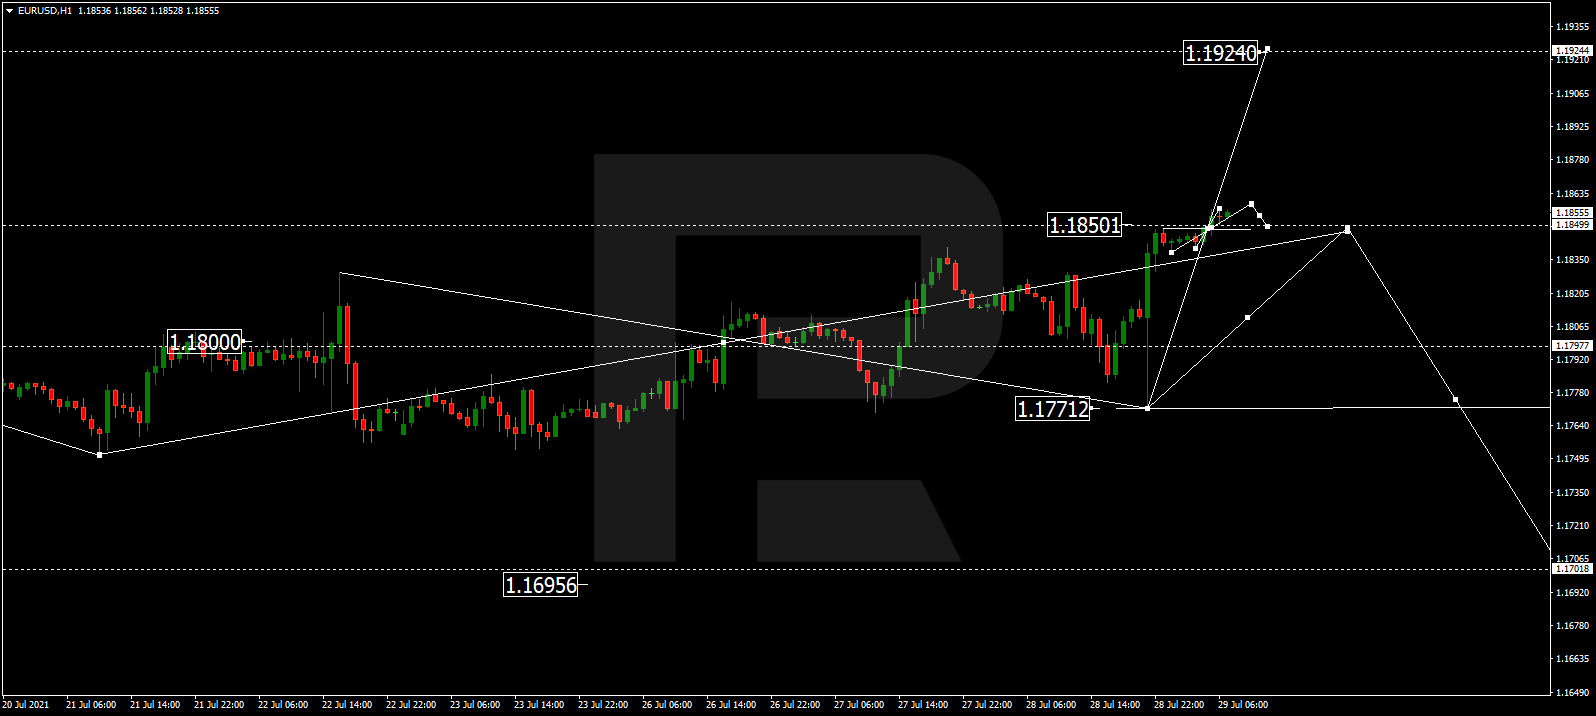
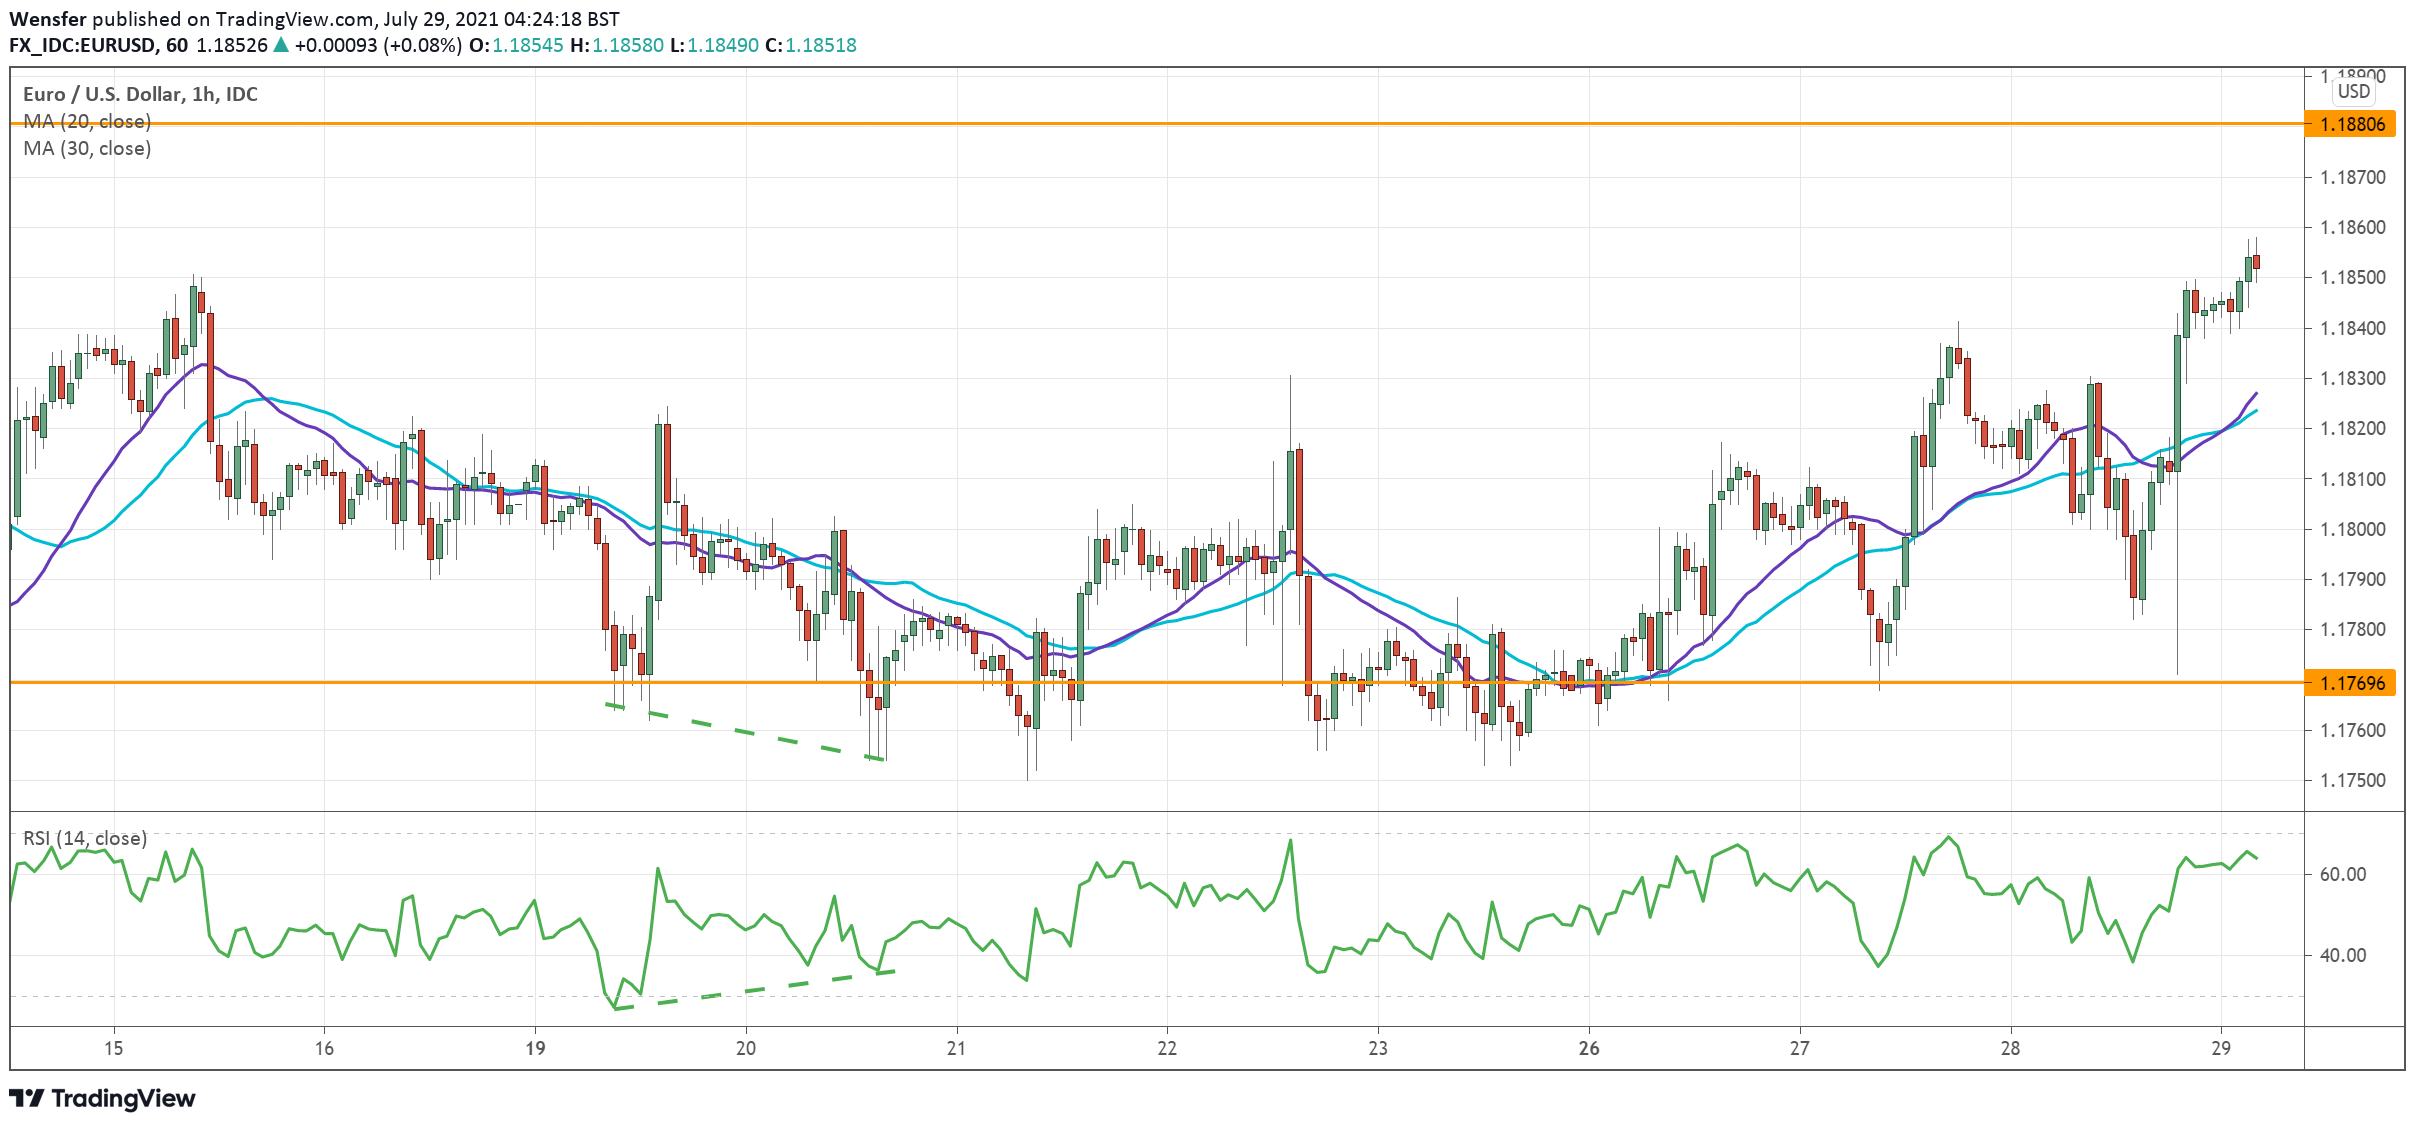
Fresh signs of turbulence in Asia suggest EUR/USD may struggle to get above 1.19 today if the dollar catches a bid.
Sour risk sentiment favours the greenback and the short term fate of the pair still remains tied to global dynamics.

Disclaimer: The content in this article comprises personal opinions and should not be construed as containing personal and/or other investment advice and/or an offer of and/or solicitation for any transactions in financial instruments and/or a guarantee and/or prediction of future performance. ForexTime (FXTM), its affiliates, agents, directors, officers or employees do not guarantee the accuracy, validity, timeliness or completeness, of any information or data made available and assume no liability as to any loss arising from any investment based on the same.
![]() Article by ForexTime
Article by ForexTime
ForexTime Ltd (FXTM) is an award winning international online forex broker regulated by CySEC 185/12 www.forextime.com