by JustForex
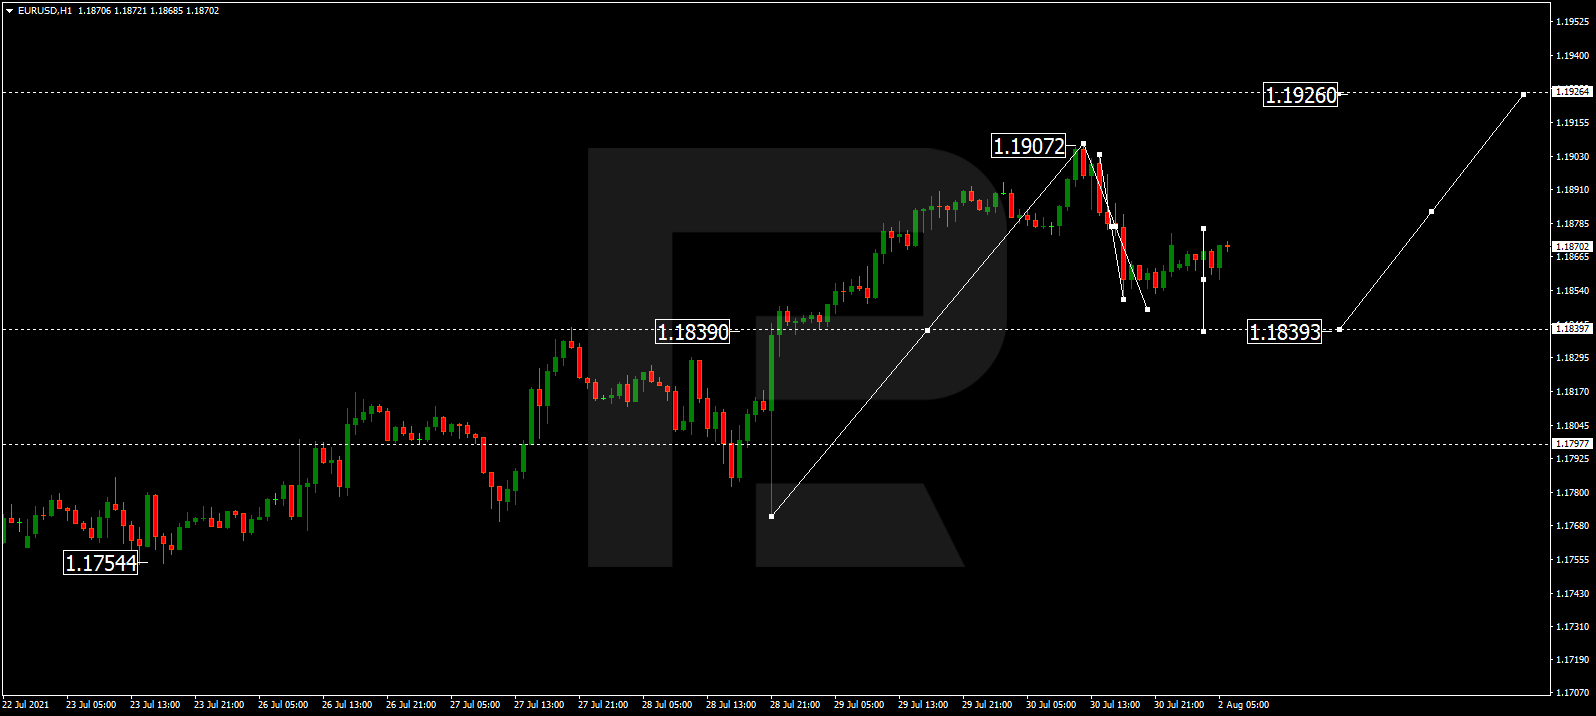
The EUR/USD currency pair
- Prev Open: 1.1862
- Prev Close: 1.1868
- % chg. over the last day: +0.05%
The business activity index in the manufacturing sector in Germany and the Eurozone slightly increased in June. Manufacturers remain optimistic about the next 12 months as the global economic recovery demonstrates positive dynamics amid growing vaccination while businesses adjust to restrictions.
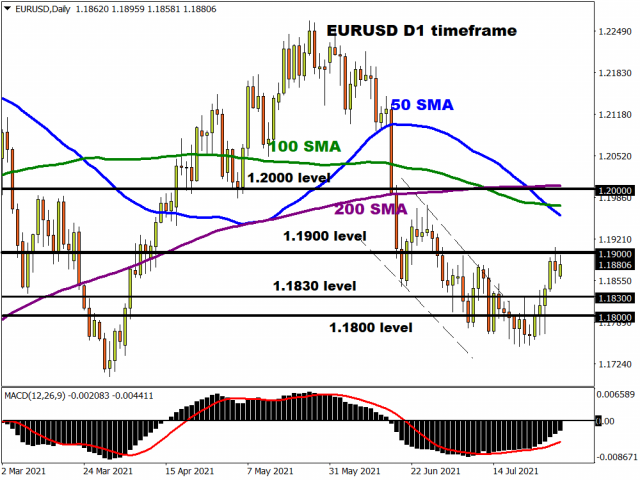
- Support levels: 1.1833, 1.1817, 1.1784, 1.1754, 1.1609
- Resistance levels: 1.1876, 1.1894, 1.1934, 1.1969
From the technical point of view, the general trend of the EUR/USD currency pair is bullish. The price is trading above the moving average now; the MACD indicator has become inactive. Under such market conditions, it’s better to consider intraday trading. Buy positions should be considered only after a pullback to the support level. Sell deals should be considered from the resistance levels, but only with short targets.
Alternative scenario: if the price breaks through the 1.1784 support level and fixes below, the mid-term uptrend is likely to be broken.

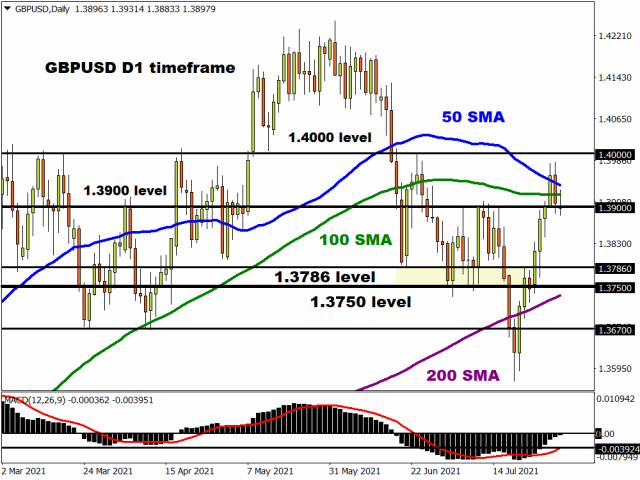
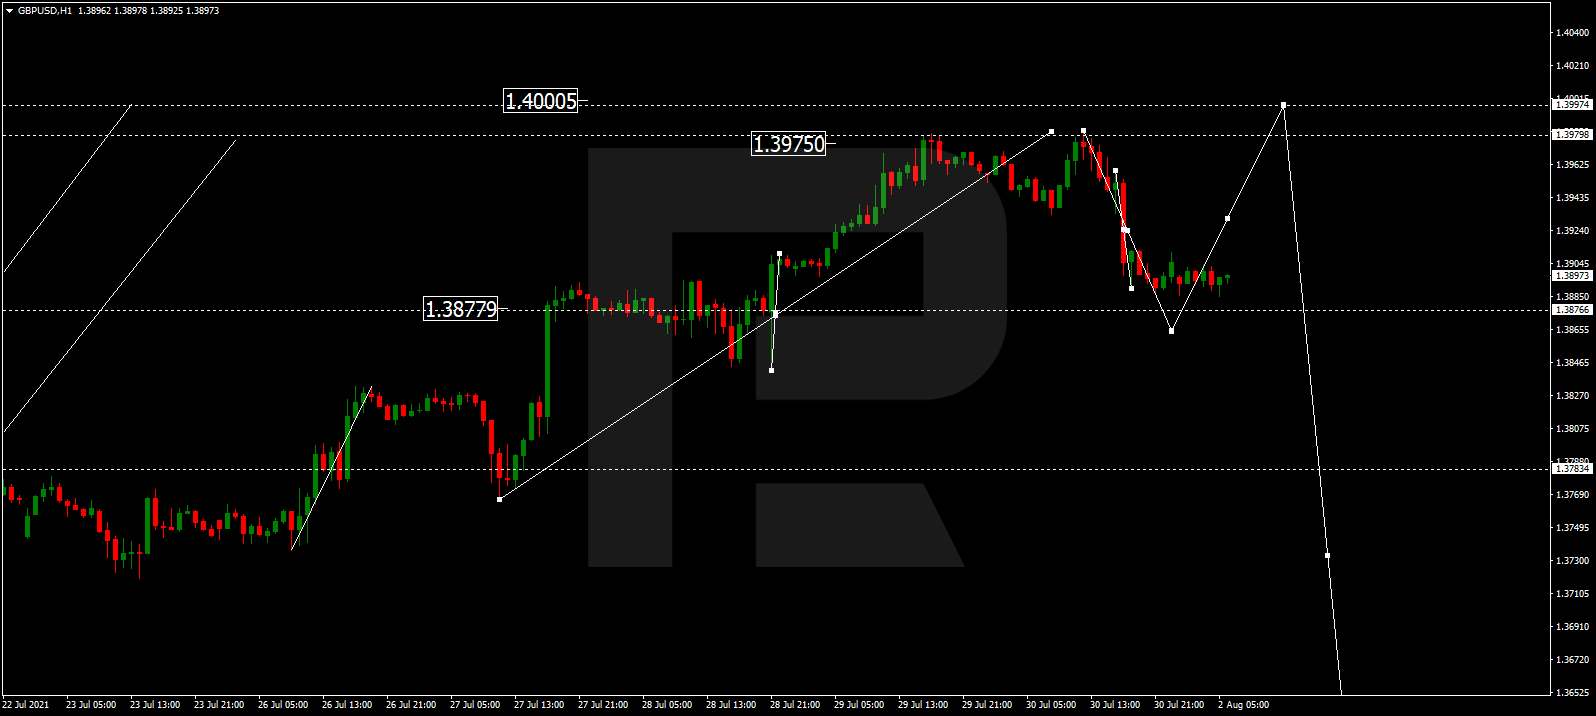
The GBP/USD currency pair
- Prev Open: 1.3888
- Prev Close: 1.3886
- % chg. over the last day: -0.01%
According to government statistics, more than 90% of British adults have been vaccinated with the first dose. The number of COVID-19 cases is decreasing in the United Kingdom. Last week, the British pound was one of the best-performing currencies, which strengthened steadily and was dependent on the dynamic of the dollar index a bit. The level of business activity in the manufacturing sector remained unchanged.
- Support levels: 1.3825, 1.3772, 1.3714, 1.3676 ,1.3641, 1.3614, 1.3525
- Resistance levels: 1.3900, 1.3947, 1.4002, 1.4075, 1.4101
The GBP/USD currency pair trend is bullish on the H1 timeframe. The MACD indicator went into the negative zone, but there are already first signs of a reversal. Under such market conditions, traders can look for buy positions after the buyers show initiative. There are no optimal points for sell positions right now. Traders can search for intraday sell entries from the resistance level with short targets, but they should understand that it will be trading against the main trend.
Alternative scenario: if the price breaks through the 1.3714 support level and consolidates below, the bearish scenario is likely to resume.

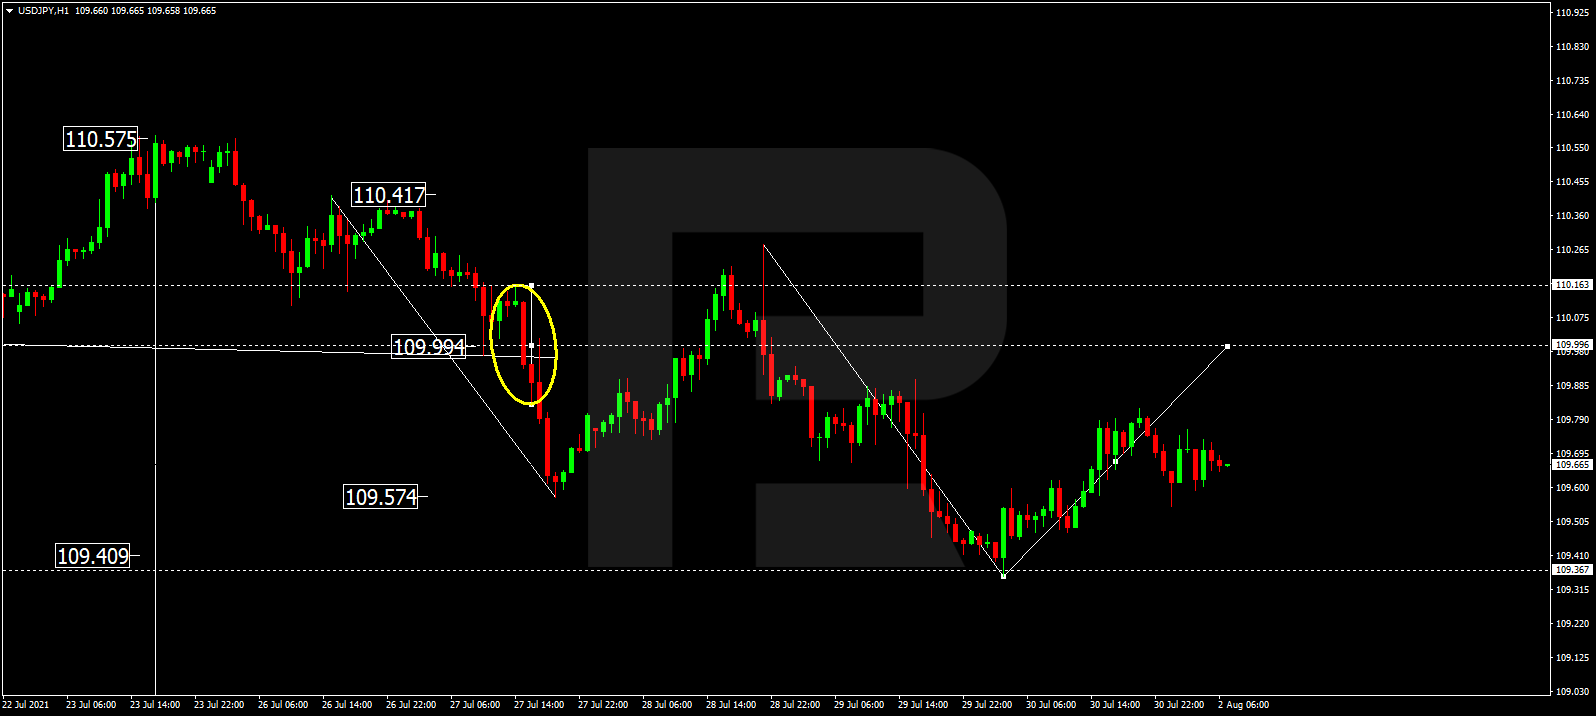
The USD/JPY currency pair
- Prev Open: 109.67
- Prev Close: 109.31
- % chg. over the last day: -0.33%
The USD/JPY currency pair decreased by 0.33% on Monday. The strengthening of the Japanese yen was primarily due to the rise in the 6J futures yesterday (inverse correlation). But now, the futures reached the resistance level, while the USD/JPY went to the support level. Considering the divergence on the MACD indicator, a corrective bounce is highly probable. The Japanese Ministry of Finance raised its economic estimates for 3 out of 11 regions of the country and also kept its positive outlook for the third quarter.
- Support levels: 109.19, 108.65
- Resistance levels: 109.61, 109.88, 110.22, 110.41, 110.56
The main trend of the USD/JPY currency pair is bearish. The price is trading below the moving average now, but it has deviated strongly from the average line. Considering the divergence on the MACD indicator, traders can look for buy positions, but only with short targets, as it will be trading against the main trend. For sell positions, it is necessary to wait for a pullback to the resistance level.
Alternative scenario: if the price rises above 110.22, the uptrend is likely to be resumed.

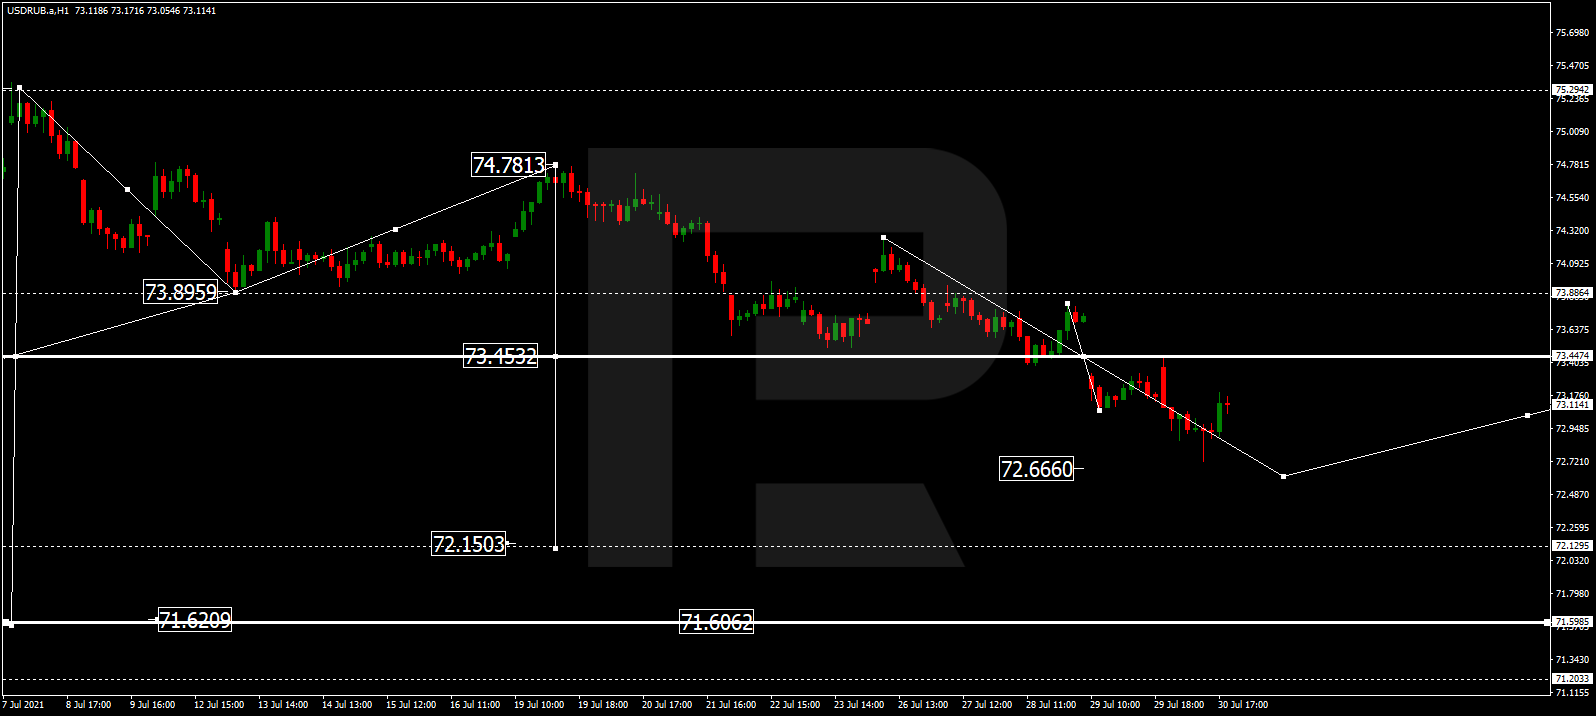
The USD/CAD currency pair
- Prev Open: 1.2476
- Prev Close: 1.2502
- % chg. over the last day: +0.21%
The Canadian dollar is highly dependent on the dollar index and the oil price dynamics. Oil prices fell sharply yesterday, which caused a decline in the Canadian dollar futures and the growth of USD/CAD quotes (inverse correlation).
- Support levels: 1.2425, 1.2370, 1.2312
- Resistance levels: 1.2531, 1.2602, 1.2671, 1.2787, 1,2951
Considering technical analysis, the USD/CAD trend is bearish. The MACD went above the zero line, but there are the first signs of a reversal. Under such market conditions, traders should look for sell positions from the resistance levels after a small pullback. Buy positions can be considered only throughout the day and only with short targets.
Alternative scenario: if the price breaks through the 1.2671 resistance level and fixes above, the uptrend is likely to be resumed.

by JustForex
This article reflects a personal opinion and should not be interpreted as an investment advice, and/or offer, and/or a persistent request for carrying out financial transactions, and/or a guarantee, and/or a forecast of future events.