By Orbex
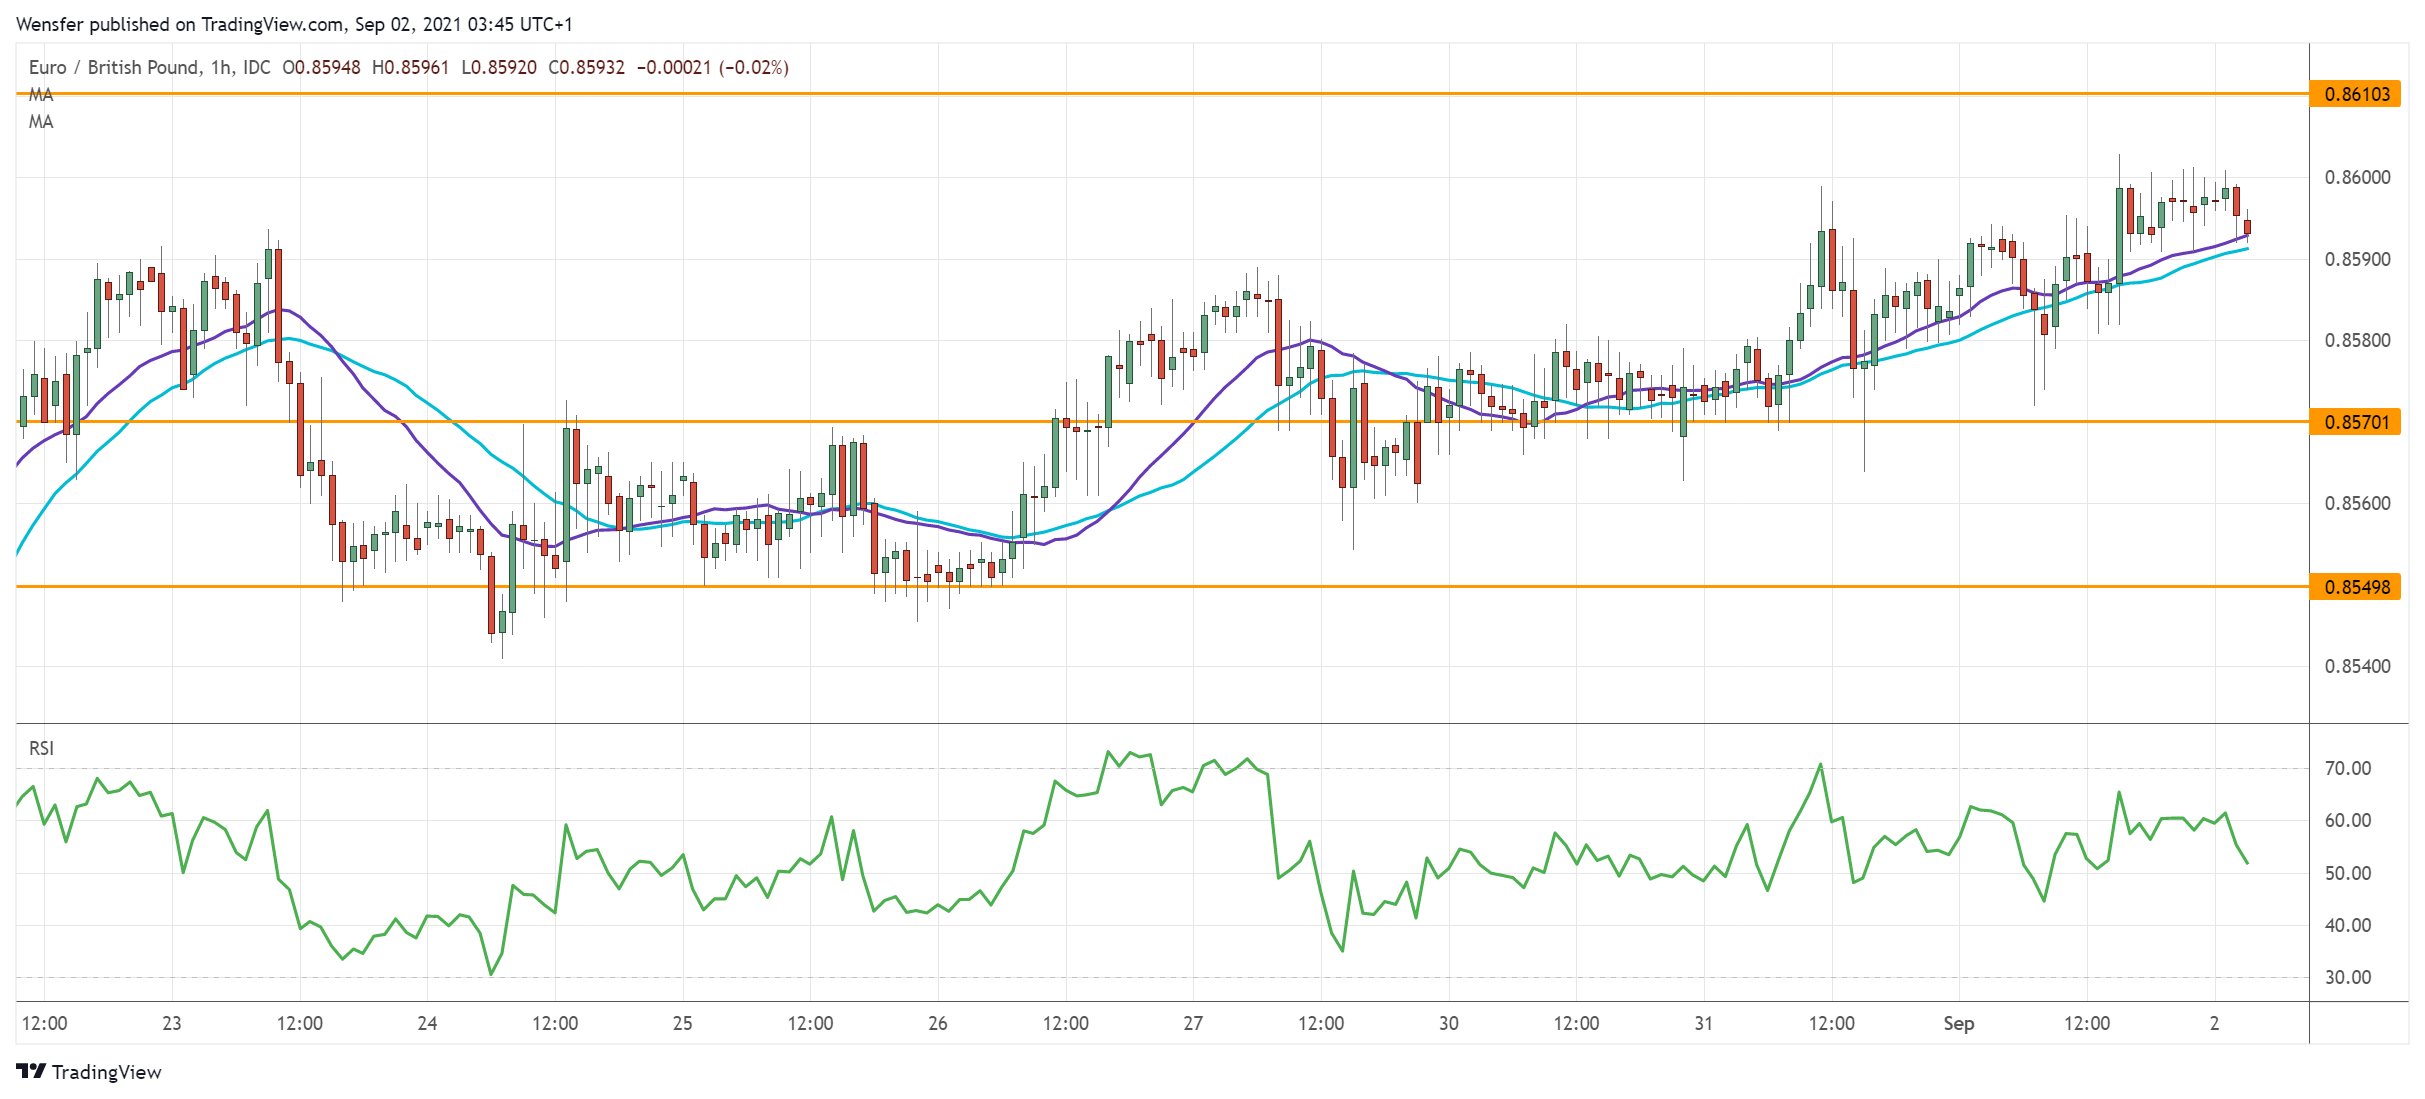
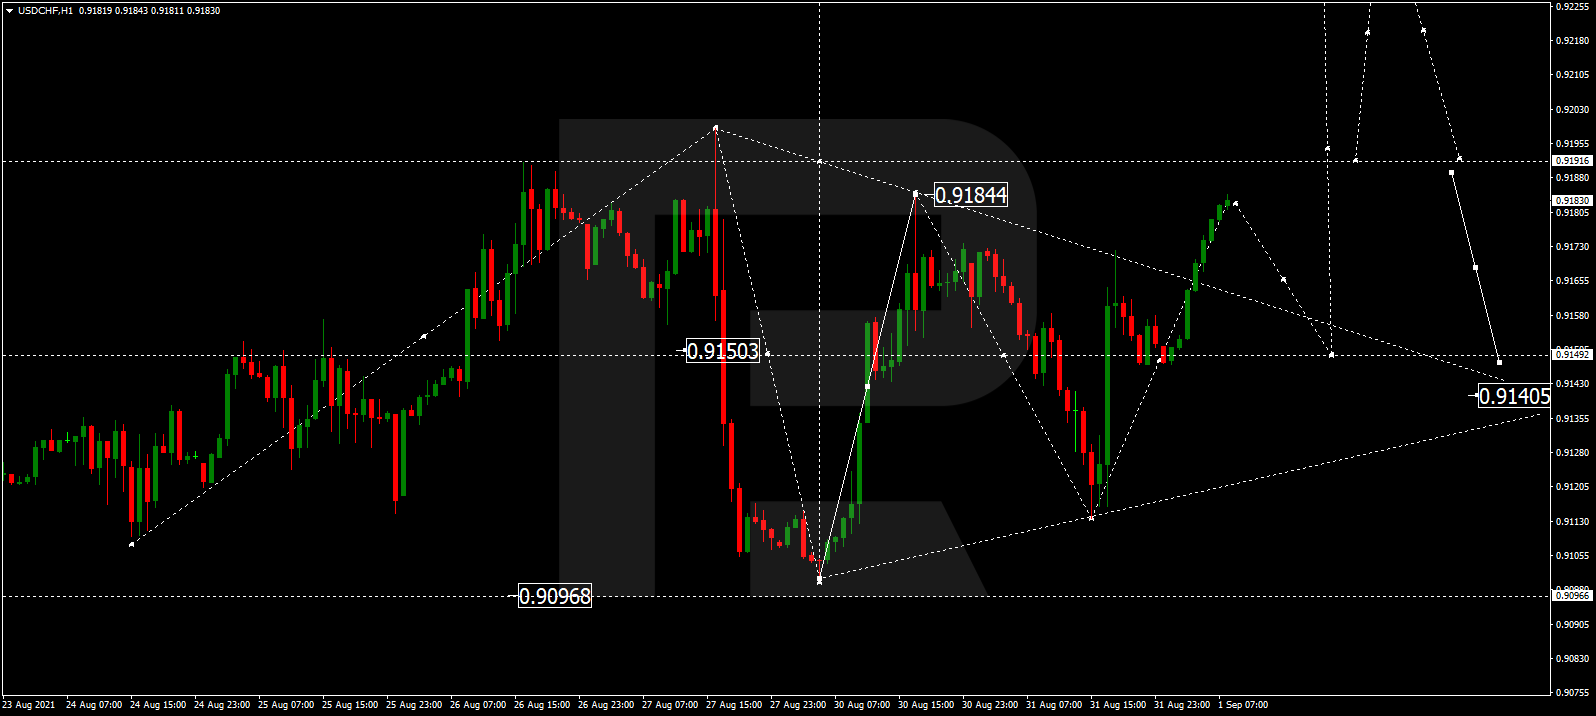
USDCHF awaits catalyst
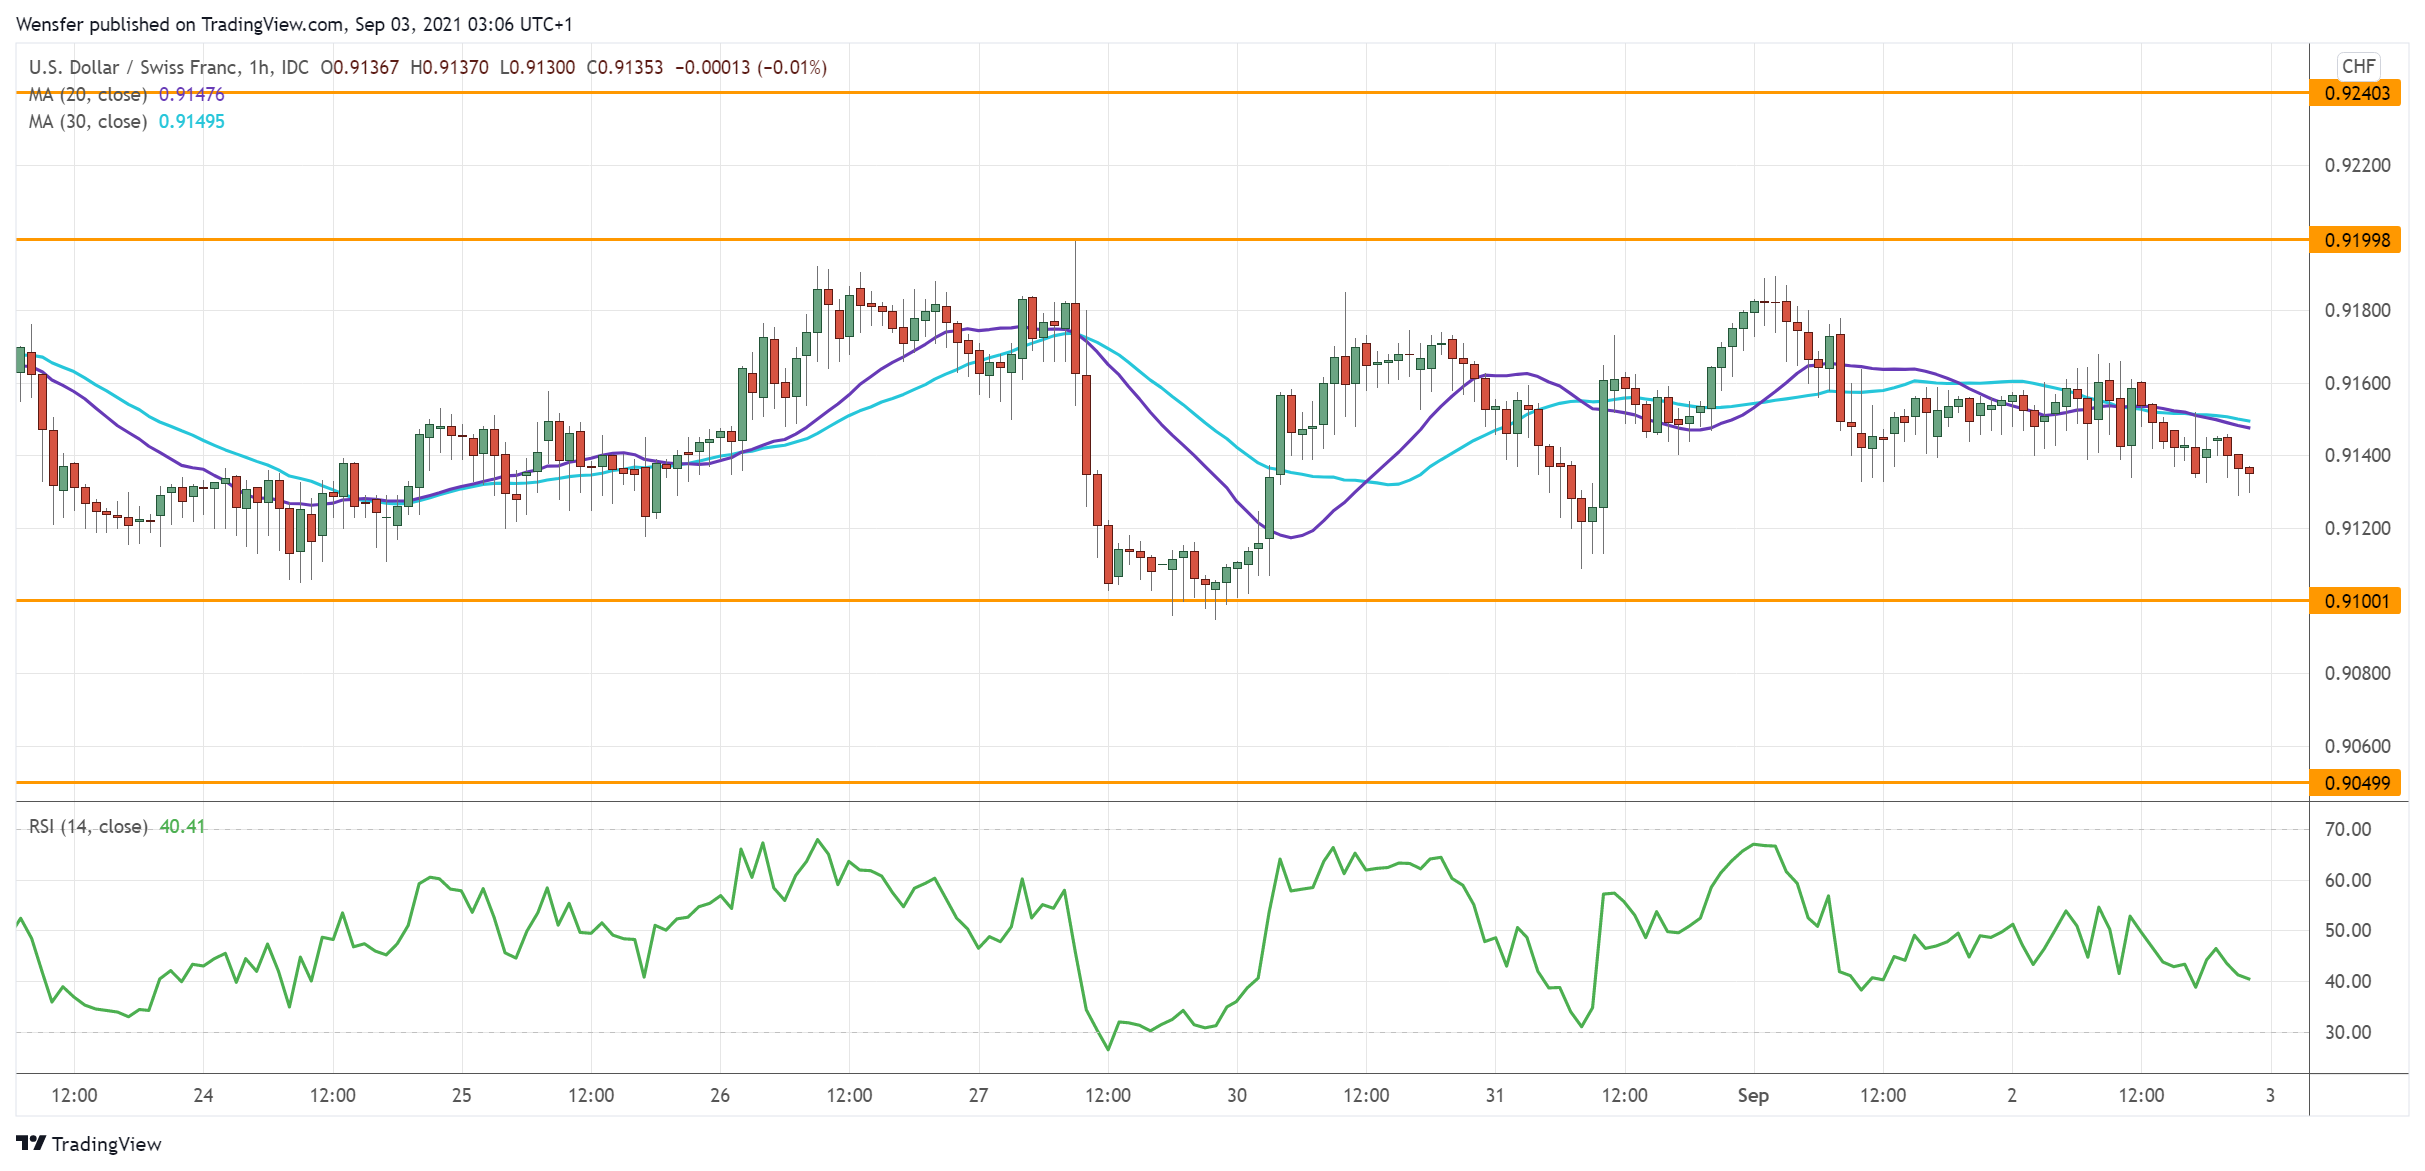
The US dollar consolidates as traders reposition themselves ahead of nonfarm payrolls.
The pair has been changing hands in a narrow range between 0.9100 and 0.9200. Multiple attempts at both ends suggest a lack of commitment.
A catalyst-driven breakout would dictate the direction for the days to come. A rally would test the recent peak at 0.9240, a prerequisite for a reversal above 0.9300.
On the downside, a sell-off may dampen optimism and lead to a retest of the demand zone at 0.9050.
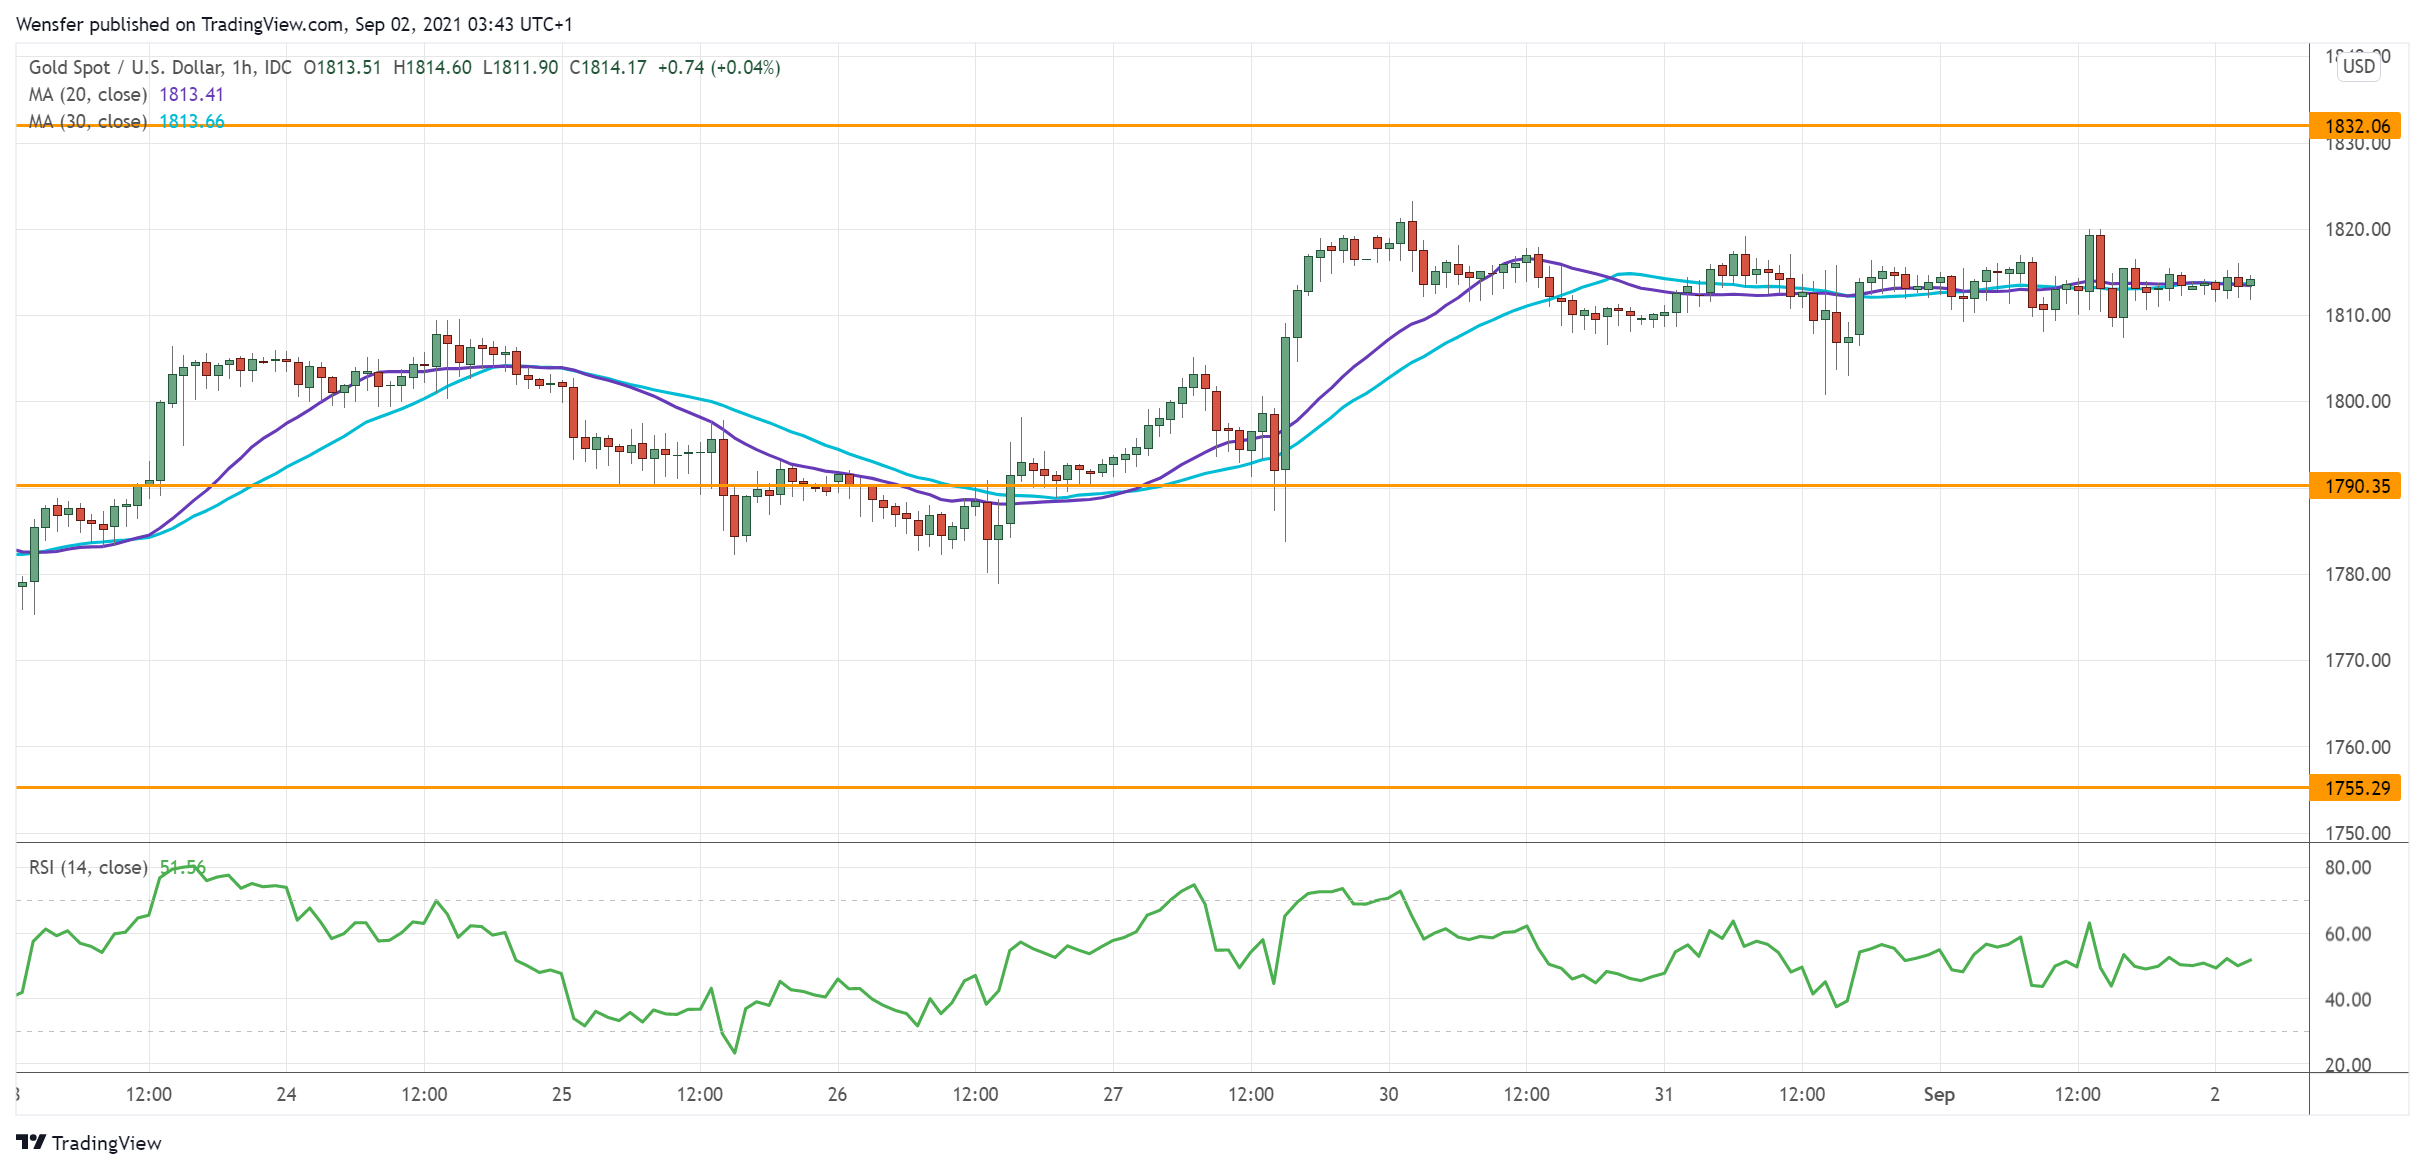
XAGUSD tests major resistance
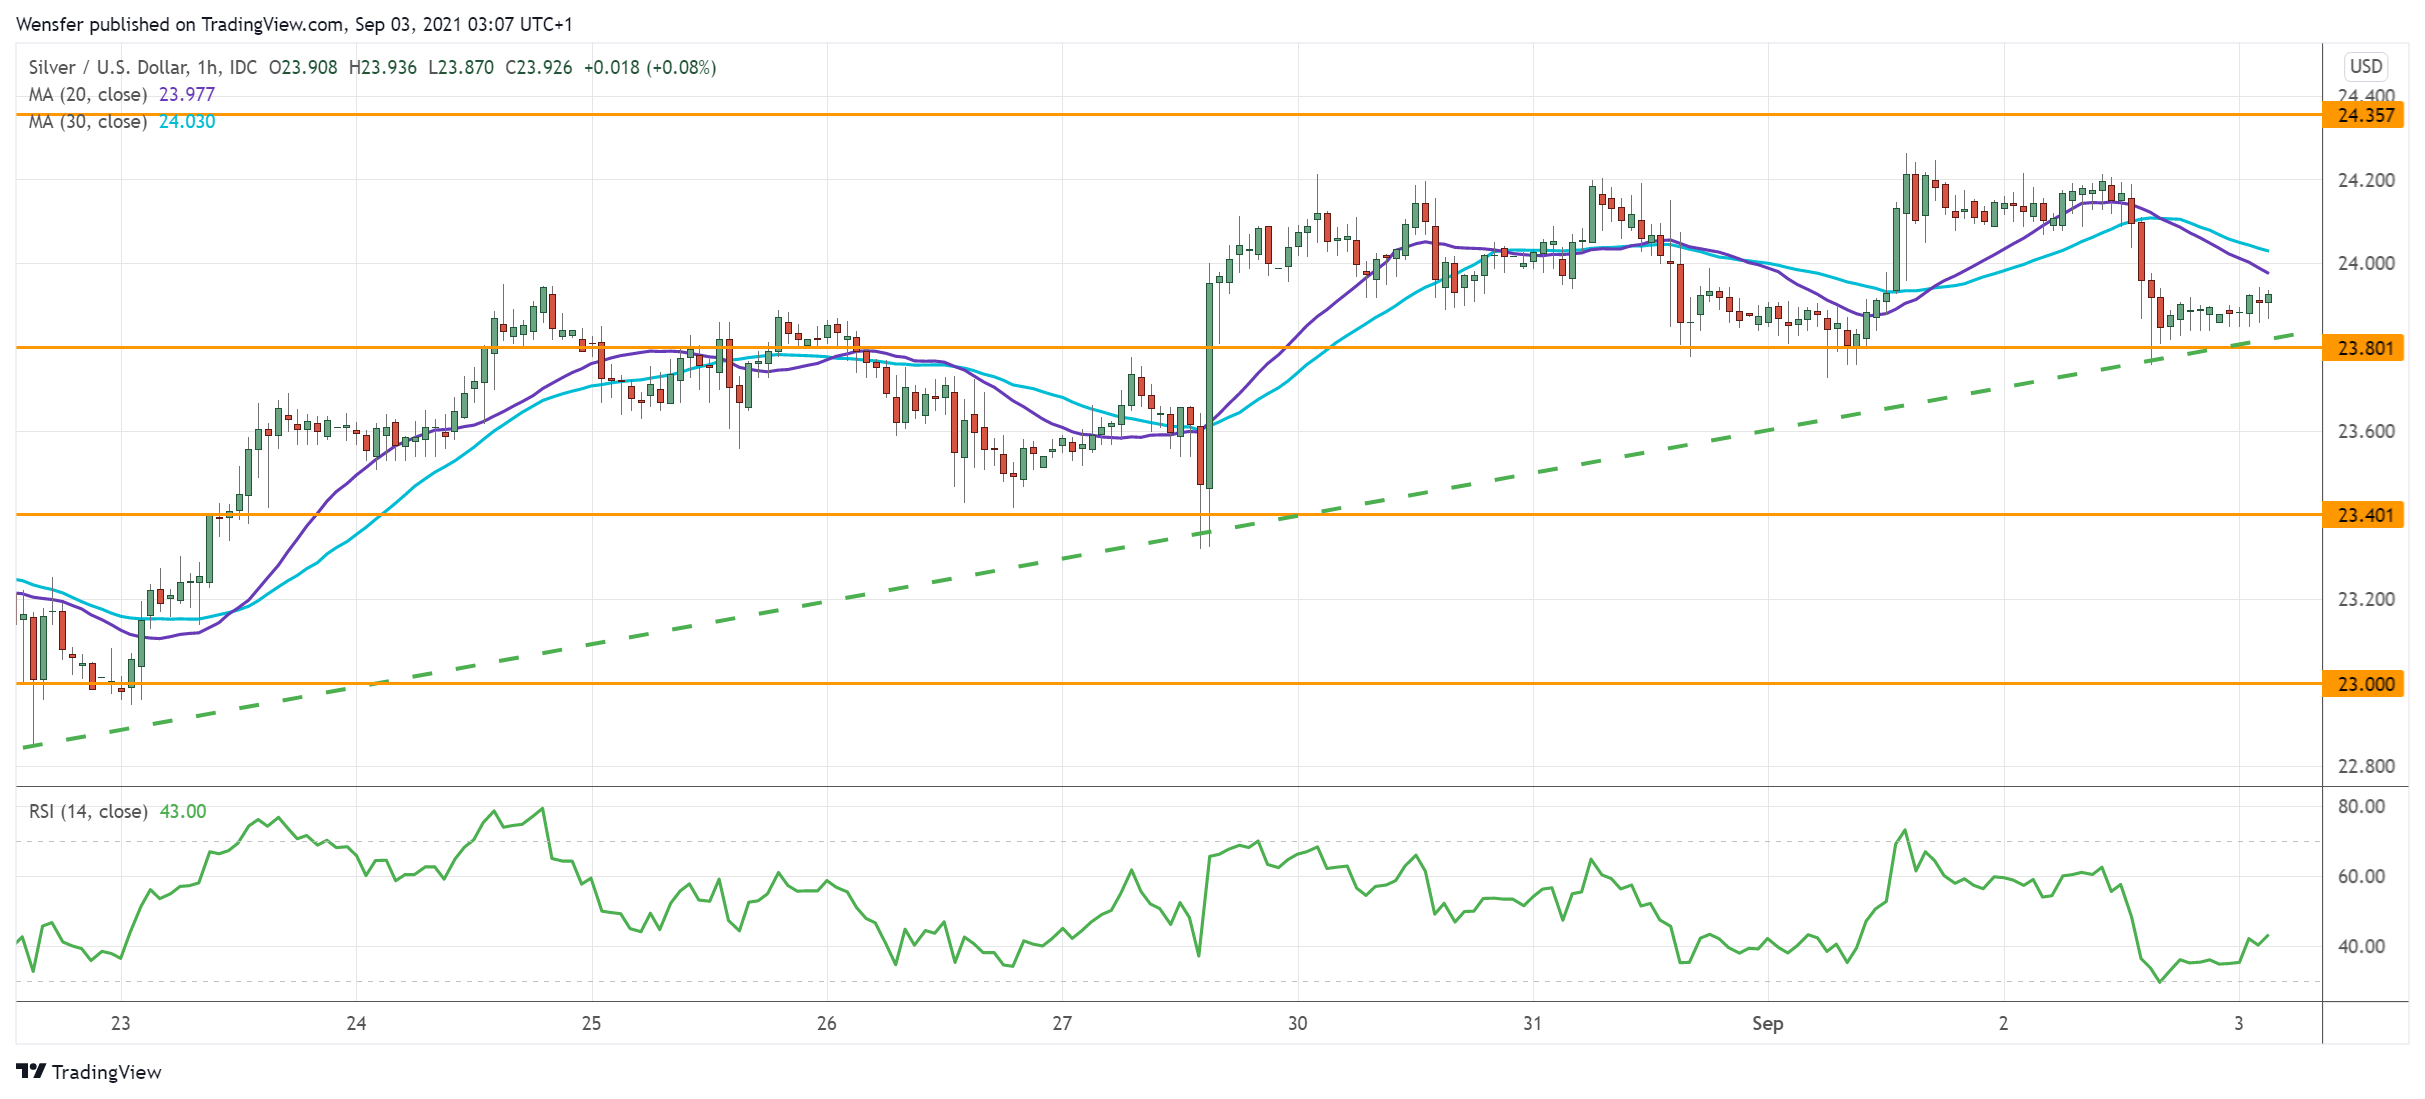
Bullions await a breakout as Treasury yields stabilize going into today’s high-impact jobs report.
Silver’s recovery above the psychological level of 24.00 has attracted more buying interest. However, the price has met resistance at the supply zone near 24.35, which coincides with the 30-day moving average.
A bullish breakout would trigger an extended rally as sellers rush to cover. Then 25.00 would be the next target.
However, a plunge below 23.80 may cause a correction towards the daily support at 23.00.
NAS 100 shows exhaustion
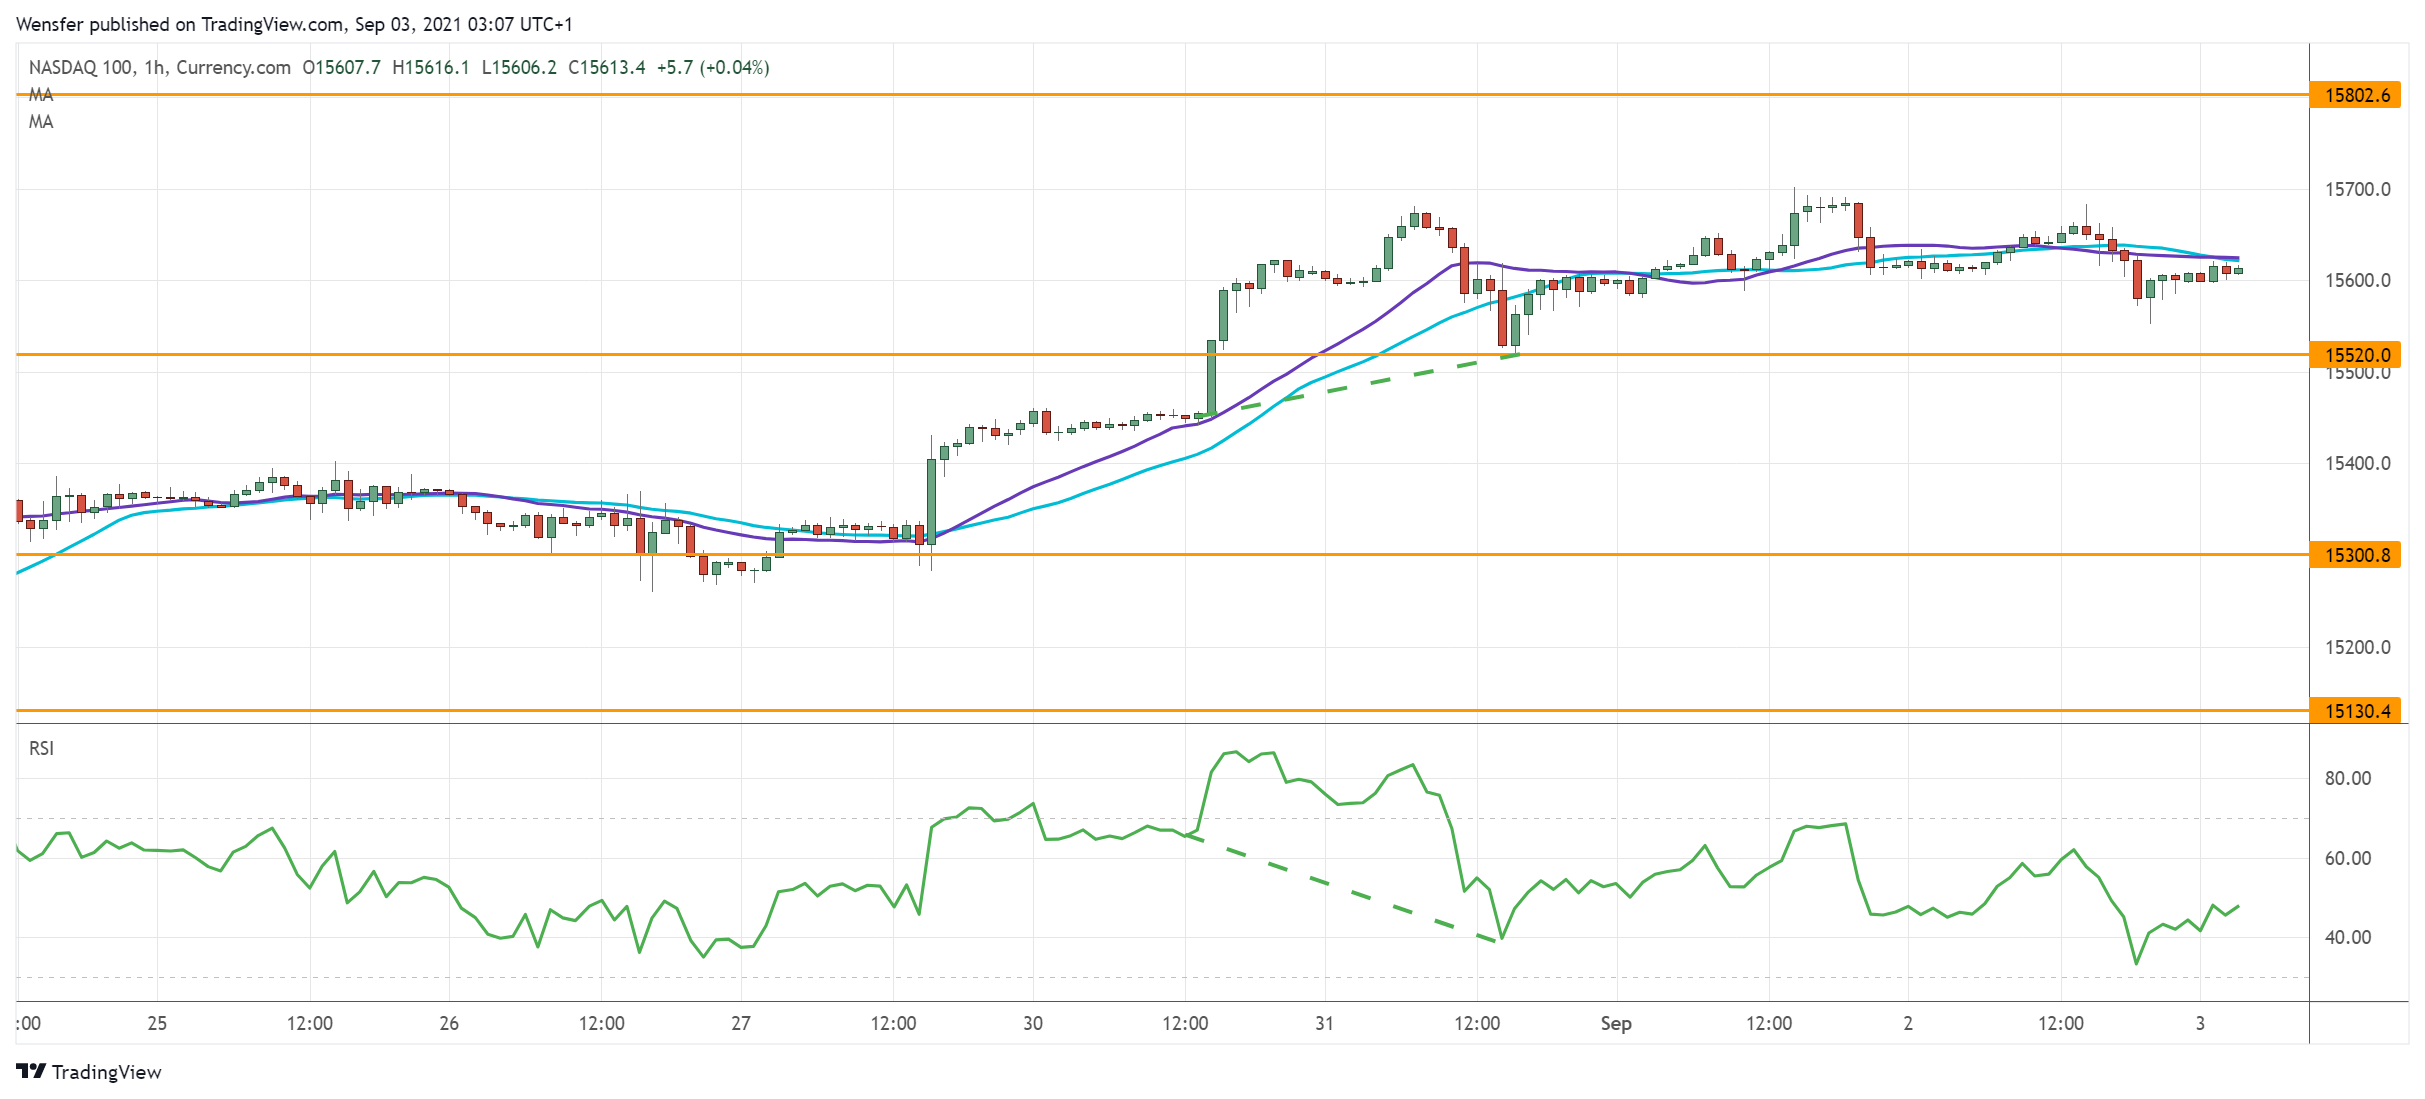
The Nasdaq 100 holds onto the high ground as investors ponder how the labor data may affect the QE.
The index is looking to extend gains from the all-time high of 15700. Nonetheless, sentiment remains bullish with signs of overextension.
An RSI bearish divergence is a heads-up that a correction might be due. A break below 15520 may pull the trigger and 15300 on the 20-day moving average would be an important support.
On the upside, 15800 would be the immediate target if the bulls can keep up with the momentum.
![]() Article by Orbex
Article by Orbex
Orbex is a fully licensed broker that was established in 2011. Founded with a mission to serve its traders responsibly and provides traders with access to the world’s largest and most liquid financial markets. www.orbex.com