Archive for Forex and Currency News – Page 232

Forex Technical Analysis & Forecast 01.09.2021

Article By RoboForex.com

EURUSD, “Euro vs US Dollar”

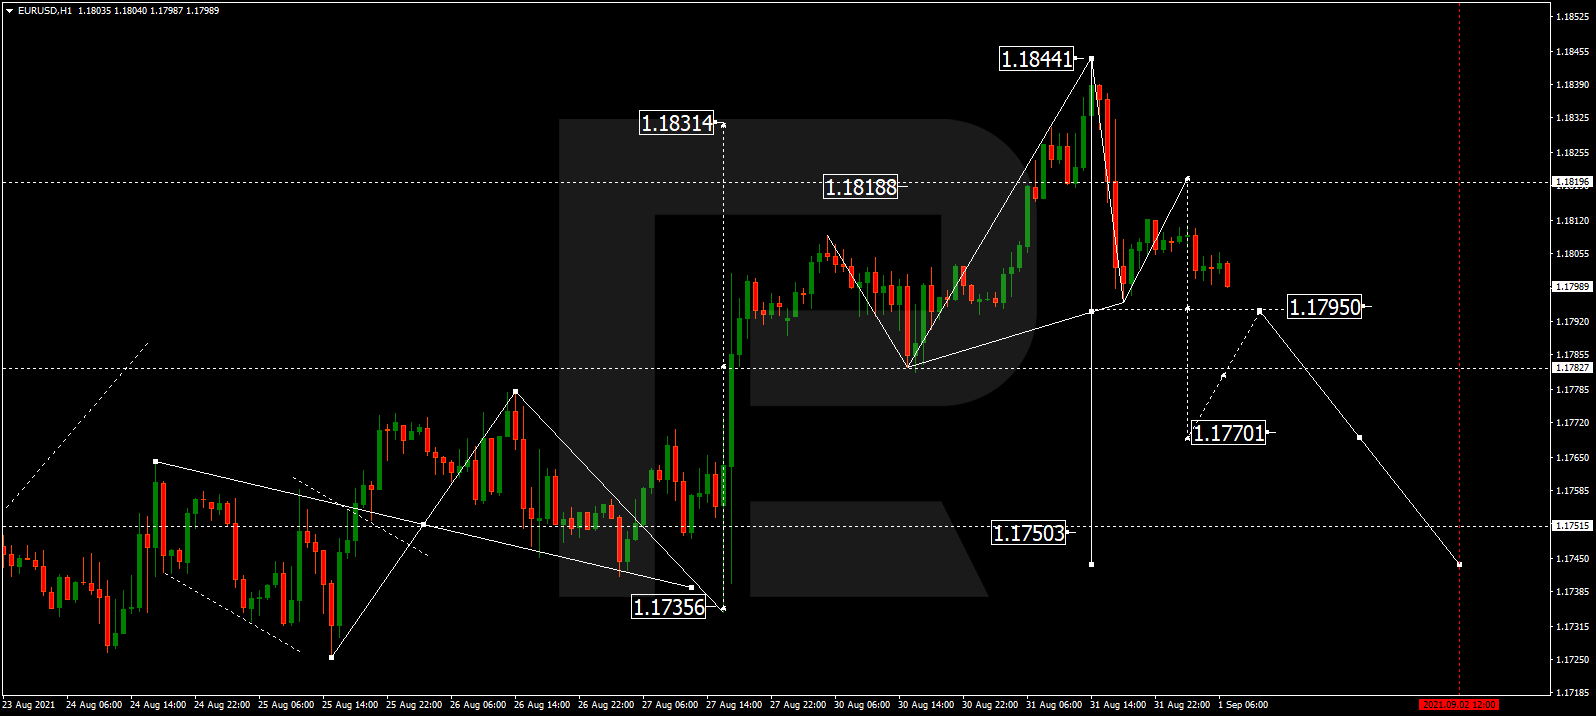
After rebounding from 1.1844 and then finishing the descending impulse at 1.1796, EURUSD is forming a new consolidation range above the latter level. If later the price breaks this range to the upside, the market may correct upwards to reach 1.1818; if to the downside – start a new decline with the short-term target at 1.1770.

EURUSD
Risk Warning: the result of previous trading operations do not guarantee the same results in the future

GBPUSD, “Great Britain Pound vs US Dollar”

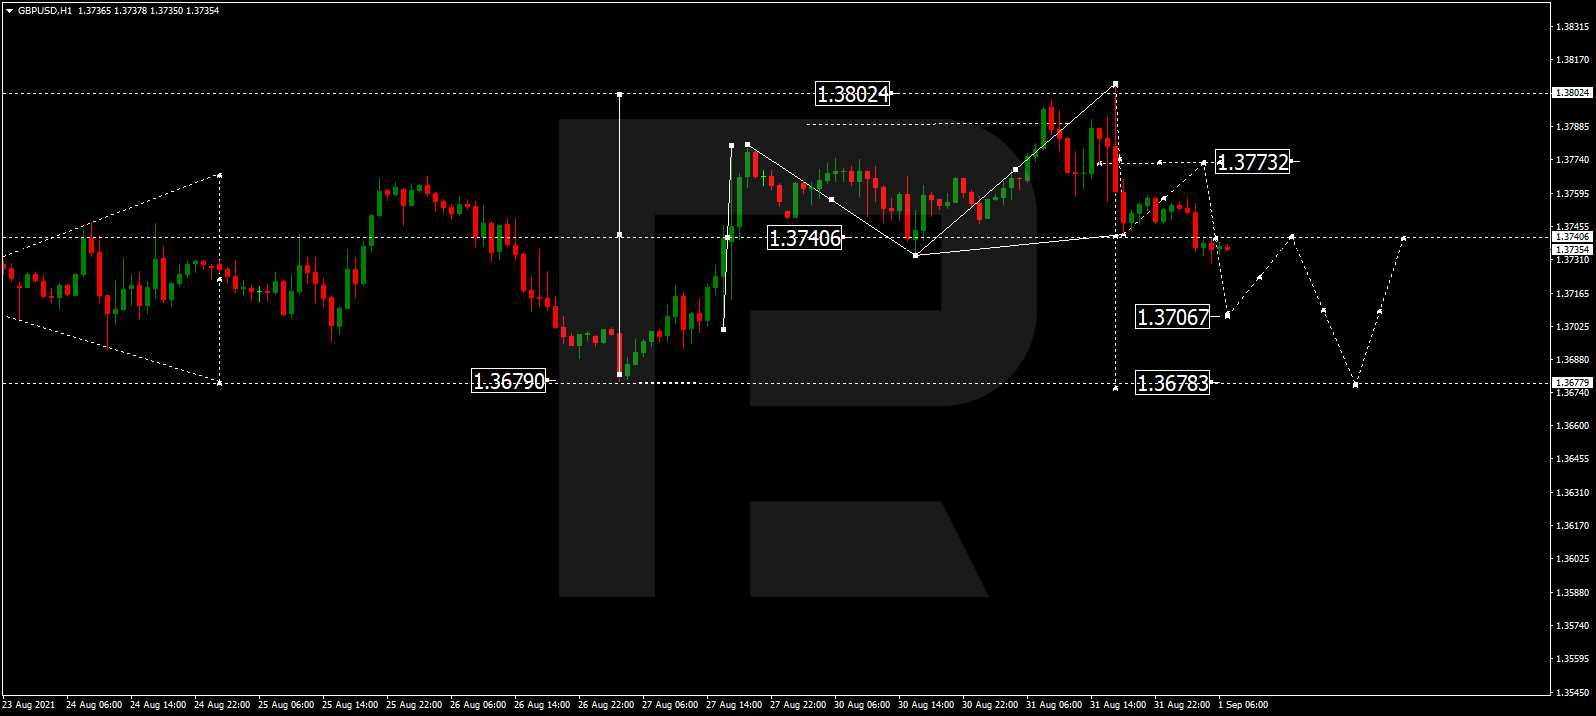
After completing the ascending wave at 1.3802 along with descending impulse towards 1.3740, GBPUSD is consolidating around the latter level. Possibly, the pair may correct to reach 1.3773 and then start another decline with the short-term target at 1.3707. In fact, the asset is expected to form the first descending wave with the target at 1.3678.
GBPUSD
Risk Warning: the result of previous trading operations do not guarantee the same results in the future

USDRUB, “US Dollar vs Russian Ruble”

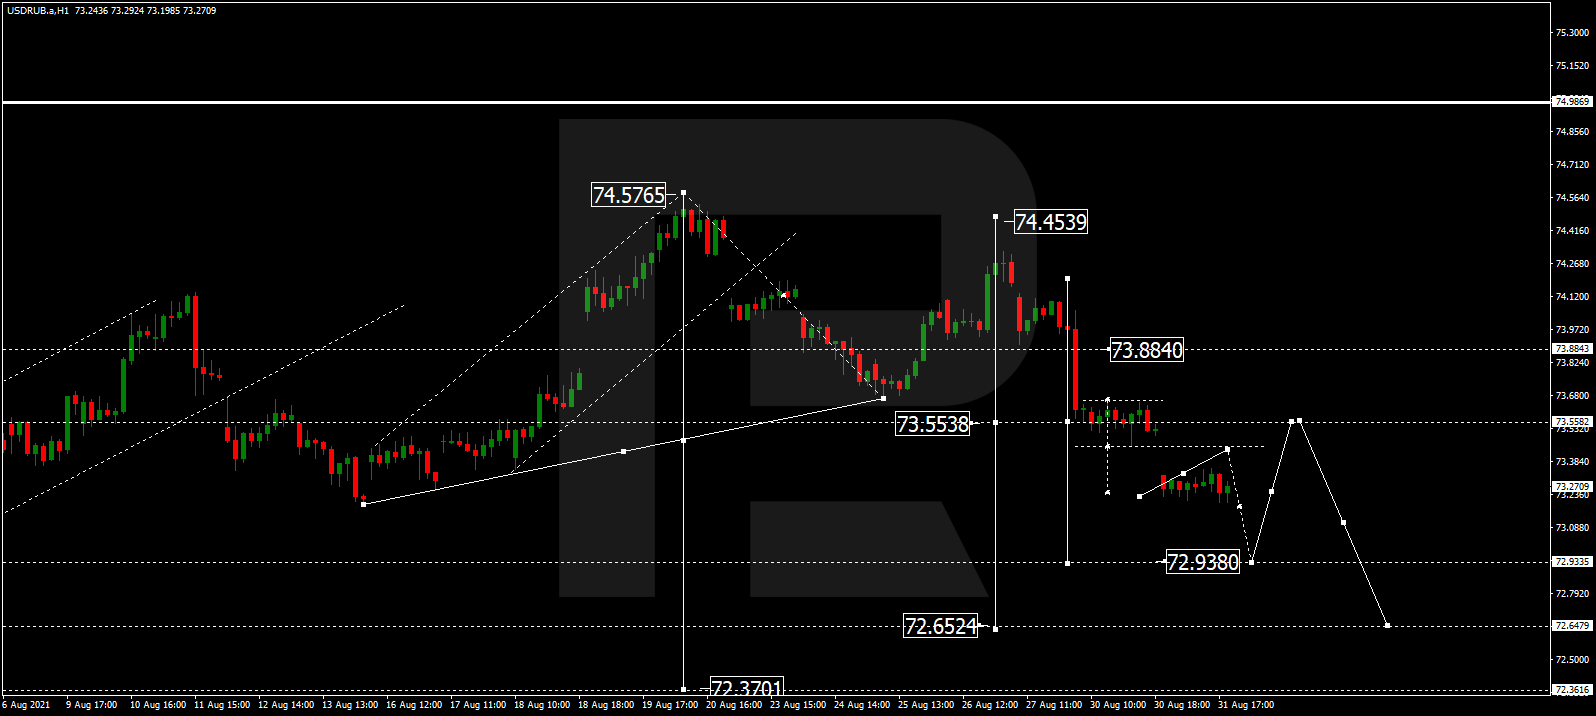
USDRUB continues falling. Today, the pair may reach 72.93 and then start another correction to test 73.55 from below. Later, the market may resume trading downwards with the target at 72.65.
USDRUB
Risk Warning: the result of previous trading operations do not guarantee the same results in the future

USDJPY, “US Dollar vs Japanese Yen”

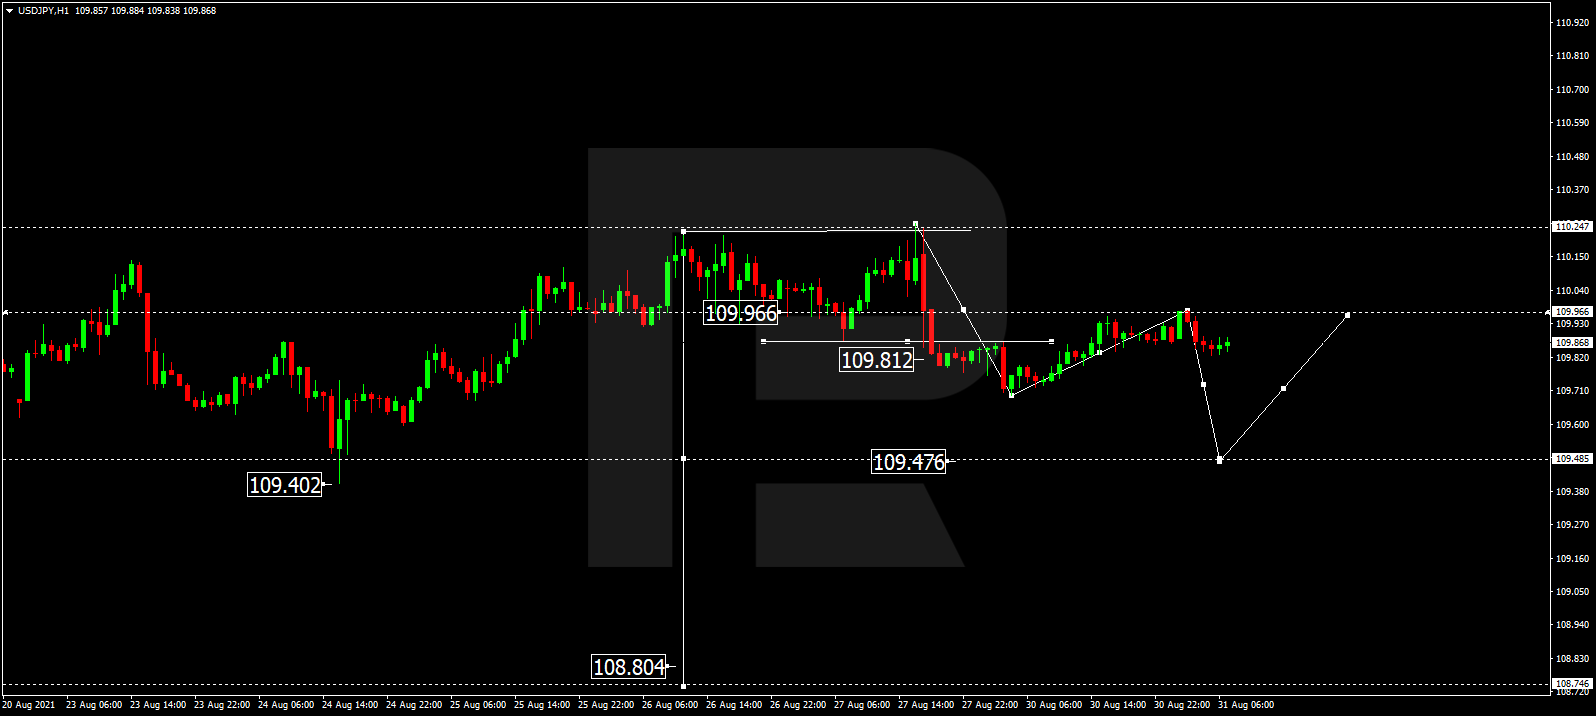
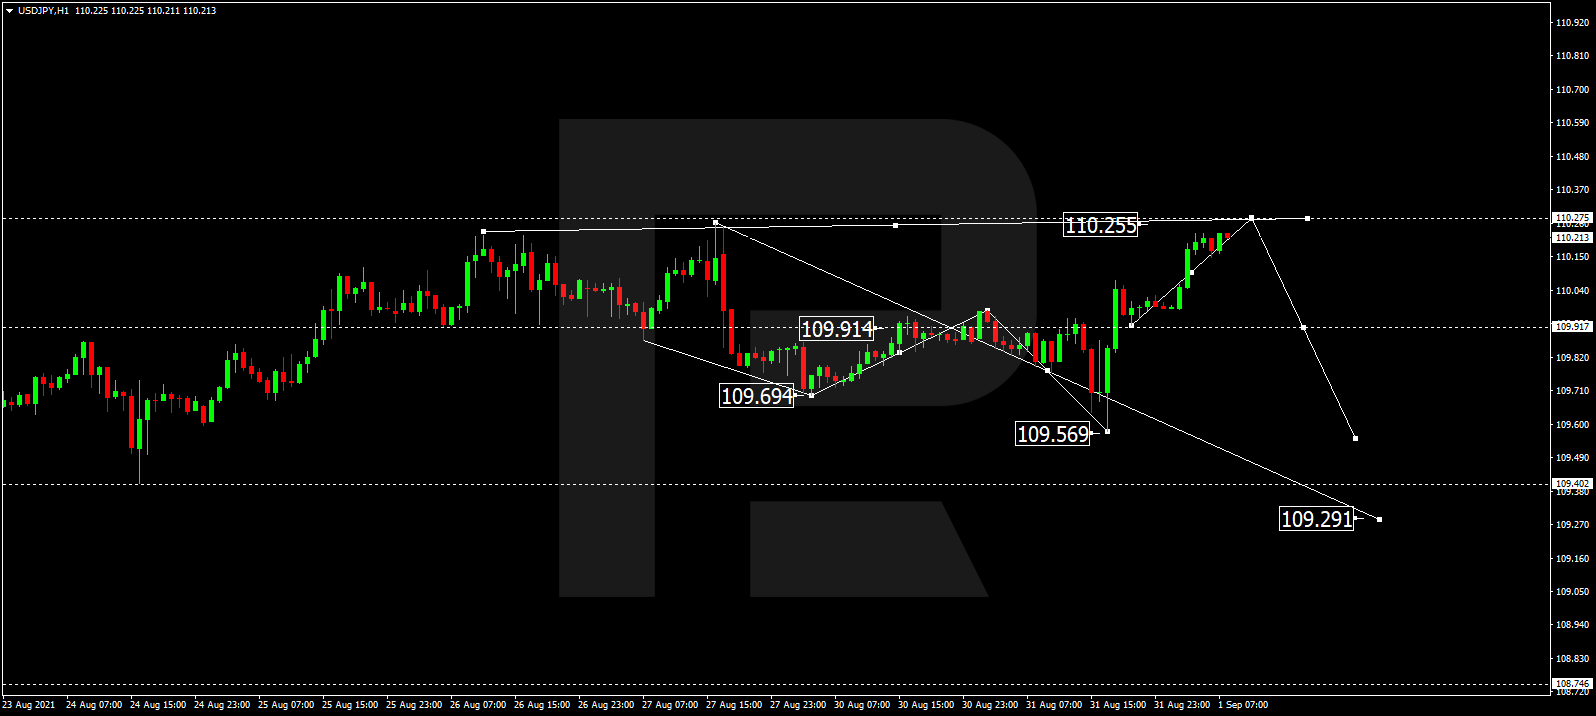
USDJPY is still consolidating around 109.80. Possibly, today the pair may expand the range up to 110.25 and then form a new descending structure to reach the downside border at 109.29.
USDJPY
Risk Warning: the result of previous trading operations do not guarantee the same results in the future

USDCHF, “US Dollar vs Swiss Franc”

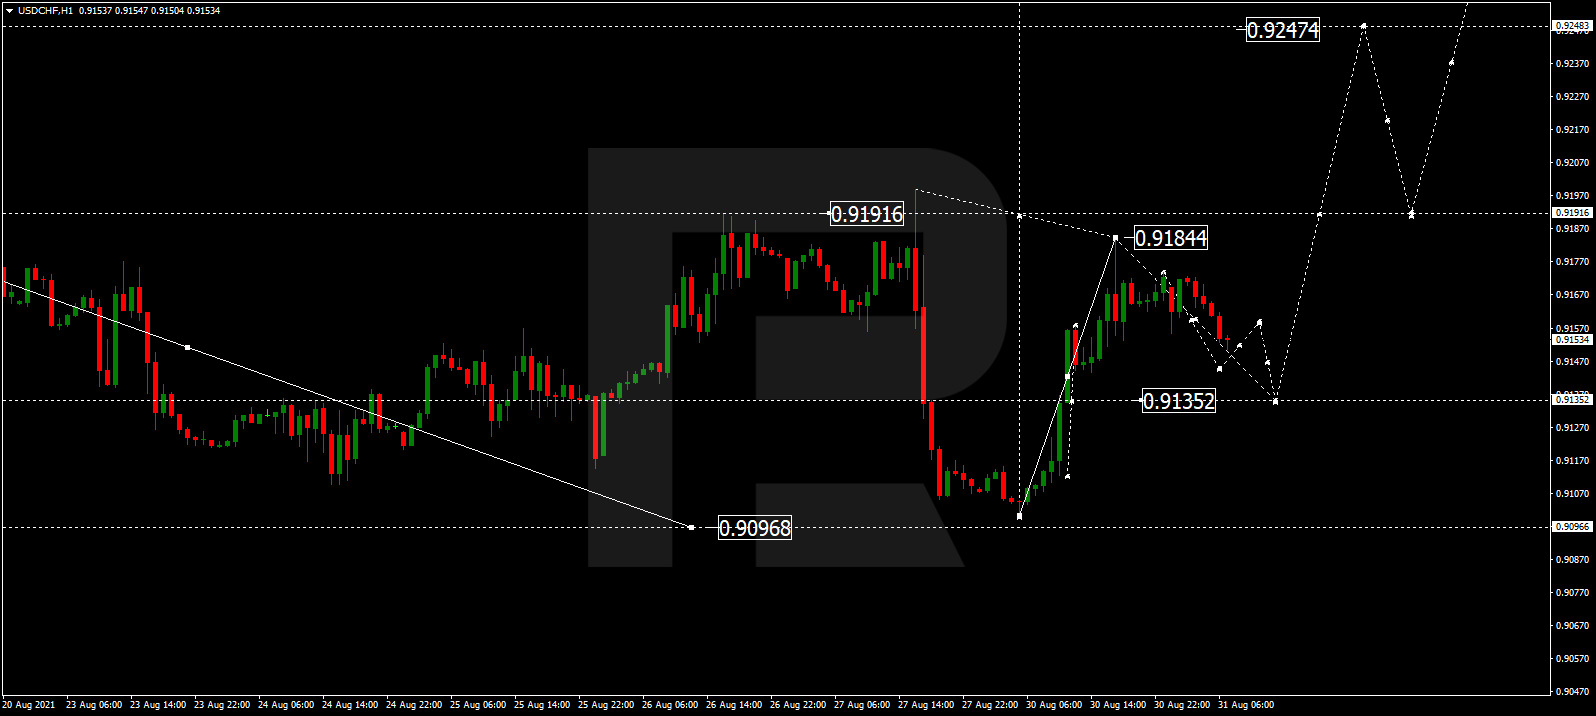
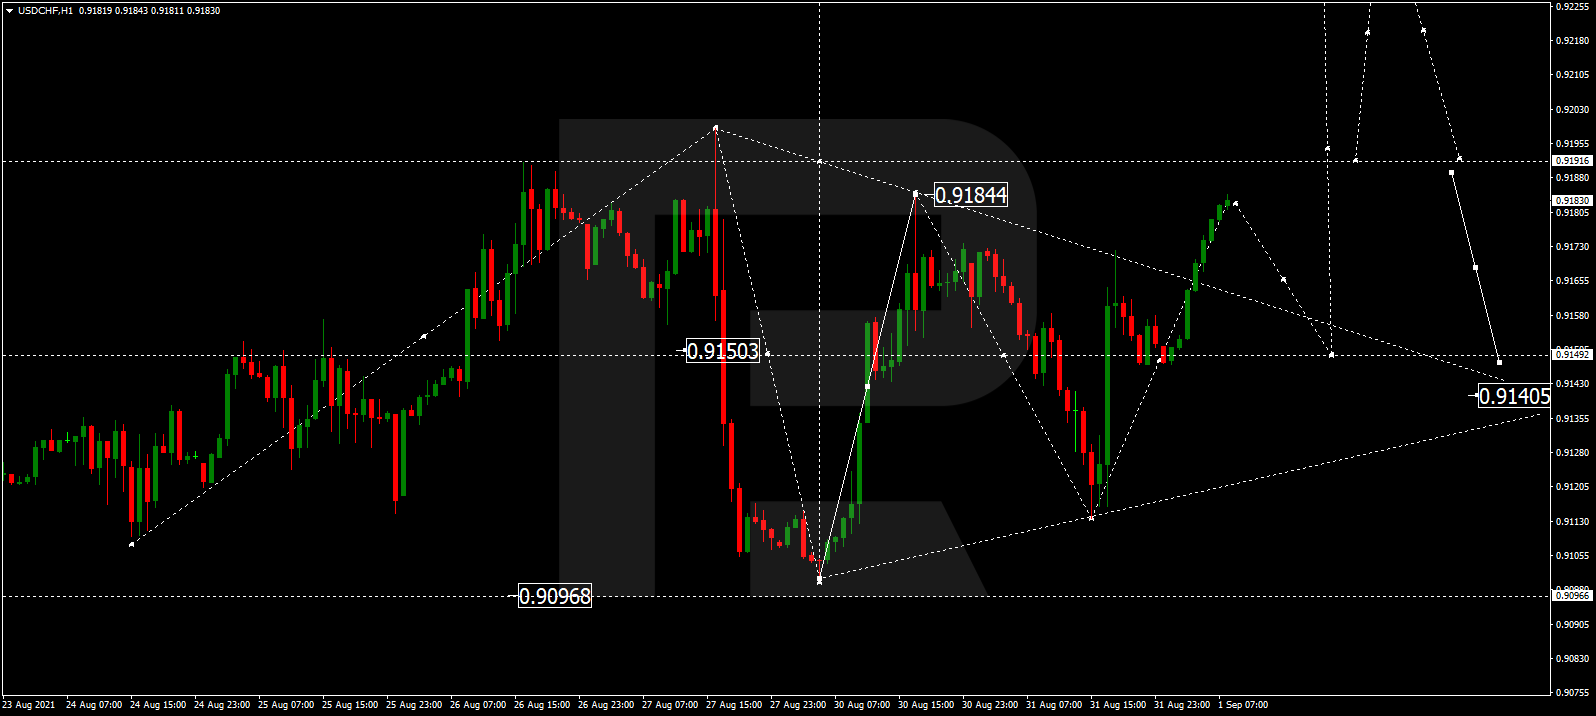
USDCHF is forming another ascending impulse towards 0.9199. After that, the instrument may break this level and then continue trading upwards with the short-term target at 0.9247.
USDCHF
Risk Warning: the result of previous trading operations do not guarantee the same results in the future

AUDUSD, “Australian Dollar vs US Dollar”

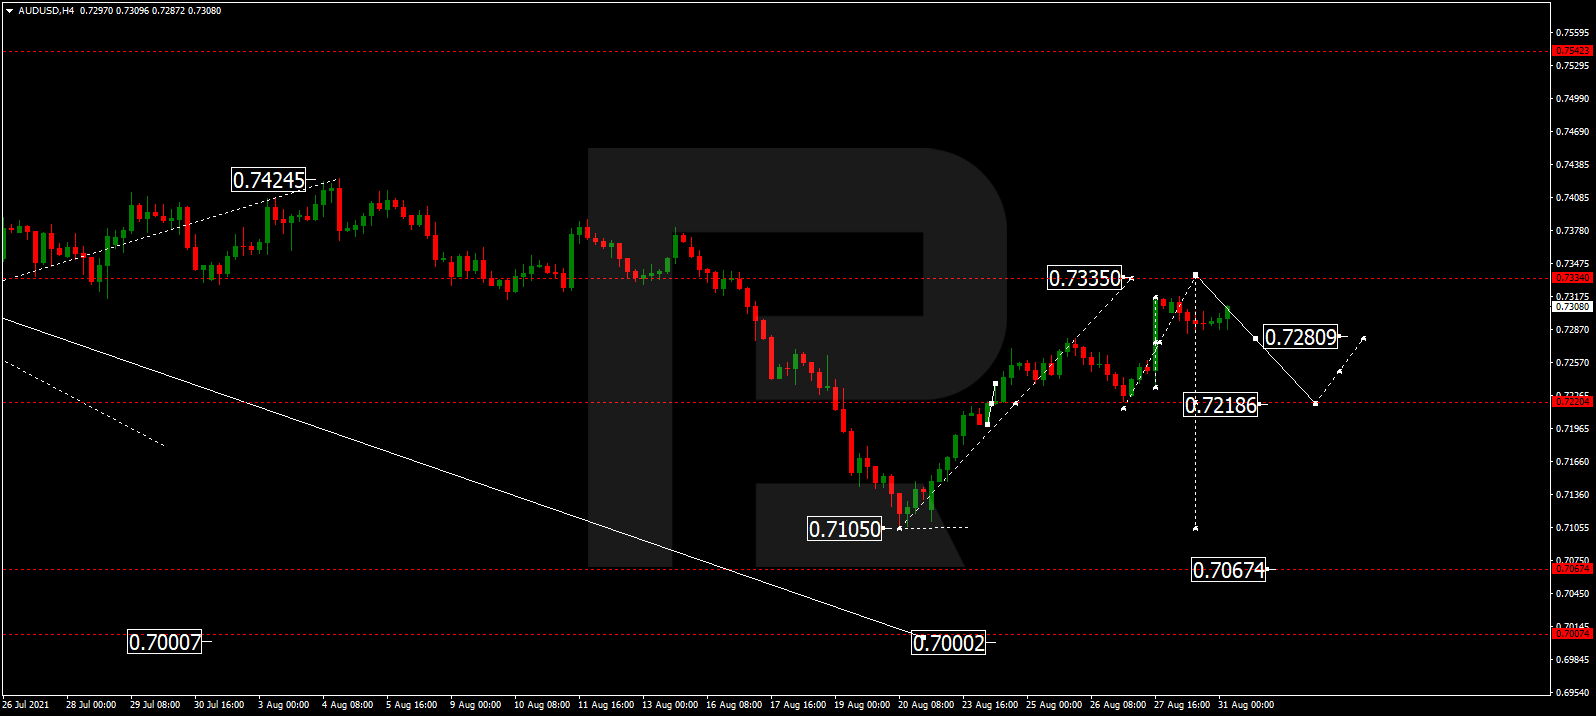
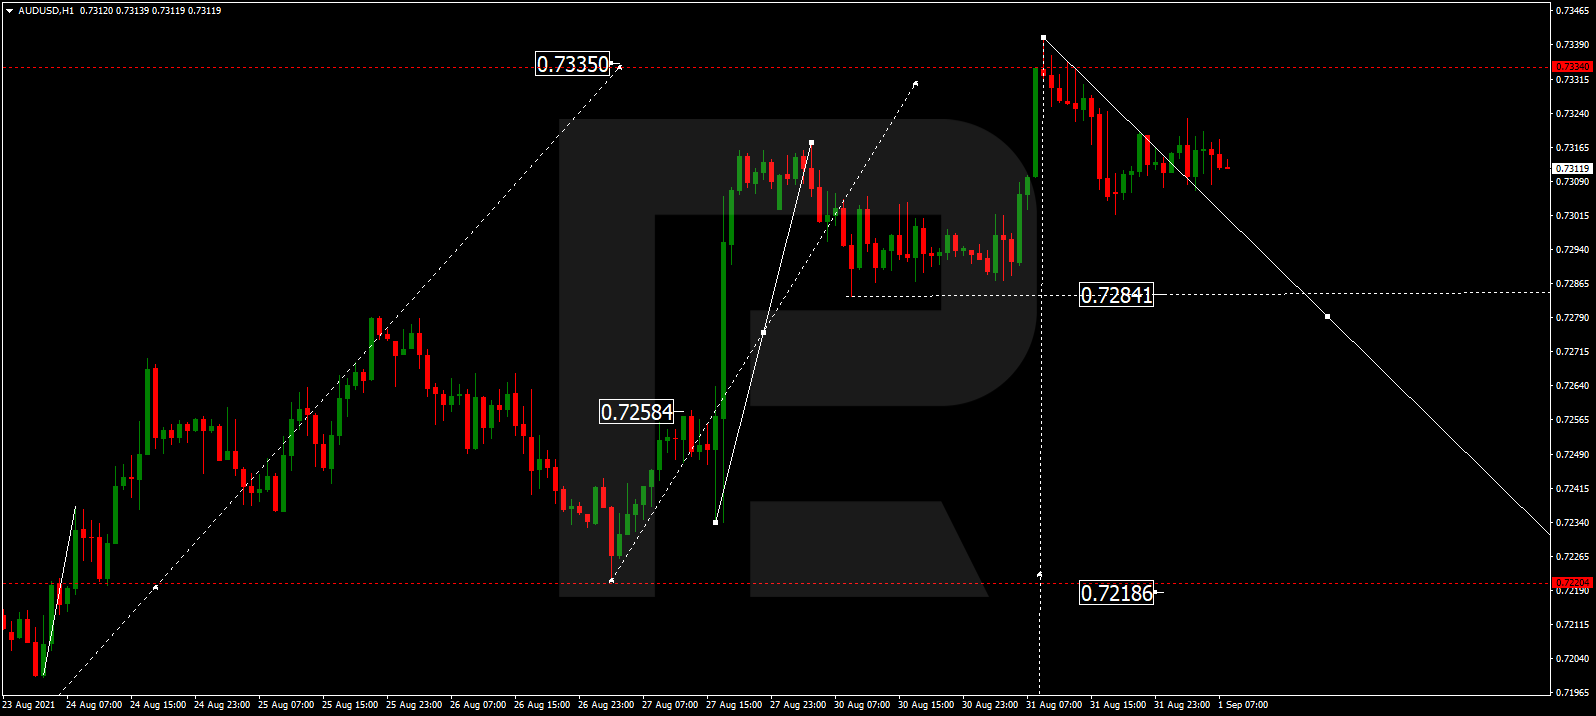
AUDUSD has completed the ascending wave at 0.7335. Possibly, today the pair may resume trading within the downtrend with the first target at 0.7284.
AUDUSD
Risk Warning: the result of previous trading operations do not guarantee the same results in the future

BRENT

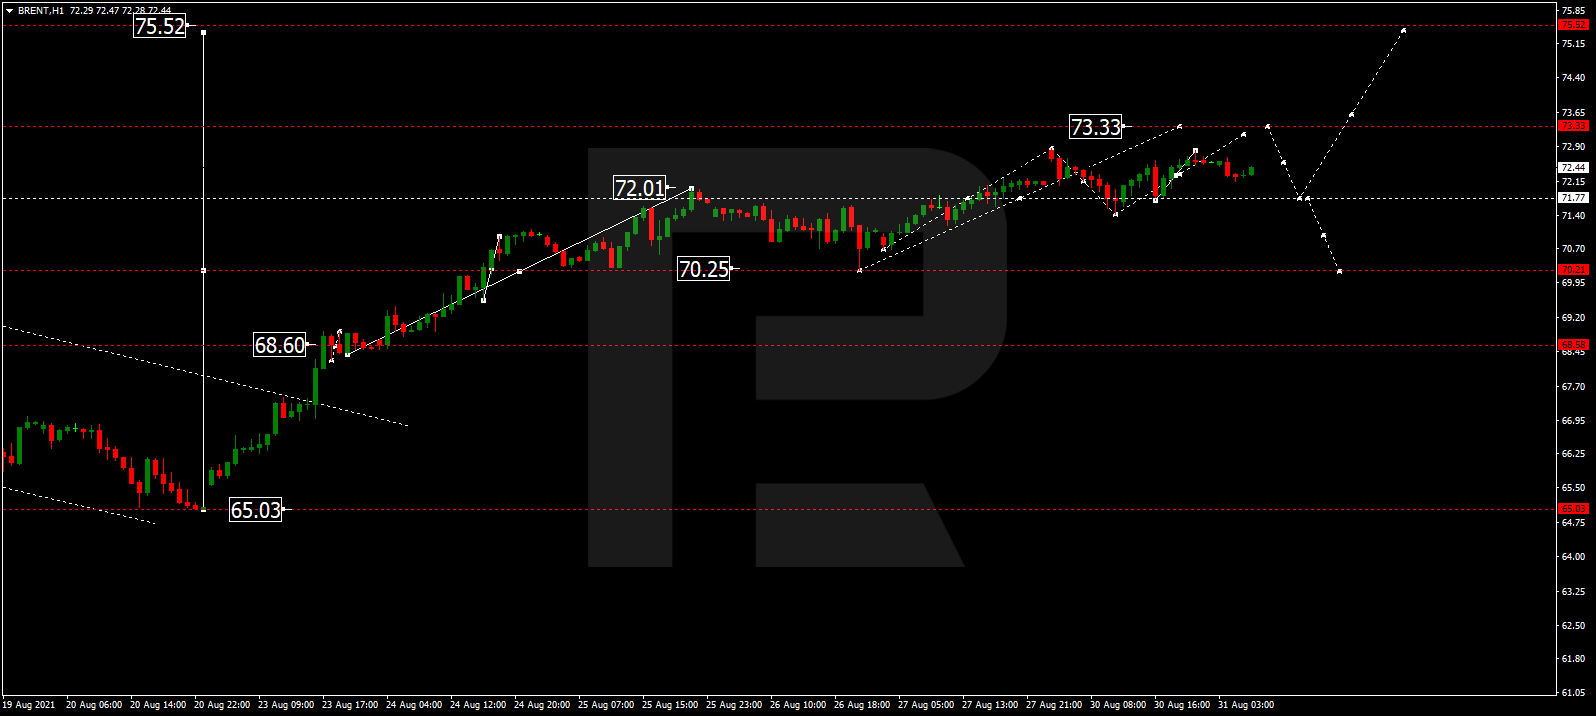
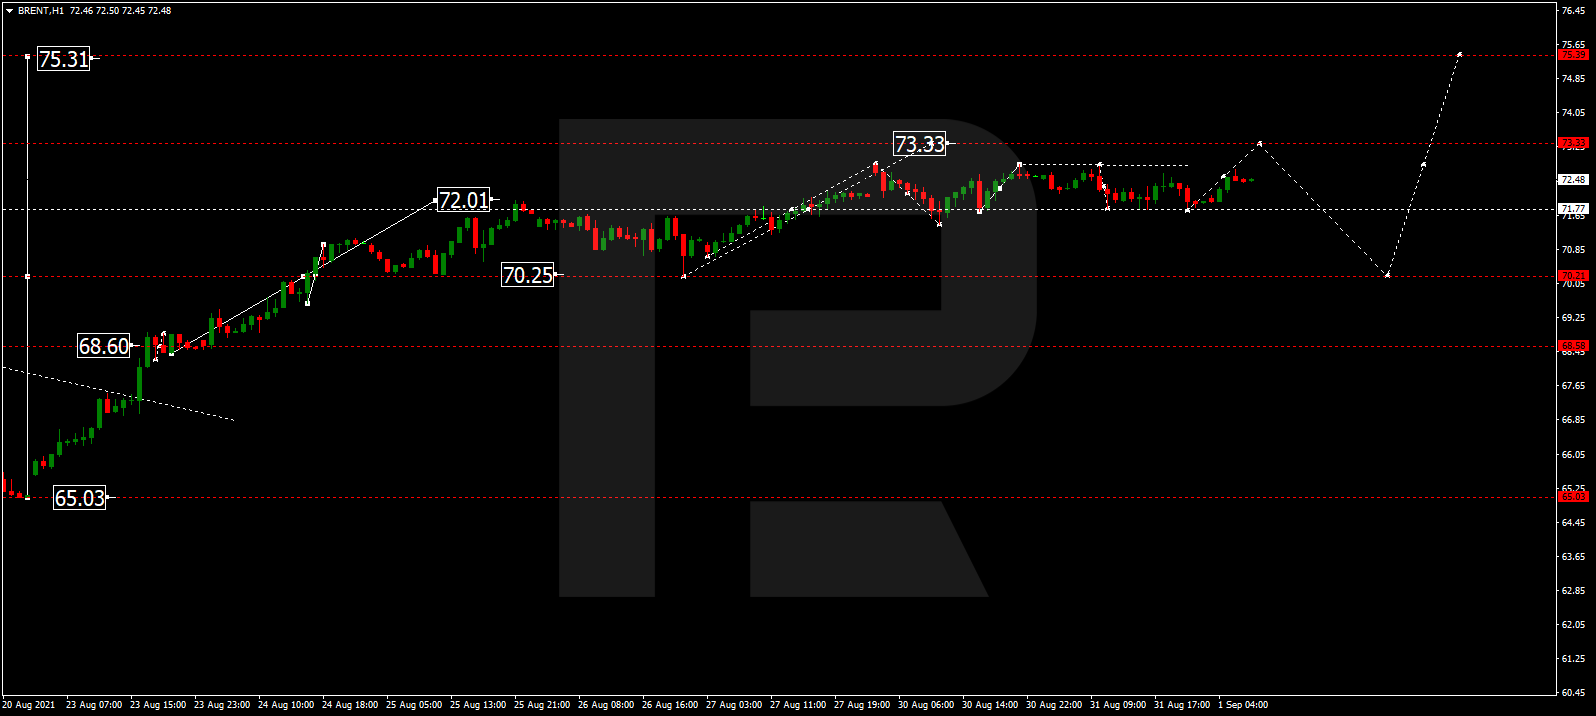
Brent is still consolidating around 72.00. Possibly, the asset may expand this range up to 73.33 and then start a new correction with the target at 70.25. After that, the instrument may form one more ascending structure to reach 75.30.
BRENT
Risk Warning: the result of previous trading operations do not guarantee the same results in the future

GOLD

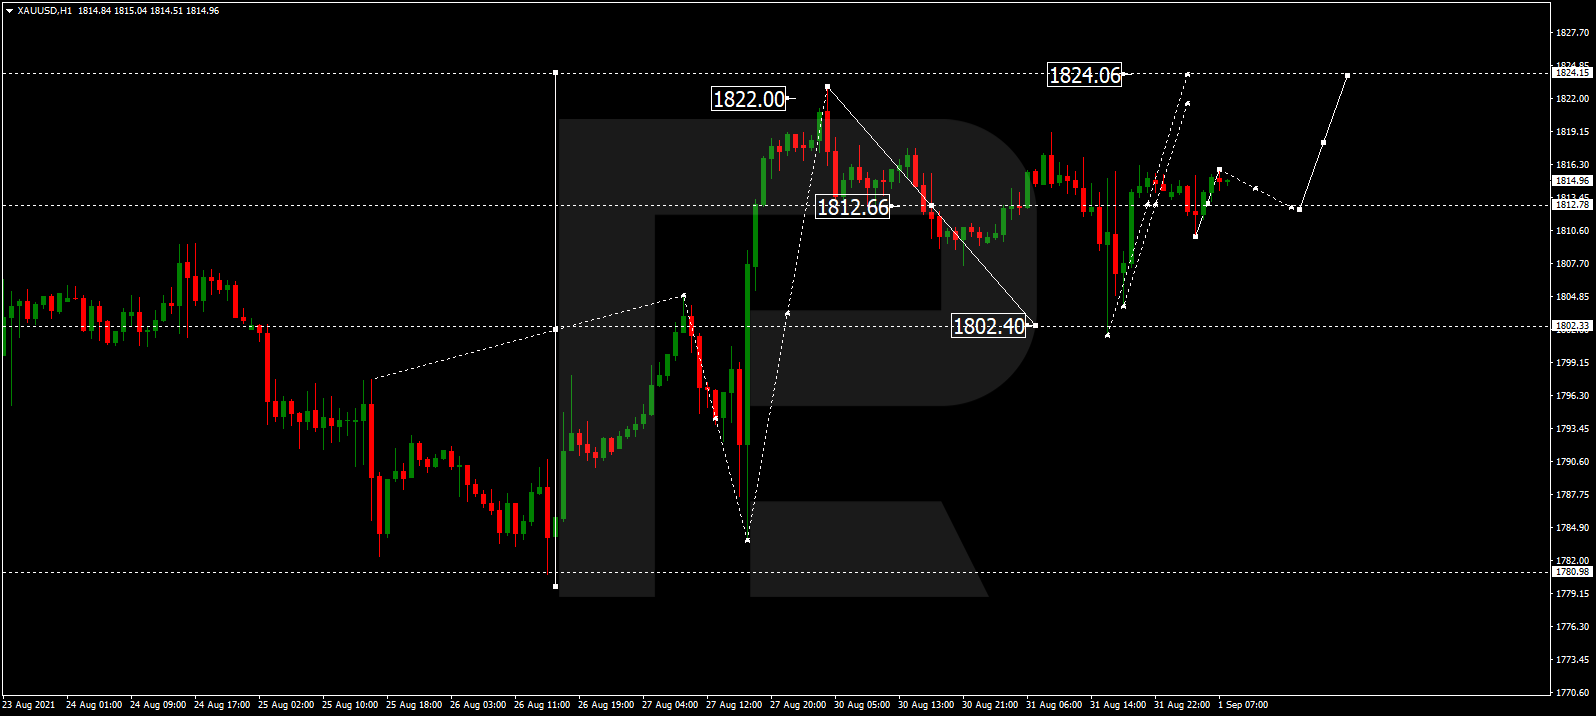
Gold is consolidating around 1812.66. Possibly, today the metal may start another growth towards 1824.00 and then resume trading downwards with the target at 1802.40.
GOLD
Risk Warning: the result of previous trading operations do not guarantee the same results in the future

S&P 500

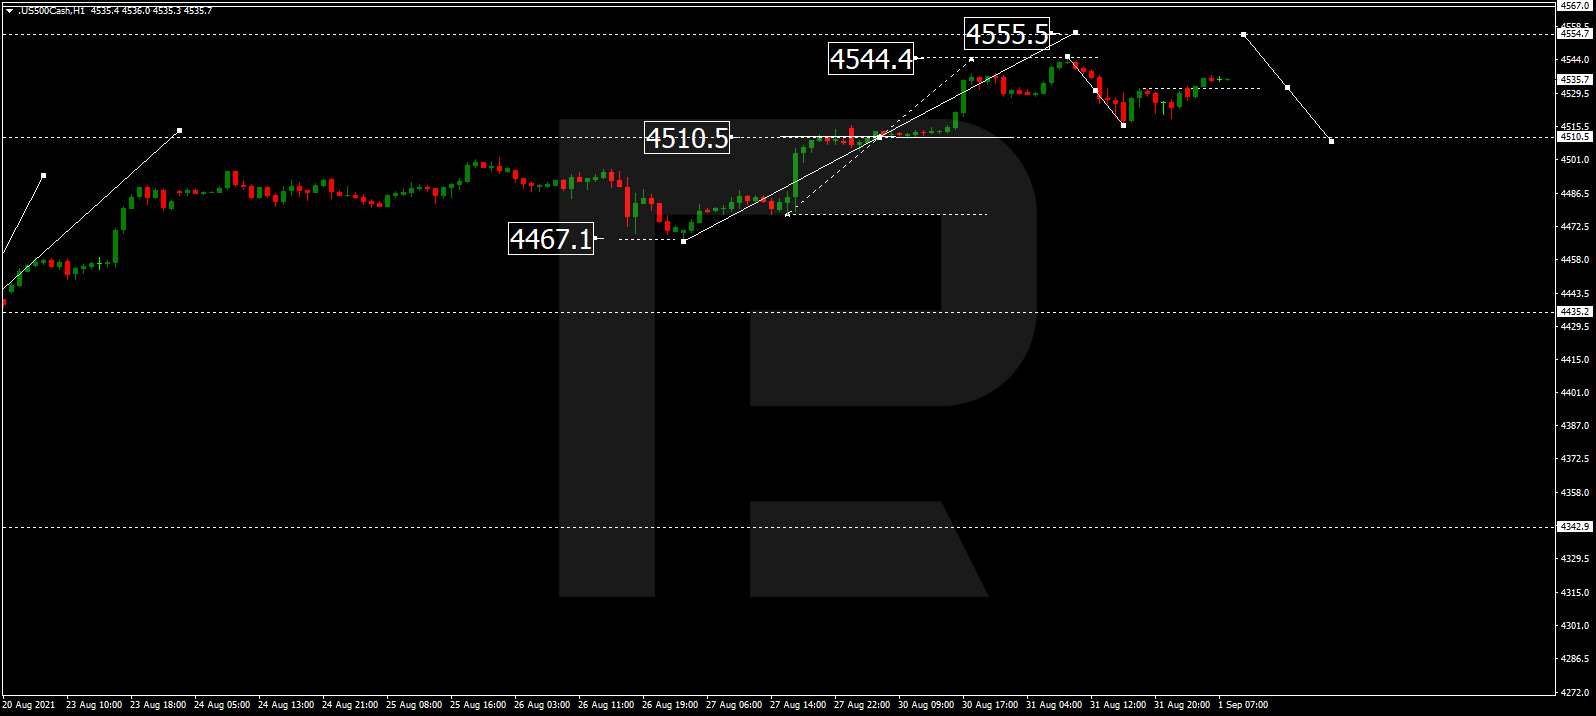
After finishing the correction at 4515.8, the S&P index is still growing towards 4555.5. After that, the instrument may form a new descending structure with the target at 4510.0.
S&P500

Article By RoboForex.com

Attention!
Forecasts presented in this section only reflect the author’s private opinion and should not be considered as guidance for trading. RoboForex LP bears no responsibility for trading results based on trading recommendations described in these analytical reviews.

Fibonacci Retracements Analysis 01.09.2021 (GBPUSD, EURJPY)

Article By RoboForex.com

GBPUSD, “Great Britain Pound vs US Dollar”

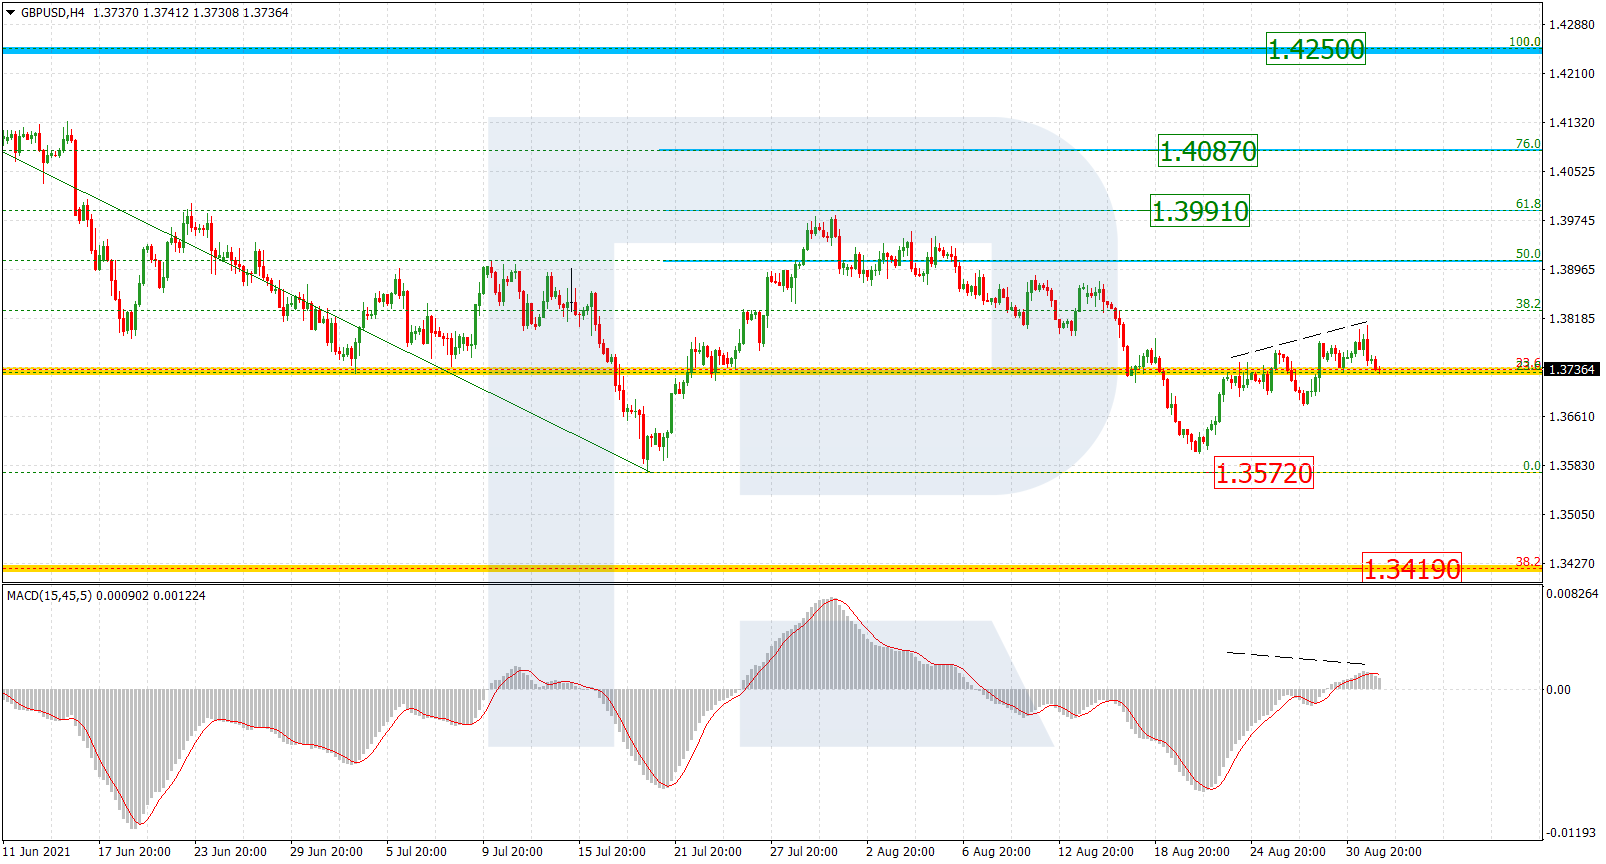
As we can see in the H4 chart, the current growth is slowing down. This technical picture implies that the asset may start a new descending wave. The first downside target will be the low at 1.3572, a breakout of which may lead to a further downtrend towards the mid-term 38.2% fibo at 1.3419. On the other hand, the price may rebound from the low and resume trading upwards to reach 61.8% and 76.0% fibo at 1.3991 and 1.4087 respectively.

GBPUSD_H4
Risk Warning: the result of previous trading operations do not guarantee the same results in the future

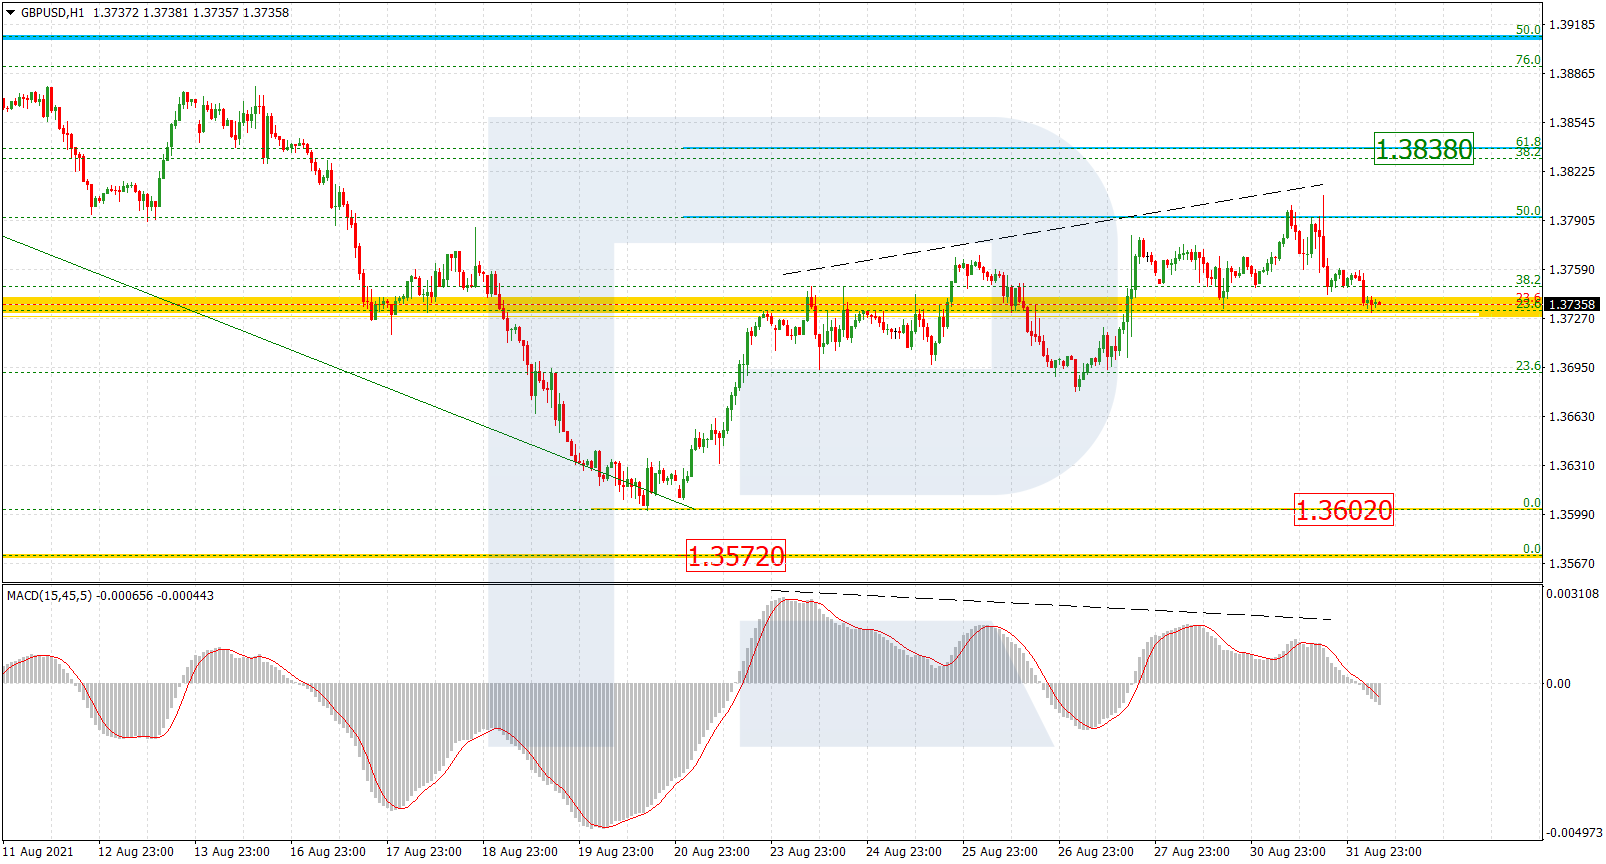
The H1 chart shows that after correcting upwards by 50.0%, the asset may continue growing to reach 61.8% fibo at 1.3838. At the same time, there is divergence on MACD may indicate a new short-term decline soon towards the local support at 1.3602.

GBPUSD_H1
Risk Warning: the result of previous trading operations do not guarantee the same results in the future

EURJPY, “Euro vs. Japanese Yen”

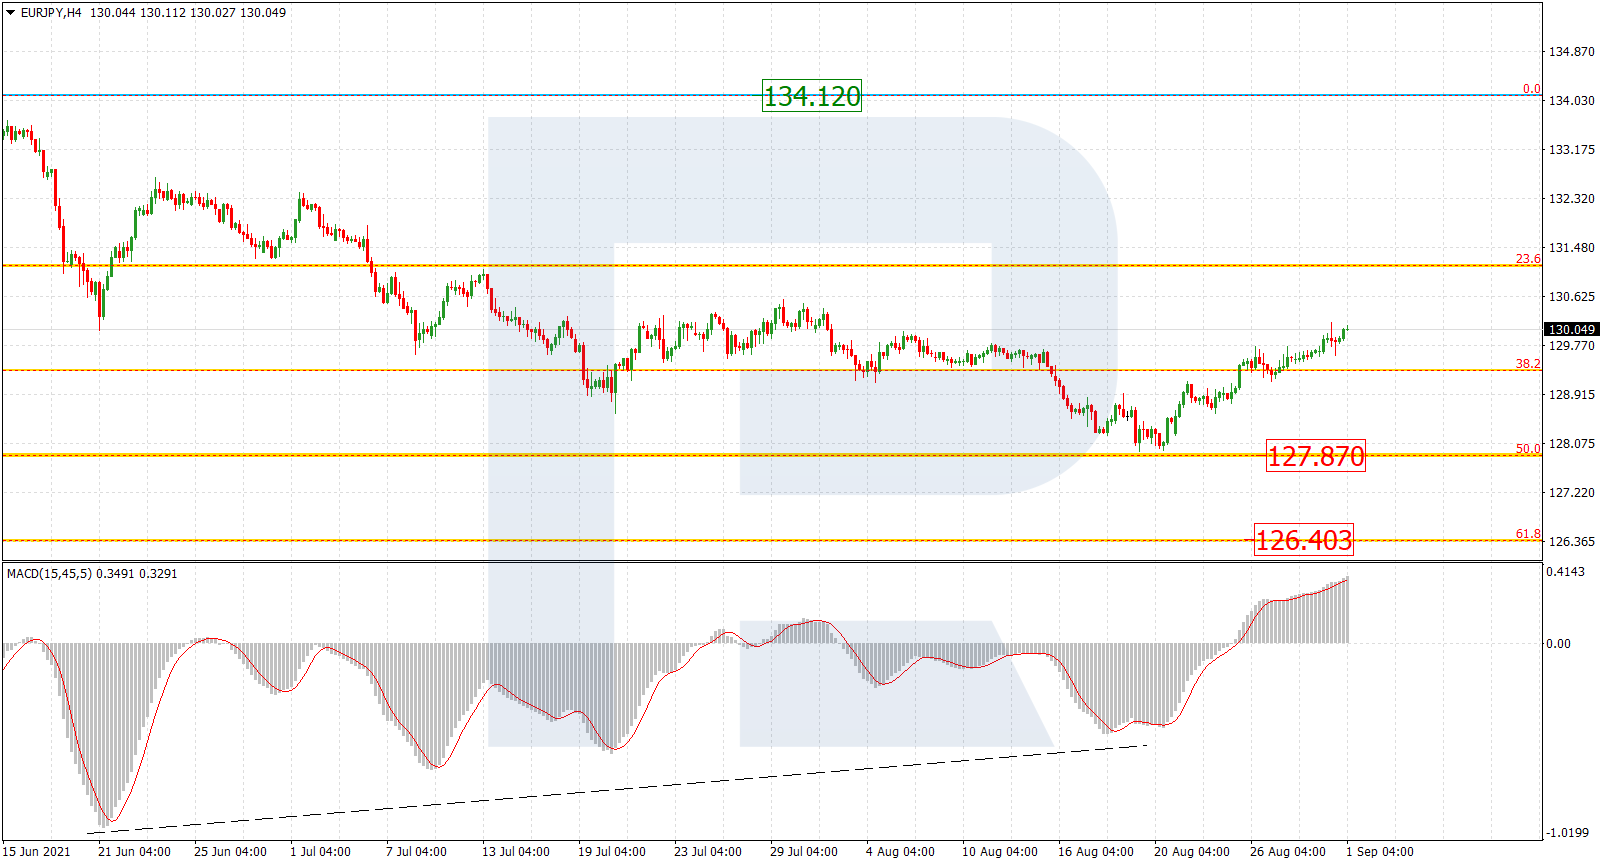
In the H4 chart, the asset is correcting upwards after a test of 50.0% fibo at 127.87 and convergence on MACD. After the pullback is over, the pair may resume falling towards the mid-term 61.8% fibo at 126.40. The resistance is the high at 134.12.

EURJPY_H4
Risk Warning: the result of previous trading operations do not guarantee the same results in the future

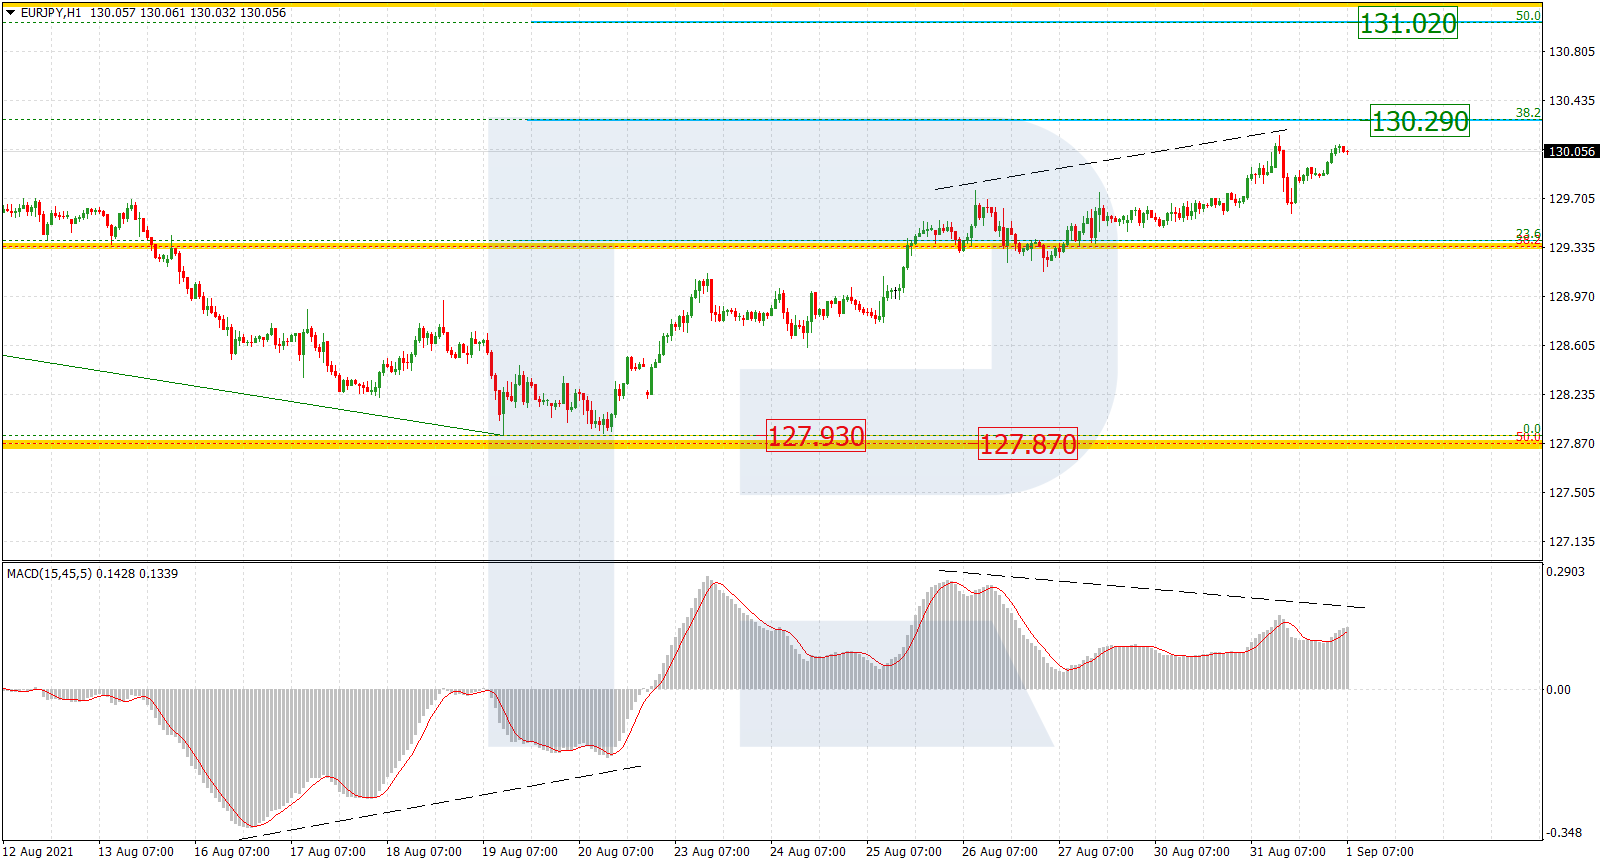
As we can see in the H1 chart, convergence on MACD made the asset start a new correctional uptrend towards 38.2% fibo at 130.29. The next upside target may be 50.0% fibo at 131.02. On the other hand, a breakout of the local low at 127.93 will lead to a further downtrend. Also, there might be divergence on MACD to indicate a new decline soon.

EURJPY_H1

Article By RoboForex.com

Attention!
Forecasts presented in this section only reflect the author’s private opinion and should not be considered as guidance for trading. RoboForex LP bears no responsibility for trading results based on trading recommendations described in these analytical reviews.
The Analytical Overview of the Main Currency Pairs on 2021.09.01

by JustForex

The EUR/USD currency pair

Technical indicators of the currency pair:
  • Prev Open: 1.1796
  • Prev Close: 1.1808
  • % chg. over the last day: +0.10%

The inflation rate in Europe increased to 3% on a year-on-year basis, which is much higher than the target indicator of the European Central Bank of 2%. The new ECB program implies some deviation from the target, but what kind of deviation is acceptable and what is not – it’s all up to the officials. Therefore, a 50% jump in prices might cause some concern for investors as the central bank might start taking action to suppress inflation.

Trading recommendations
  • Support levels: 1.1799, 1.1759, 1.1704, 1.1620
  • Resistance levels: 1.1817, 1.1854, 1.1894, 1.1934, 1.1969

From a technical point of view, the general trend of the EUR/USD currency pair is bearish. But the price is trading above the moving average and tried to break through the priority change level, but failed to consolidate higher. The MACD is signaling a divergence in the opposite direction. Under such market conditions, it is best to look for sell trades from the resistance levels, where sellers show initiative. Buy trades can be considered only after a pullback or after a breakthrough of the priority change level.

Alternative scenario: if the price breaks through the 1.1817 resistance level and fixes above, the mid-term uptrend will likely resume.

EUR/USD
News feed for 2021.09.01:
  • – Germany Manufacturing PMI (m/m) at 10:55 (GMT+3);
  • – Eurozone Manufacturing PMI (m/m) at 11:00 (GMT+3);
  • – Eurozone Unemployment Rate (m/m) at 12:00 (GMT+3);
  • – US ADP Non-Farm Employment Change (m/m) at 15:15 (GMT+3);
  • – US ISM Manufacturing PMI (m/m) at 17:00 (GMT+3).

The GBP/USD currency pair

Technical indicators of the currency pair:
  • Prev Open: 1.3759
  • Prev Close: 1.3755
  • % chg. over the last day: -0.03%

In July, The UK consumer credit did not increase for the first time since February, indicating a slowing recovery from the crisis. Business confidence reached a four-year high, but companies expressed concerns about staff shortages, which could eventually lead to wage increases in the coming months.

Trading recommendations
  • Support levels: 1.3741, 1.3692, 1.3632, 1.3614, 1.3525
  • Resistance levels: 1.3793, 1.3772, 1.3886, 1.3935, 1.4002

On the hourly time frame, the GBP/USD trend is bearish. The MACD indicator became negative. Under such market conditions, it is better to look for sell trades from the resistance level, where sellers show initiative. Buy positions can be considered only with short targets throughout the day.

Alternative scenario: if the price breaks through the 1.3885 resistance level and consolidates above, the bullish scenario will likely resume.

GBP/USD
News feed for 2021.09.01:
  • – UK Manufacturing PMI (m/m) at 11:30 (GMT+3).

The USD/JPY currency pair

Technical indicators of the currency pair:
  • Prev Open: 109.92
  • Prev Close: 109.98
  • % chg. over the last day: +0.05%

Japan is still struggling with an outbreak of infection. Many regions have suspended vaccination because of the problems with the Moderna vaccine. Moreover, a group of Japanese researchers have discovered a new mutation of the Delta strain. Japan’s economic situation is complicated before the election of a new prime minister.

Trading recommendations
  • Support levels: 110.11, 109.43, 109.19, 108.65
  • Resistance levels: 110.34, 110.66, 110.95, 111.48

The main trend of the USD/JPY currency pair is bullish. Due to the strengthening of the dollar index, the price managed to break above the flat structures yesterday. The MACD indicator has become positive. Under such market conditions, traders should look for buy trades from the support level, where the buyers show initiative. Sell positions should be considered only on the lower time frames from the resistance levels with short targets.

Alternative scenario: if the price falls below 109.18, the uptrend is likely to be broken.

USD/JPY
There is no news feed for today.

The USD/CAD currency pair

Technical indicators of the currency pair:
  • Prev Open: 1.2601
  • Prev Close: 1.2612
  • % chg. over the last day: +0.09%

Canada’s growth indicators data turned out to be disappointing: GDP unexpectedly decreased by 0.3% in the last quarter. The Canadian dollar is a commodity currency, so the USD/CAD currency pair is highly dependent on the dynamics of the dollar index and oil prices. Yesterday, the dollar index slightly strengthened, while oil remained at the same level. As a result, the USD/CAD currency pair restored it’s position.

Trading recommendations
  • Support levels: 1.2602, 1.2554
  • Resistance levels: 1.2656, 1.2713, 1.2812, 1.2891, 1.2951

In terms of technical analysis, the USD/CAD trend is still bullish. The price was testing the priority change level yesterday. But it couldn’t break through the level, and failed to consolidate below. A false breakdown zone was formed. It is better to look for buy positions from the priority change level where buyers show initiative. Sell positions can be considered from the resistance levels, or after the breakthrough of the 1.2602 support level.

Alternative scenario: if the price breaks through the 1.2602 support level and fixes below, the uptrend will likely be broken.

USD/CAD
News feed for 2021.09.01:
  • – Canada Manufacturing PMI (m/m) at 16:30 (GMT+3).

by JustForex


This article reflects a personal opinion and should not be interpreted as an investment advice, and/or offer, and/or a persistent request for carrying out financial transactions, and/or a guarantee, and/or a forecast of future events.

Inflation in the Eurozone increased to a ten-year high

by JustForex

Amid a temporary strengthening of the dollar index, major US stock indices declined yesterday. The Dow Jones index decreased by 0.11%, the S&P 500 index decreased by 0.13%, and the NASDAQ index lost 0.04% at the close of trading. 7 of the 11 sectors closed in the red zone. The technology and energy sectors declined most. But despite that, the S&P 500 index added almost 3% at the end of the month. It is the seventh month of growth in a row. And while the Fed is in no hurry to tighten its monetary policy, the rally is likely to continue. Investors’ attention is now focused on labor market data, which will be released later this week. The Federal Reserve relies on employment reports, so very good figures may provoke investors to start selling.

Amid the return of millions of employees from remote work to offices, shares of video conferencing service Zoom fell by more than 15% after the company signaled an earlier-than-expected decline in demand. Investors now expect the Q3 report period will not be so profitable as the previous ones.

European stock indices also showed negative dynamics on the last day of summer. The British FTSE 100 decreased by 0.4%, German DAX lost 0.3%, French CAC 40 decreased by 0.1%, Italian FTSE MIB and Spanish IBEX 35 decreased by 0.06% and 0.2% respectively. On the other hand, the FTSE 100 index showed its best month since April, while the European Stoxx 600 index grew for the seventh month in a row. The UK energy regulator has established a £450 million fund for innovative projects that will help the country reach its net-zero climate goals. Ryanair plans to transport more passengers this fall than it did in the summer, raising its plan for the next three months after restoring traffic. The inflation rate in Europe increased to 3% year-over-year, which is much higher than the target indicator of the European Central Bank of 2%. The new ECB program implies some deviation from the target, but what kind of deviation is acceptable and what is not is all at the discretion of officials.

It took nearly a month for gold to recover from a sharp drop in prices that had occurred at the beginning of August. At the end of the month, the price closed at +0.3%. And as far as the Fed puts off the cutting of the QE program, growth is likely to continue.

Aluminum reached its highest level in a decade due to high demand and concerns that China may cut production in an effort to reduce energy consumption and emissions.

According to the American Petroleum Institute, oil inventories fell by 4.045 million barrels last week, which was higher than analysts expected. Today, the OPEC+ meeting will be held, and the crude oil reserves data will be released. Volatility in oil prices will jump. Yesterday, Kuwait’s oil minister suggested that OPEC+ might decide to postpone plans of increasing production by 400,000 barrels per day. However, most analysts and refiners expect OPEC+ to stick to its plans to increase oil production gradually.

China’s recovery has slowed. The corporate growth has almost stopped, and the service sector is contracting. It is negatively affecting the dynamics of major Asian indices. Australia’s GDP increased by 0.7%, but economists are confident that we will witness more consequences of COVID-19 restrictions.

Main market quotes:

S&P 500 (F) 4,522.68 −6.11 (−0.13%)

Dow Jones 35,360.73 −39.11 (−0.11%)

DAX 15,835.09 −52.22 (−0.33%)

FTSE 100 7,119.70 −28.31 (−0.40%)

USD Index 92.66 +0.11 (+0.12%)

Important events for today:
  • – Australia GDP (q/q) at 04:30 (GMT+3);
  • – Germany Manufacturing PMI (m/m) at 10:55 (GMT+3);
  • – Eurozone Manufacturing PMI (m/m) at 11:00 (GMT+3);
  • – UK Manufacturing PMI (m/m) at 11:30 (GMT+3);
  • – Eurozone Unemployment Rate (m/m) at 12:00 (GMT+3);
  • – US ADP Non-Farm Employment Change (m/m) at 15:15 (GMT+3);
  • – Canada Manufacturing PMI (m/m) at 16:30 (GMT+3);
  • – US ISM Manufacturing PMI (m/m) at 17:00 (GMT+3);
  • – US Crude Oil Reserves (w/w) at 17:30 (GMT+3);
  • – OPEC+ Meetings (All day).

by JustForex


This article reflects a personal opinion and should not be interpreted as an investment advice, and/or offer, and/or a persistent request for carrying out financial transactions, and/or a guarantee, and/or a forecast of future events.

EURUSD Could Have Reversed

By Orbex

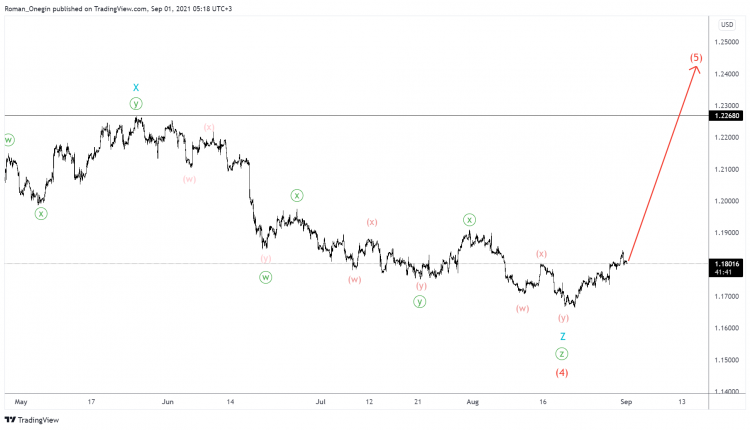
Analysts expect the EURUSD pair to ascend as part of its final 5th wave.

Following the completion of intermediate wave (4) as a triple zigzag, the 5-wave move might consist of minor sub-waves 1-2-3-4-5.

Currently, the market is showing a biased upwards move, forming wave 1.

In the medium-term traders can look for resistance at 1.2268. Intervening wave X marked these levels.

EURUSD

A triple zigzag within the triple zigzag makes a probable alternative to the scenario above.

This type of combination would become part of the second actionary wave of the triple zigzag. This would bring the final intervening wave ⓧ within the minor wave Z.

To complete Z, we can expect a minuette simple (or double) zigzag.

The zigzag could have the pair decline toward 1.1403. At that level, minor wave Z will be at 161.8% of wave Y.

By Orbex

Intraday Market Analysis – USD Sees Limited Rebound

By Orbex

EURUSD continues to recover

EURUSD

The US dollar continues to soften from weaker-than-expected consumer sentiment in August.

The euro bulls gained confidence after the single currency rallied above 1.1800, an important supply zone from the mid-August sell-off. Now, this has turned into an area of congestion along a rising trendline. Furthermore, it is a clear indication of a bullish bias in the short term.

However, an overbought RSI may lead to a limited pullback. A bounce off 1.1795 would propel the pair to the daily resistance at 1.1900.

USDCAD struggles for support

USDCAD

The Canadian dollar stalled after the Q2 GDP fell short of expectations. The US counterpart is testing the 30-day moving average and last week’s rebound failed to make an impression.

The fall below 1.2580 suggests a lack of buying interest. 1.2500 on the daily chart is a critical floor. A deeper retracement would put buyers on the defense with 1.2300 as a potential target.

On the upside, buyers will need to rack up offers at 1.2700 before they could hope for a second chance. Then 1.2900 would be within reach.

AUDUSD rises to major resistance

AUDUSD

The Australian dollar edges higher on upbeat Q2 GDP. The pair continues to recover along a rising trendline after it bounced back from the daily demand area near 0.7100.

The bullish pace accelerated after the first resistance at 0.7170 was lifted. Buyers are pushing towards the major hurdle at 0.7400 from the daily time frame.

A bullish breakout may trigger a runaway rally as medium-term sellers cover their positions. That in turn could end a three-month correction. 0.7290 is fresh support to let the RSI return to neutrality.

By Orbex

RoboForex Rewarded for the Best Investment Products in 2021

August 31, 2021

Belize City, Belize

RoboForex, an international broker, has become the winner of Global Brands Magazine Awards in the nomination “Best Investment Products – Global” for the third year in a row. Earlier, Global Brands Magazine Awards organizers already rewarded RoboForex for the best investment products in 2019 and 2020.

Global Brands Awards was established to honour companies, which demonstrate outstanding results in different business areas. The organizing committee gives awards to the most successful representatives in the spheres of finance, education, tourism, lifestyle, technology, and the car industry.

Applications are accepted from companies from different countries and regions throughout the year in a wide range of categories. The nominations received on a corresponding national level are estimated by an independent research agency. After that, the nominees that made the final cut are evaluated by a competent jury of the event organizers, which decide the winners based on the objective data.

Robert Stephenson, Chief Business Officer at RoboForex, is commenting: “We at RoboForex put a lot of attention to the development of our investment products, which help our clients to increase their trading potential. CopyFX, an investment platform we created, is unique in many respects and helps clients to invest considering their knowledge and acceptable risk and profitability levels, as well as earn from successful trading and commissions received for the transactions copied by their subscribers. This award both indicates that the direction we chose is successful and provides an incentive for further development.”

About Global Brands Magazine

Global Brands Magazine ranks among leading online media, which publishes the latest news, reviews, opinions, and surveys on top global brands in different market segments. The magazine’s headquarter is located in the United Kingdom. Global Brands Awards presents its awards to the best companies, which have obvious advantages over their competitors due to the provision of high-quality services to clients.

About RoboForex

RoboForex is a company, which delivers brokerage services. The broker provides traders, who work on financial markets, with access to its proprietary trading platforms. RoboForex has the brokerage license IFSC 000138/210. More detailed information about the company’s activities and operations can be found on the official website at roboforex.com.

USDCHF Zigzag Could Print Fresh Highs

By Orbex

The current USDCHF formation hints at a double zigzag Ⓦ-Ⓧ-Ⓨ in cycle wave y. Currently, the last primary wave Ⓨ is under development.

Due to its complex internal structure, it will most likely take the form of a double combination (W)-(X)-(Y). If waves (W) and (X) have been completed already, then wave (Y) could provide a bullish opportunity.

Analysts expect the end of wave (Y) near 0.947. At that level, cycle wave y will be at 76.4% of wave w.

USDCHF

However, the primary wave Ⓧ may not be fully completed yet. In that case, probabilities suggest that it could take the formation of a double three (W)-(X)-(Y) pattern.

With two-thirds of the structure in wave (Y) completed, we could see prices move in wave C towards the 0.901 area. At that level, primary wave Ⓧ will be at 76.4% of wave Ⓦ.

By Orbex

Ichimoku Cloud Analysis 31.08.2021 (EURUSD, AUDUSD, USDCAD)

Article By RoboForex.com

EURUSD, “Euro vs US Dollar”

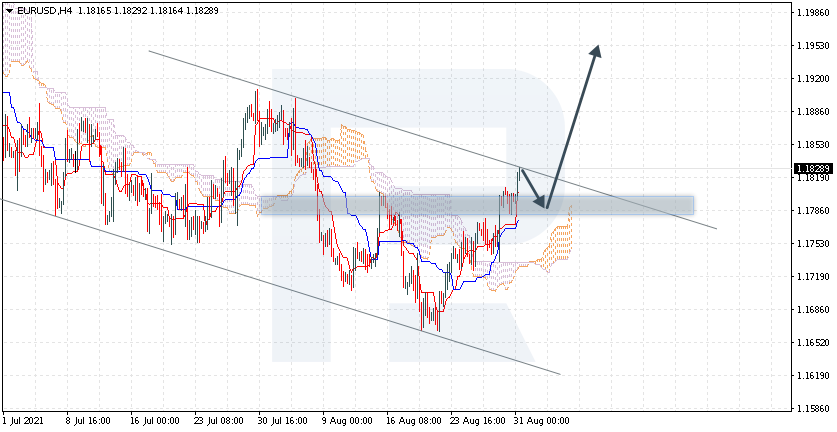
EURUSD is trading at 1.1828; the instrument is moving above Ichimoku Cloud, thus indicating an ascending tendency. The markets could indicate that the price may test Tenkan-Sen and Kijun-Sen at 1.1790 and then resume moving upwards to reach 1.1955. Another signal in favor of a further uptrend will be a rebound from the support level. However, the bullish scenario may be cancelled if the price breaks the cloud’s downside border and fixes below 1.1680. In this case, the pair may continue falling towards 1.1585. To confirm further growth, the asset must break the descending channel’s upside border and fix above 1.1845.

EURUSD
Risk Warning: the result of previous trading operations do not guarantee the same results in the future

AUDUSD, “Australian Dollar vs US Dollar”

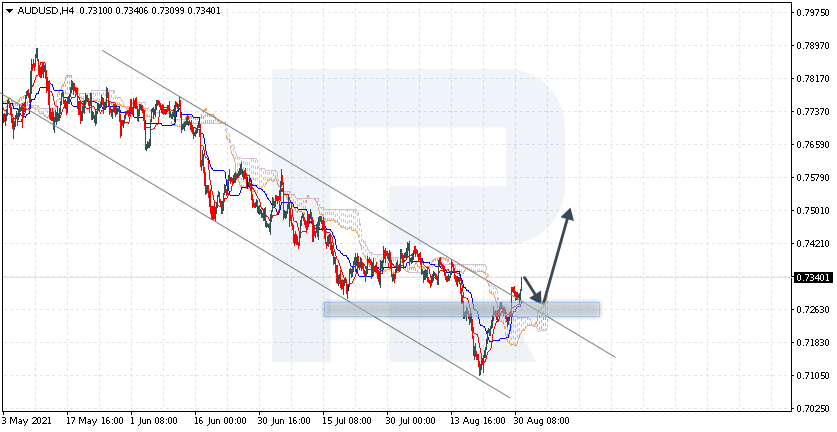
AUDUSD is trading at 0.7340; the instrument is moving above Ichimoku Cloud, thus indicating an ascending tendency. The markets could indicate that the price may test the cloud’s upside border at 0.7265 and then resume moving upwards to reach 0.7505. Another signal in favor of a further uptrend will be a rebound from the support level. However, the bullish scenario may no longer be valid if the price breaks the cloud’s downside border and fixes below 0.7175. In this case, the pair may continue falling towards 0.7085.

AUDUSD
Risk Warning: the result of previous trading operations do not guarantee the same results in the future

USDCAD, “US Dollar vs Canadian Dollar”

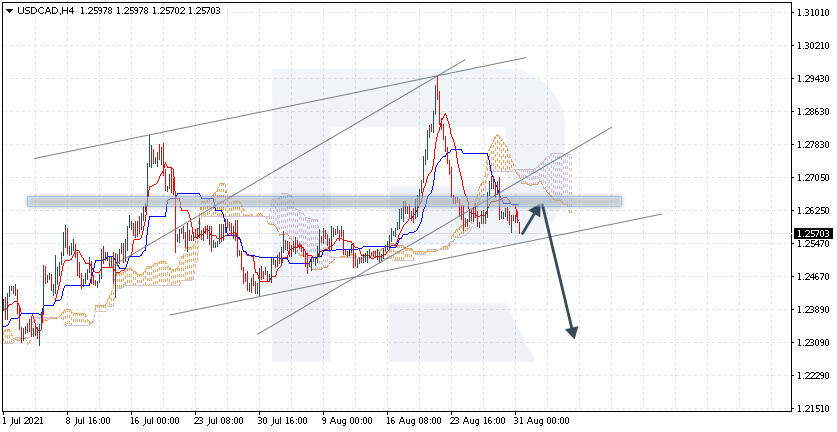
USDCAD is trading at 1.2570; the instrument is moving below Ichimoku Cloud, thus indicating a descending tendency. The markets could indicate that the price may test Tenkan-Sen and Kijun-Sen at 1.2625 and then resume moving downwards to reach 1.2310. Another signal in favor of a further downtrend will be a rebound from the resistance level. However, the bearish scenario may no longer be valid if the price breaks the cloud’s upside border and fixes above 1.2805. In this case, the pair may continue growing towards 1.2905. To confirm further decline, the asset must break the rising channel’s downside border and fix below 1.2525.

USDCAD

Article By RoboForex.com

Attention!
Forecasts presented in this section only reflect the author’s private opinion and should not be considered as guidance for trading. RoboForex LP bears no responsibility for trading results based on trading recommendations described in these analytical reviews.
Forex Technical Analysis & Forecast 31.08.2021

Article By RoboForex.com

EURUSD, “Euro vs US Dollar”

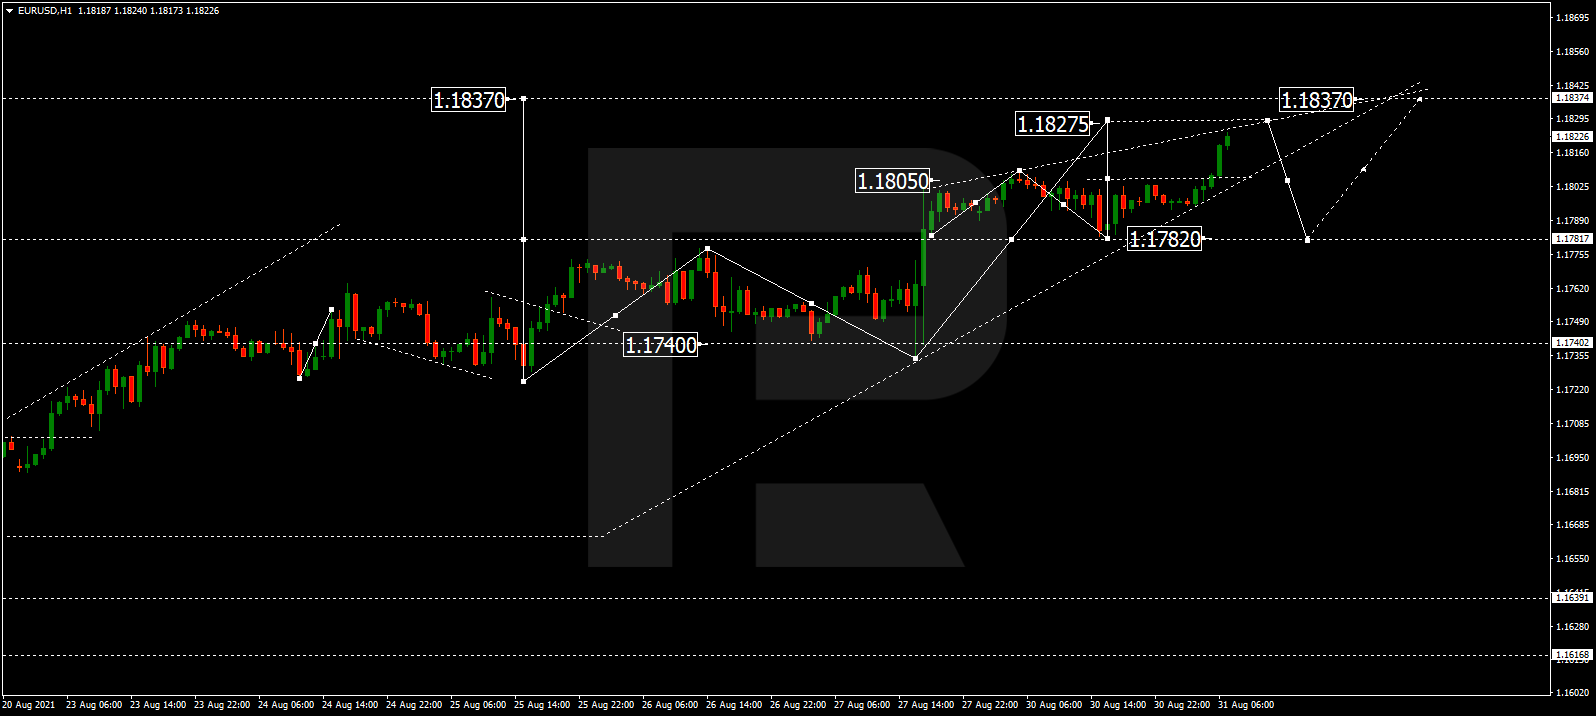
After forming a new consolidation range below 1.1805 and breaking it to the upside, EURUSD continues trading upwards. Possibly, today the pair may reach 1.1827 or even extend this structure up to 1.1837. Later, the market may form one more consolidation range. If the price breaks this range to the downside, the instrument may start a new correction with the target at 1.1750.

EURUSD
Risk Warning: the result of previous trading operations do not guarantee the same results in the future

GBPUSD, “Great Britain Pound vs US Dollar”

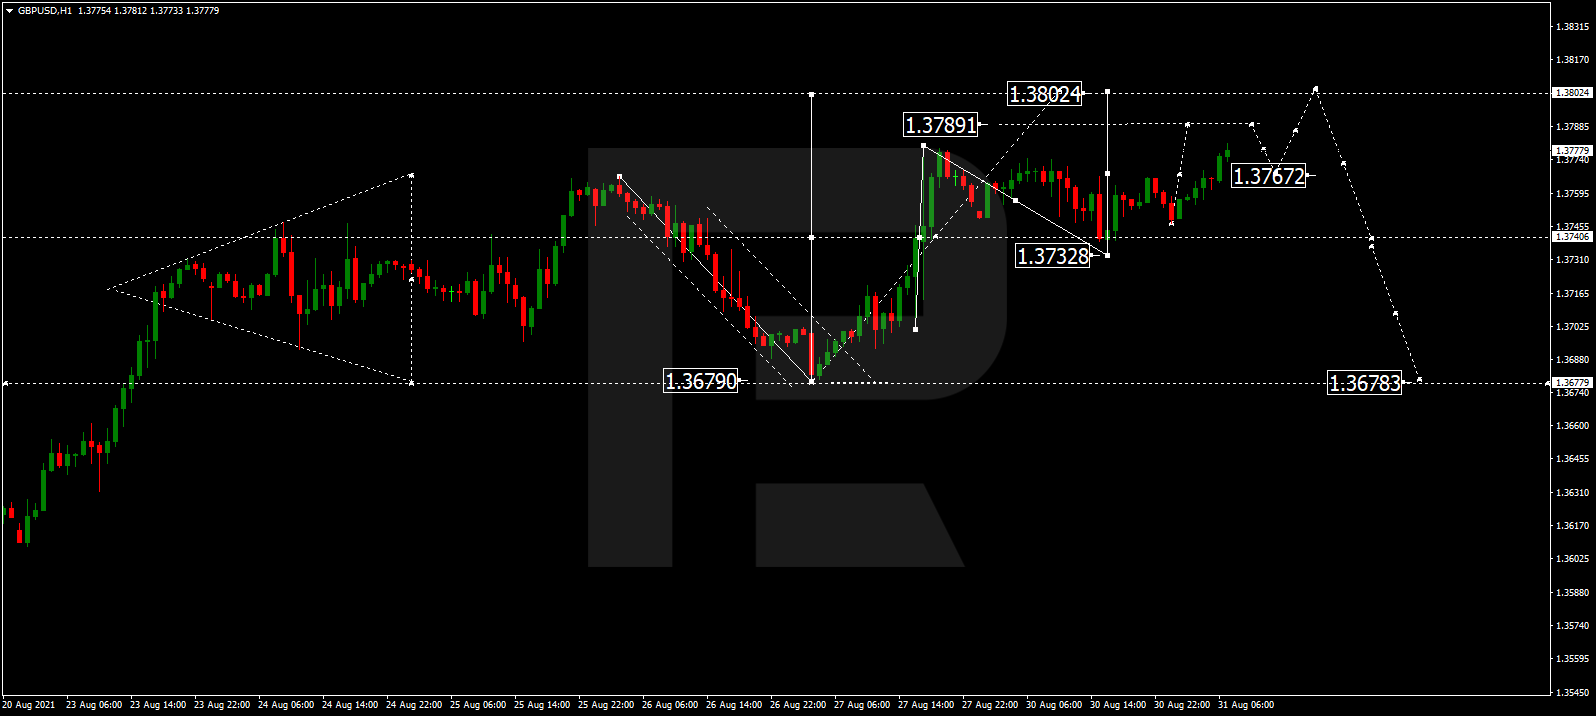
After rebounding from 1.3733 and breaking 1.3760, GBPUSD is expected to expand the consolidation range up to 1.3802. After that, the instrument may start another decline to break 1.3733 and then continue trading downwards with the target at 1.3678.

GBPUSD
Risk Warning: the result of previous trading operations do not guarantee the same results in the future

USDRUB, “US Dollar vs Russian Ruble”

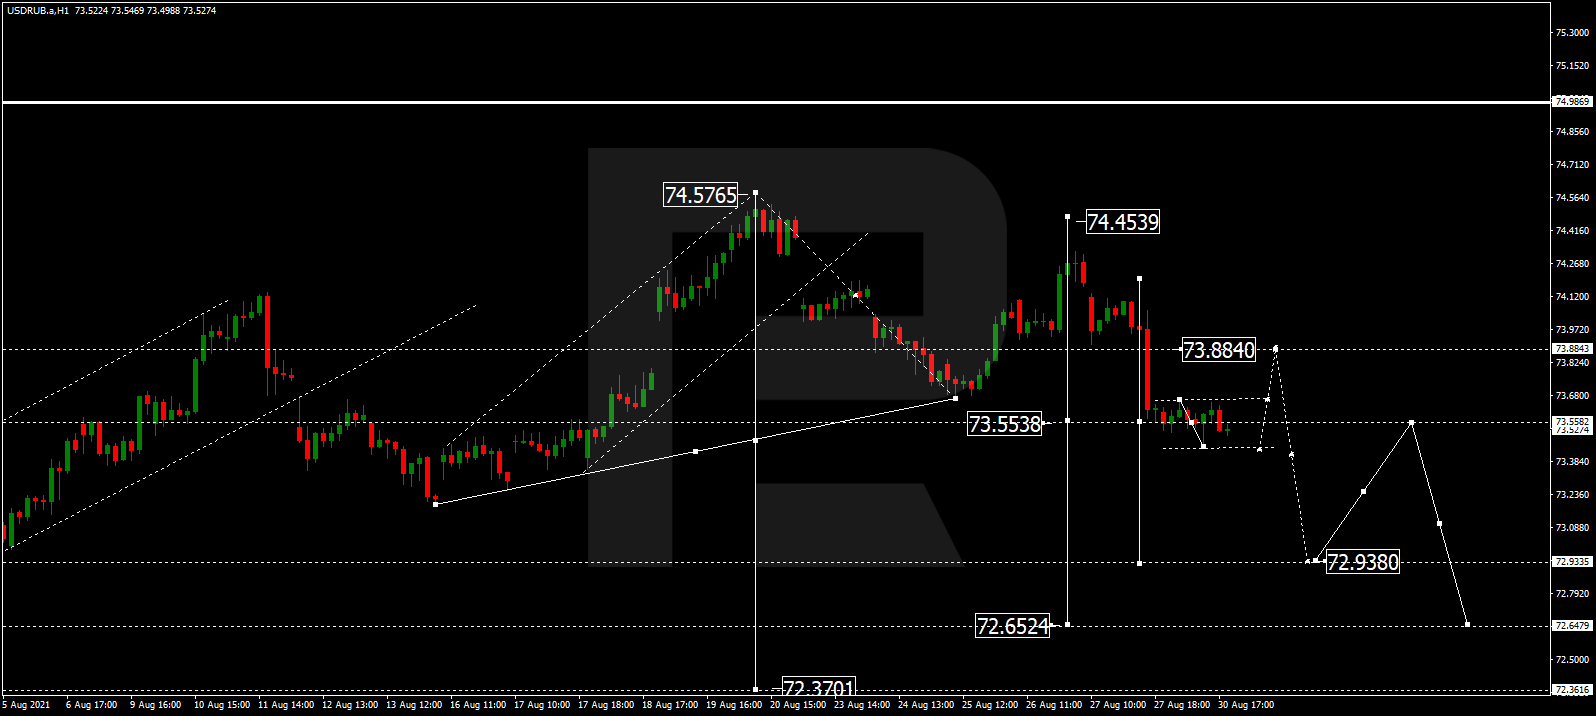
USDRUB has formed a new consolidation range around 73.55. Today, the pair may fall to break 73.33 and then continue trading downwards with the short-term target at 72.93.

USDRUB
Risk Warning: the result of previous trading operations do not guarantee the same results in the future

USDJPY, “US Dollar vs Japanese Yen”

USDJPY is still consolidating around 109.80. Possibly, today the pair may form a new descending structure to break 109.47 and then continue moving within the downtrend with the short-term target at 108.80.

USDJPY
Risk Warning: the result of previous trading operations do not guarantee the same results in the future

USDCHF, “US Dollar vs Swiss Franc”

After finishing the ascending impulse at 0.9184, USDCHF is correcting towards 0.9135. After that, the instrument may form one more ascending structure to break 0.9200 and then continue trading upwards with the target at 0.9250.

USDCHF
Risk Warning: the result of previous trading operations do not guarantee the same results in the future

AUDUSD, “Australian Dollar vs US Dollar”

AUDUSD is growing towards 0.7335 and may later start a new decline to reach 0.7218. After that, the instrument may grow towards 0.7280 and consolidate there. If the price breaks this range to the downside, the market may resume trading within the downtrend with the target at 0.7070.

AUDUSD
Risk Warning: the result of previous trading operations do not guarantee the same results in the future

BRENT

After rebounding from 72.00, Brent is growing towards 73.33. Later, the market may form a new descending structure to break 72.00 and then correct with the target at 70.25. After that, the instrument may start another growth to reach 75.55.

BRENT
Risk Warning: the result of previous trading operations do not guarantee the same results in the future

XAUUSD, “Gold vs US Dollar”

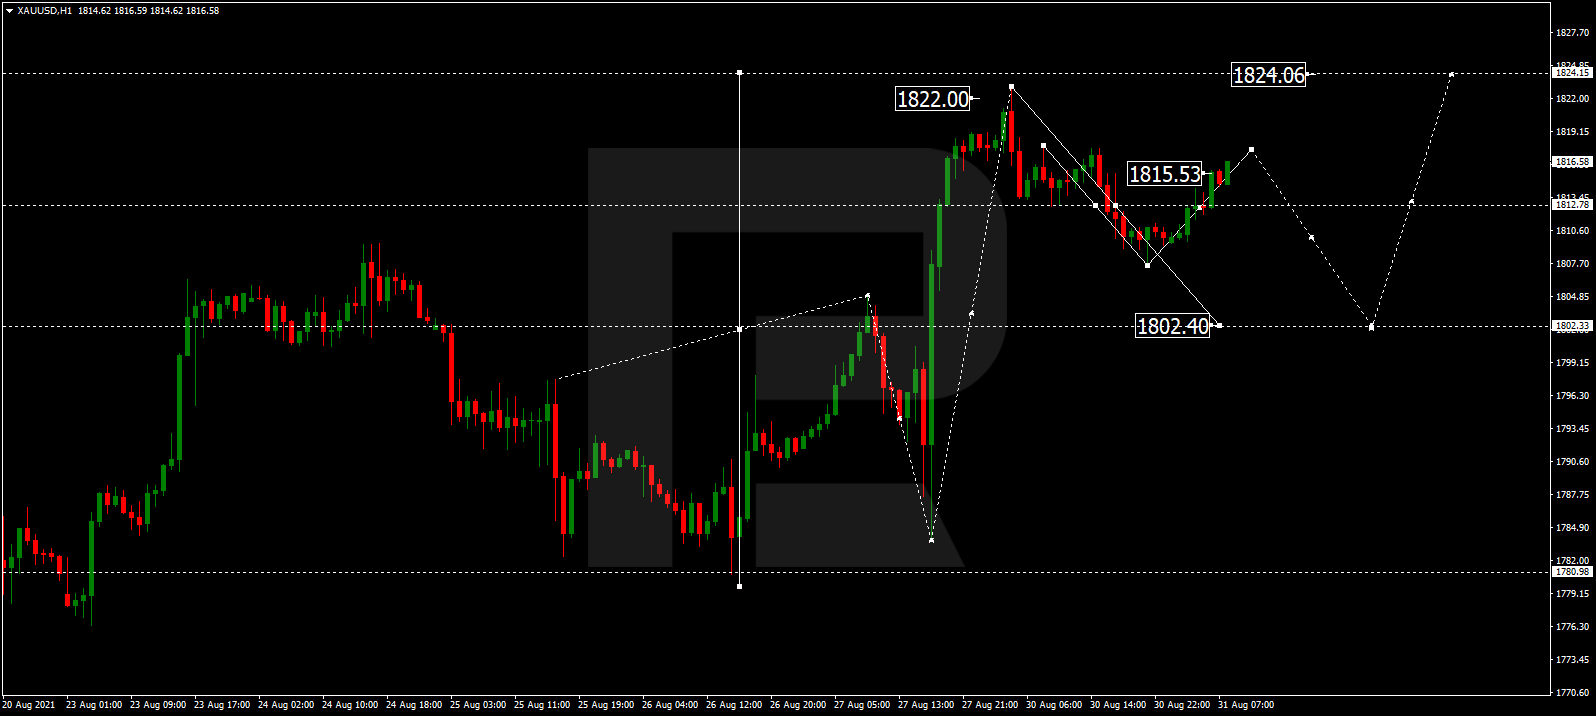
Gold is consolidating around 1812.66. Possibly, today the metal may correct to test 1802.40 from above and then resume trading upwards with the target at 1824.00.

GOLD
Risk Warning: the result of previous trading operations do not guarantee the same results in the future

S&P 500

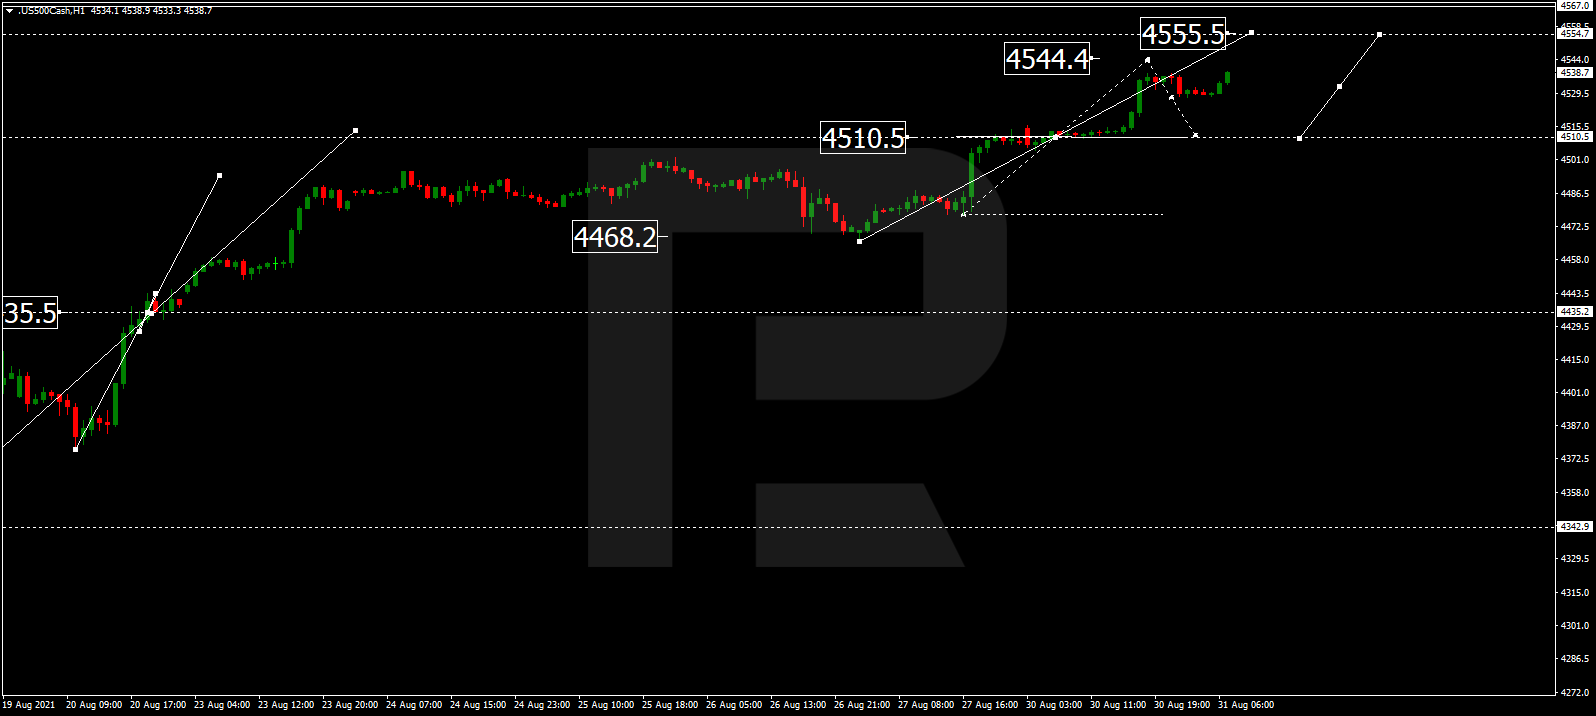
The S&P index is growing towards 4544.4 and may later start a new correction to reach 4510.5. After that, the instrument may form one more ascending structure towards 4555.5 and consolidate there. If the price breaks this range to the downside, the asset may start another correction with the target at 4435.0.

S&P500

Article By RoboForex.com

Attention!
Forecasts presented in this section only reflect the author’s private opinion and should not be considered as guidance for trading. RoboForex LP bears no responsibility for trading results based on trading recommendations described in these analytical reviews.