Archive for Forex and Currency News – Page 230

Intraday Market Analysis – GBP Extends Rally

By Orbex

GBPUSD rises to daily resistance

GBPUSD

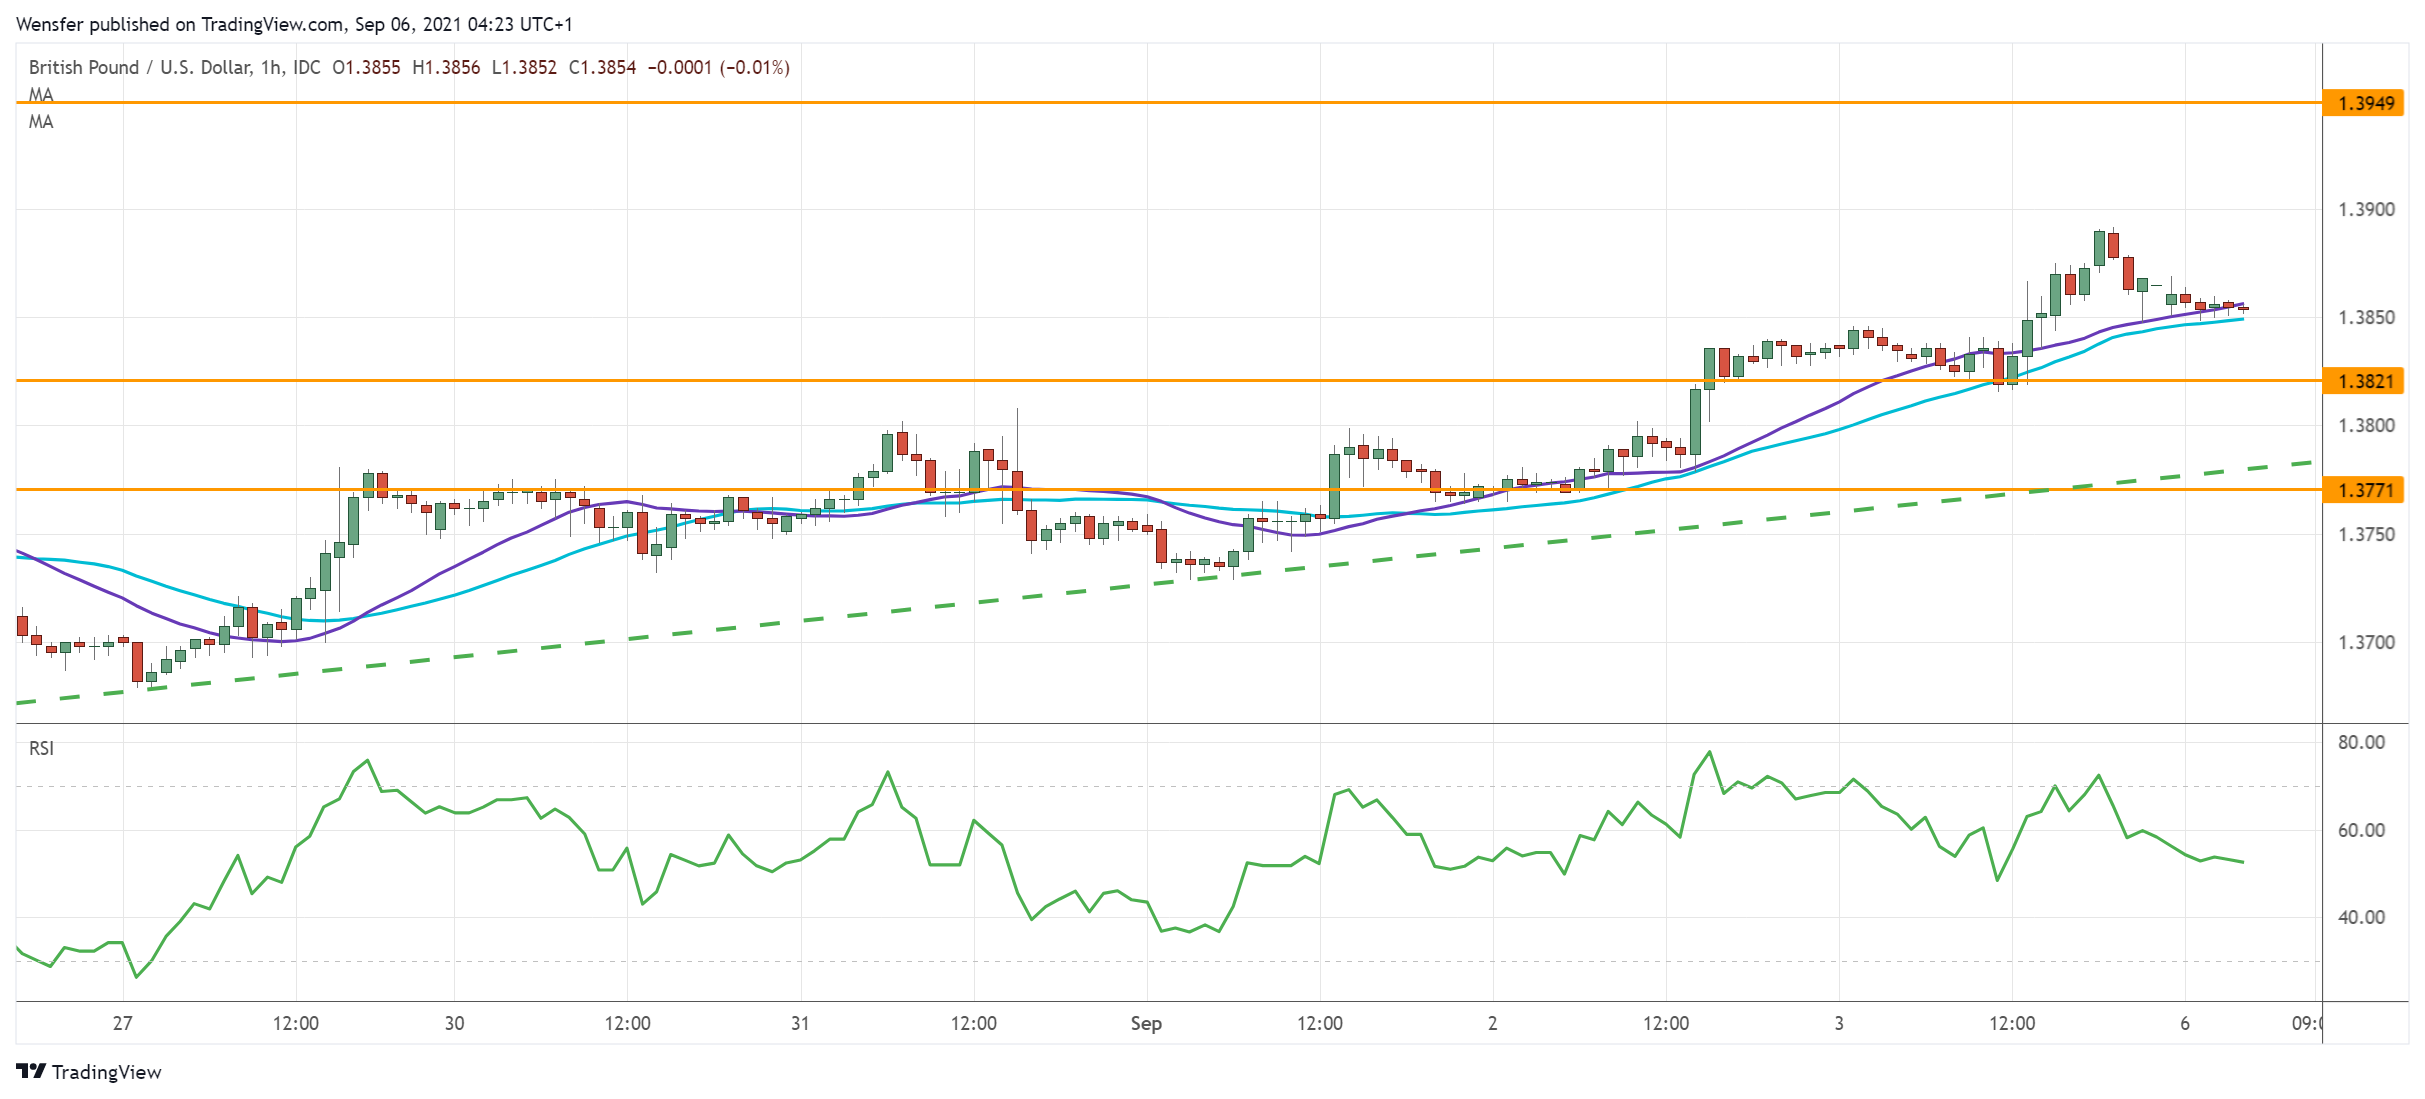
The US dollar tumbled after a worse-than-expected jobs report.

The pound had held well above the former resistance level of 1.3780. The long side gained confidence while the short side gave up.

Sentiment will remain upbeat as long as the rising trendline is intact. A close above 1.3950 may propel the price to the psychological level of 1.4000, which lies within a supply area on the daily chart.

However, a repeatedly overbought RSI may trigger a pullback. 1.3820 would be the first support in that case.

XAUUSD tests key hurdle

XAUUSD

Gold rose after lackluster nonfarm payrolls weighed on the US dollar. The precious metal has seen strong buying interest around the psychological level of 1800.

A bullish candle above 1832, the origin of the August sell-off would prompt sellers to reverse their bets, exacerbating the momentum in the process. Now that the major resistance withdrew, the bulls may have gained a free pass towards 1900.

As the RSI inches further into the overbought zone, 1811 is fresh support in case of a pullback.

GER 30 extends consolidation

DE30

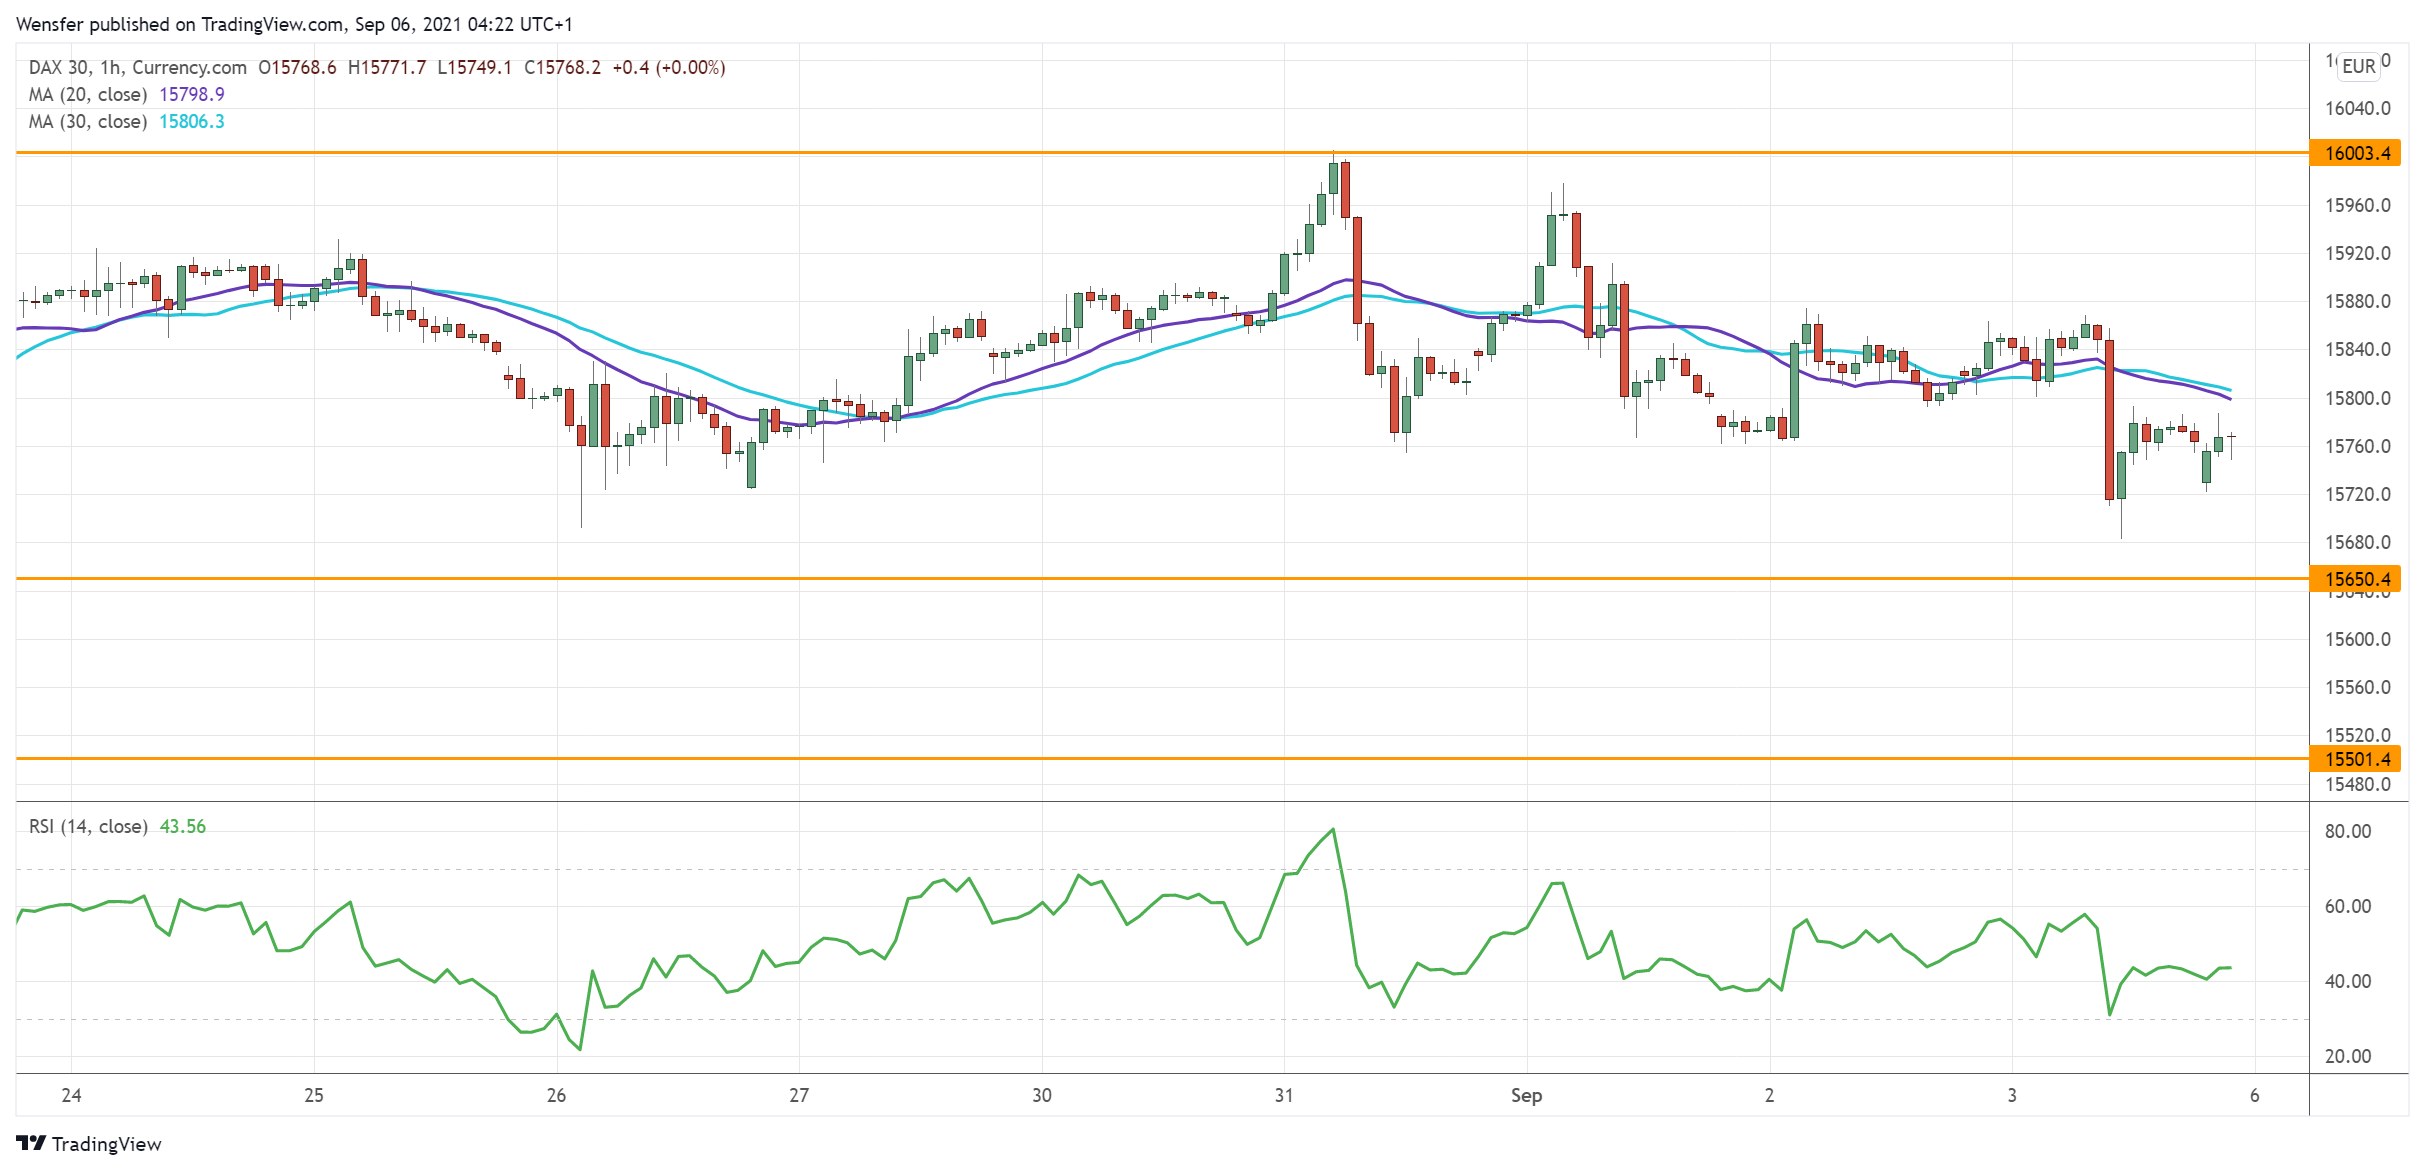
Improved risk sentiment post-NFP continues to support the Dax 30. The index is grinding the 30-day moving average as the bulls consolidate their gains near the record high.

16000 has become a key hurdle as high valuation makes buyers think twice before committing more chips. Though layers of support indicate an upward bias and may offer some peace of mind.

A bullish breakout would trigger an extended rally when momentum traders join the party. A fall below 15650 would prolong the sideways action to 15500.


Orbex-LogoArticle by Orbex

Orbex is a fully licensed broker that was established in 2011. Founded with a mission to serve its traders responsibly and provides traders with access to the world’s largest and most liquid financial markets. www.orbex.com

Nothing supports the “greenback”. Overview for 06.09.2021

Article By RoboForex.com

EURUSD is stable after Friday’s statistics on the US labour market.

The major currency pair is looking neutral early in the week. The current quote for the instrument is 1.1863.

The Unemployment Rate in the USA dropped to 5.2% in August, the same as expected, after being 5.4% in the previous month. The Average Hourly Earnings added 0.6% m/m after expanding by 0.4% m/m in July and against the expected reading of 0.3% m/m.

The Non-Farm Employment Change showed 235K, which is significantly worse than the expected reading of 720K. The July reading was revised upwards and showed 1.053M.

The demand for service dropped in August due to an increasing spread of the coronavirus disease and it influenced the number of new jobs. At the same time, the impulse on the labour market was strong enough to support the average growth in the country.

Some experts are sure that the employee pool might increase after schools and other educational facilities get back to their normal life. However, the existence of the delta strain and the speed at which it is spreading may prevent some categories of unemployed from getting back to work.

Of course, the global pandemic made the US labour market situation significantly change. It does not necessarily mean that weak numbers will make the US Federal Reserve System revise its plans relating to the reduction of the QE program this year. However, never say never.

Article By RoboForex.com

Attention!
Forecasts presented in this section only reflect the author’s private opinion and should not be considered as guidance for trading. RoboForex LP bears no responsibility for trading results based on trading recommendations described in these analytical reviews.

The Analytical Overview of the Main Currency Pairs on 2021.09.06

by JustForex

The EUR/USD currency pair

Technical indicators of the currency pair:
  • Prev Open: 1.1874
  • Prev Close: 1.1878
  • % chg. over the last day: +0.03%

Despite the decline in the dollar index, the EUR/USD currency pair remained at about the same level by the end of the day on Friday. The European currency is under pressure since some ECB officials began calling for a reduction in the QE program after last week’s poor inflation data. The ECB meeting on monetary policy will be held on Wednesday, so no strong growth in quotes should be expected before that time.

Trading recommendations
  • Support levels: 1.1854, 1.1816, 1.1799, 1.1759, 1.1704, 1.1620
  • Resistance levels: 1.1894, 1.1934, 1.1969

From a technical point of view, the general trend of the EUR/USD currency pair is bullish. The price broke through the priority change level and consolidated above. The MACD indicator is still signaling a divergence in the opposite direction. The price has deviated from the moving average; given the divergence, there is an increasing probability of a corrective downward movement. Under such market conditions, it is best to look for sell trades from the resistance levels, where sellers show initiative. Buy trades can be considered only after a pullback to the support levels near the moving average.

Alternative scenario: if the price breaks through the 1.1704 support level and fixes below, the mid-term uptrend will likely be broken.

EUR/USD
There is no news feed for today.

The GBP/USD currency pair

Technical indicators of the currency pair:
  • Prev Open: 1.3832
  • Prev Close: 1.3843
  • % chg. over the last day: +0.08%

The British pound is also getting stronger against the background of the dollar index decline. However, statistical data from the industrial and service sectors showed a slowdown in the recovery, which will have a negative impact on the national currency as well.

Trading recommendations
  • Support levels: 1.3793, 1.3741, 1.3692, 1.3632, 1.3614, 1.3525
  • Resistance levels: 1.3886, 1.3935, 1.4002

On the hourly time frame, the GBP/USD trend is bullish. The price broke through the priority change level on the impulsive movement and consolidated higher. The MACD indicator is in the positive zone, and there are the first signs of divergence on higher time frames. Under such market conditions, it is better to look for buy trades from the support levels after the price pullback as the price has now strongly deviated from the moving average. Sell positions can only be considered from the resistance levels with short targets throughout the day.

Alternative scenario: if the price breaks through the 1.3692 support level and consolidates below, the bearish scenario will likely resume.

GBP/USD
There is no news feed for today.

The USD/JPY currency pair

Technical indicators of the currency pair:
  • Prev Open: 109.91
  • Prev Close: 109.68
  • % chg. over the last day: -0.21%

The USD/JPY currency pair is highly dependent on the dynamics of the dollar index now. The dollar index is declining, which leads to a decrease in the USD/JPY quotes. Japan will report GDP data for the last quarter this week and many economists are predicting stronger economic growth than it has been initially reported. On Friday, Japanese Prime Minister Yoshihide Suga announced that he will resign, setting the stage for a new prime minister afterward. This news not only strengthened the Japanese currency but also Japan’s main index, the Nikkei 225.

Trading recommendations
  • Support levels: 109.43, 109.19, 108.65
  • Resistance levels: 109.88, 110.11, 110.34, 110.66, 110.95, 111.48

The main trend of the USD/JPY currency pair is bullish. Now the price is trading in a wide corridor, but there are signs of sellers’ pressure. The MACD indicator has become negative. Under such market conditions, traders should look for buy trades from the support level, where buyers show initiative. Sell positions should be considered only on the lower time frames from the positions where sellers show initiative.

Alternative scenario: if the price falls below 109.43, the uptrend is likely to be broken.

USD/JPY
There is no news feed for today.

The USD/CAD currency pair

Technical indicators of the currency pair:
  • Prev Open: 1.2550
  • Prev Close: 1.2518
  • % chg. over the last day: -0.26%

The Canadian dollar is a commodity currency, so the USD/CAD currency pair is highly dependent on the dynamics of the dollar index and oil prices. The dollar index has been decreasing during the last week, while oil prices have been growing. As a result, the USD/CAD currency pair is now decreasing due to the strengthening of the Canadian dollar.

Trading recommendations
  • Support levels: 1.2518, 1.2425
  • Resistance levels: 1.2583, 1.2656, 1.2713, 1.2812, 1.2891, 1.2951

In terms of technical analysis, the trend on the USD/CAD currency pair has changed to bearish. The price broke through the priority change level on the impulsive movement and consolidated below. It is better to consider sell positions from the resistance levels, where sellers show initiative. Buy positions can be considered from the support levels after additional confirmation in the form of buyers’ initiative.

Alternative scenario: if the price breaks through the 1.2812 resistance level and fixes above, the uptrend will likely resume.

USD/CAD
There is no news feed for today.

by JustForex


This article reflects a personal opinion and should not be interpreted as an investment advice, and/or offer, and/or a persistent request for carrying out financial transactions, and/or a guarantee, and/or a forecast of future events.

The dollar index declines amid weak labor market statistics

by JustForex

Last week investors’ attention was focused on Non-Farm Payrolls data. The labor market statistics were disappointing. The US economy added only 235,000 jobs in August (vs. 733,000 expected). This is a very sharp slowdown in the labor market. The main reason is the increase in the number of Delta cases. However, the data from the previous two months were revised upward, and the unemployment rate decreased to 5.2% (previously 5.4%). On the one hand, such statistics would be negative for the dollar index and positive for the stock market. On the other hand, the market sentiment is now sharply shifting towards further growth of the major US indices. Considering the strongest divergence with the technical indicators, which indicates the strong overbought market, such market conditions will put pressure on the growth of quotes. In other words, the growth of main indices is limited. On Friday, the main American indices failed to strengthen. By the end of the week, the Dow Jones index decreased by 0.2%, while the S&P 500 increased by 0.6%, and the Nasdaq jumped by 1.6%. It’s a Bank Holiday in the United States and Canada today, so with no important events in the European session, the trading day will be quiet.

The leading US infectious disease expert, Dr. Anthony Fauci, said that officials were likely to get regulatory approval soon to introduce the COVID-19 booster vaccines produced by Pfizer. Moderna is a bit behind in this regard. Last month, the Biden administration announced that it would begin offering boosters to Americans by September 20. A week ago, Israel began offering Pfizer’s 3rd vaccine to people older than 12. Officials said the effectiveness of the second dose of Pfizer declines five months after the vaccination, requiring revaccination. A third dose restores the level of protection.

European stock indices also decreased, following the US ones. On Friday, the British FTSE 100 decreased by 0.36%, Germany’s DAX 30 decreased by 0.37%, France’s CAC 40 lost 1.1%, Italy’s FTSE MIB decreased by 0.64%, and Spain’s IBEX 35 lost 1.3%. The spread of Delta negatively affects business activity in the Eurozone, slowing the pace of recovery. After last week’s poor inflation data, some ECB officials began calling for a reduction in the QE program. The ECB meeting on monetary policy will be held on Wednesday, so traders should not expect a strong increase in major indices until then.

At the close of the Tel Aviv Stock Exchange on Sunday, Israel’s main index TA 35 added 0.33%, reaching a new all-time high. The Israeli index often reflects investor behavior after Friday and before the opening of trading in the United States. So it is very likely the major US stock indices will continue to rise on Tuesday.

In October, the Saudi state oil company, Saudi Aramco, said that it would cut prices on all oil varieties for buyers from Asia and the Mediterranean countries. Oil prices began to decline at the opening of trading on Monday amid this news. This suggests that Saudi Arabia is assessing the situation on the worsening prospects for global demand because of the new wave of COVID-19 in the world. On the other hand, the number of active oil rigs in the US decreased by 16 units (to 394) last week due to Hurricane Ida, which resulted in a slight decline in production.

Chinese Internet giant Alibaba will invest the equivalent of $15.5 billion over five years to the country’s “general prosperity.” The 100 billion Chinese yuan will be spread over 10 initiatives, including technological innovation, support of economic growth in China’s less-developed regions, and support of workers and young entrepreneurs. The investment from Alibaba followed a similar $7.7 billion promise from Tencent. Both companies have previously been the focus of Chinese regulators. Many economists believe that this is a deal with the government to reduce the pressure.

Main market quotes:

S&P 500 (F) 4,535.43 −1.52 (−0.03%)

Dow Jones 35,369.09 −74.73 (−0.21%)

DAX 15,781.20 −59.39 (−0.37%)

FTSE 100 7,138.35 −25.55 (−0.36%)

USD Index 92.12 −0.11 (−0.12%)

by JustForex


This article reflects a personal opinion and should not be interpreted as an investment advice, and/or offer, and/or a persistent request for carrying out financial transactions, and/or a guarantee, and/or a forecast of future events.

US dollar continued its depreciation

By Admiral Markets

Last week the currency market remained in a corrective mood for the US dollar and the world’s reserve currency index depreciated by -0.6%, the lowest level in the last month.

USD

Data in the world’s largest economy pointed to continued growth, but at a moderate slowdown compared to the first half of the year. The actual ISM Manufacturing Purchasing Managers’ Index was 59.9 points and remained stable compared to the previous month. The country’s labour market created 235 thousand jobs, but the actual result fell well short of market expectations of 750 thousand, suggesting that the labour market is recovering at a slower pace than investors expect and contributing to slower growth figures in the second half of 2021. The unemployment rate fell to 5.2%. The US Consumer Confidence Index was 113.8 points, slowing down for the second month in a row from the pandemic highs. New car sales fell to 13.1 million year-on-year, the lowest level in over a year. New jobless claims fell again, from 0.353 million to 0.340 million for the week, a positive sign.

Pandemic trends showed an improvement after more than 2 months of rapid growth in the number of cases, with the global spread of the delta virus. Last week, the average number of infections fell from 654 to 629 thousand per day. The situation in the US showed a slowdown, with the weekly average of new cases rising from 156 to 163 thousand per day. The number of vaccinations administered in the country increased from 367 million to 374 million, a change of 7 million and the fastest rate of vaccination since the beginning of July. Overall in the US, the number of people vaccinated with at least one dose rose from 61.3% to 62.2% of the population, an increase of 0.9% over the week. In Lithuania, the number of people vaccinated with at least one dose rose from 58.9% to 59.9%, a difference of only 1.0%. Nevertheless, the vaccination rate in Lithuania reached 70% this week in the population aged 16 years and over. In England, the number of cases has stabilised at 34 thousand per day.

Euro

The main currency pair EUR/USD appreciated throughout the week and was briefly above the 1.190 level on Friday. Economic data in the Old Continent were good and showed accelerating price growth. The actual European Manufacturing Purchasing Managers’ Index stood at 61.4 points and remained in a strong growth zone. Germany’s preliminary annual inflation rate was 3.9%, while Europe’s jumped to 3.0%, significantly higher than the 2.2% of the previous month. The Producer Price Index showed a 12.1% annual increase in July, suggesting that upward pressure on prices continues, especially while the commodity cycle is recording new highs. In Germany, the labour market situation continued to improve, with the number of unemployed falling by 53 thousand in August and the unemployment rate falling to 5.5%. Also, German retail sales volumes were -0.3% lower in July than in the same period a year earlier. The EUR/USD pair ended the week up 0.7%.

JPY

The most important Asian pair USD/JPY continued to move in a channel around its 50-day moving average on the daily chart. Among the data was the actual Manufacturing Purchasing Managers’ Index, which stood at 52.7 points and suggested moderate growth in the sector. The services sector was only 42.9 points and indicated a decline in activity. July retail sales volumes showed a 2.4% year-on-year increase. Industrial production in July was 11.6% higher than a year earlier. USD/JPY ended the week down -0.1%.

GBP

The British pound/US dollar pair started the week very calmly and then appreciated significantly, ending the week at the level of 1.386 points. There were no important economic data. GBP/USD ended the week up 0.8%.

Economic Events

This week is quiet, with no important data scheduled and the US will have a day of unemployment. On Tuesday, the Chinese international trade figures, the European preliminary economic growth for the second quarter and the ZEW index results for Europe and Germany will be monitored. No important data are scheduled for Wednesday, while Thursday will be devoted to the European Central Bank and decisions on changes to the quantitative easing programme. On Friday, Industrial Production data for England and the US Producer Price Index are due.

According to Admiral Markets market sentiment data, 28% of investors have long positions in the EUR/USD pair (down -1 percentage point compared to last week). In the main Asian pair USD/JPY, 55% of investors have long positions (up +6 percentage points). In GBP/USD, 22% of participants expect a rise (down -25 percentage points). Such market data is interpreted as a contrarian indicator so that EUR/USD and GBP/USD are likely to appreciate and USD/JPY to depreciate. The analysis of positioning data should be combined with fundamental projections and technical analysis.

Source: bloomberg.com, reuters.com, Admiral Markets MT4 Supreme Edition, investing.com


Trade With MetaTrader 5

INFORMATION ABOUT ANALYTICAL MATERIALS

The given data provides additional information regarding all analysis, estimates, prognosis, forecasts, market reviews, weekly outlooks or other similar assessments or information (hereinafter “Analysis”) published on the websites of Admiral Markets investment firms operating under the Admiral Markets trademark (hereinafter “Admiral Markets”) Before making any investment decisions please pay close attention to the following: 

  1. This is a marketing communication. The content is published for informative purposes only and is in no way to be construed as investment advice or recommendation. It has not been prepared in accordance with legal requirements designed to promote the independence of investment research, and that it is not subject to any prohibition on dealing ahead of the dissemination of investment research. 
  2. Any investment decision is made by each client alone whereas Admiral Markets shall not be responsible for any loss or damage arising from any such decision, whether or not based on the content. 
  3. With view to protecting the interests of our clients and the objectivity of the Analysis, Admiral Markets has established relevant internal procedures for prevention and management of conflicts of interest. 
  4. The Analysis is prepared by an independent analyst, Roberto Rojas (analyst), (hereinafter “Author”) based on their personal estimations. 
  5. Whilst every reasonable effort is taken to ensure that all sources of the content are reliable and that all information is presented, as much as possible, in an understandable, timely, precise and complete manner, Admiral Markets does not guarantee the accuracy or completeness of any information contained within the Analysis. 
  6. Any kind of past or modeled performance of financial instruments indicated within the content should not be construed as an express or implied promise, guarantee or implication by Admiral Markets for any future performance. The value of the financial instrument may both increase and decrease and the preservation of the asset value is not guaranteed. 
  7. Leveraged products (including contracts for difference) are speculative in nature and may result in losses or profit. Before you start trading, please ensure that you fully understand the risks involved.
Avatar-Admirals
Admirals An all-in-one solution for spending, investing, and managing your moneyMore than a broker, Admirals is a financial hub, offering a wide range of financial products and services. We make it possible to approach personal finance through an all-in-one solution for investing, spending, and managing money.

By Admiral Markets

COT Currency Futures Charts: Mexican Peso, US Dollar Index, British Pound, Bitcoins, Aussie & Kiwi

By CountingPips.com COT Home | Data Tables | Data Downloads | Newsletter

Here are the latest charts and statistics for the Commitment of Traders (COT) data published by the Commodities Futures Trading Commission (CFTC).

The latest COT data is updated through Tuesday August 31 2021 and shows a quick view of how large traders (for-profit speculators and commercial entities) were positioned in the futures markets. All currency positions are in direct relation to the US dollar where, for example, a bet for the euro is a bet that the euro will rise versus the dollar while a bet against the euro will be a bet that the euro will decline versus the dollar.


US Dollar Index Futures:

Federal Funds 30-Day Bonds Futures COT ChartThe US Dollar Index large speculator standing this week totaled a net position of 20,690 contracts in the data reported through Tuesday. This was a weekly rise of 328 contracts from the previous week which had a total of 20,362 net contracts.

This week’s current strength score (the trader positioning range over the past three years, measured from 0 to 100) shows the speculators are currently Bullish with a score of 61.5 percent. The commercials are Bearish with a score of 31.1 percent and the small traders (not shown in chart) are Bullish-Extreme with a score of 97.0 percent.

US DOLLAR INDEX StatisticsSPECULATORSCOMMERCIALSSMALL TRADERS
– Percent of Open Interest Longs:73.54.315.4
– Percent of Open Interest Shorts:31.157.94.2
– Net Position:20,690-26,1835,493
– Gross Longs:35,9022,0917,535
– Gross Shorts:15,21228,2742,042
– Long to Short Ratio:2.4 to 10.1 to 13.7 to 1
NET POSITION TREND:
– COT Index Score (3 Year Range Pct):61.531.197.0
– COT Index Reading (3 Year Range):BullishBearishBullish-Extreme
NET POSITION MOVEMENT INDEX:
– 6-Week Change in Strength Index:14.7-13.9-1.7


Euro Currency Futures:

2-Year Treasury Bonds Futures COT ChartThe Euro Currency large speculator standing this week totaled a net position of 10,476 contracts in the data reported through Tuesday. This was a weekly reduction of -14,154 contracts from the previous week which had a total of 24,630 net contracts.

This week’s current strength score (the trader positioning range over the past three years, measured from 0 to 100) shows the speculators are currently Bearish with a score of 38.2 percent. The commercials are Bullish with a score of 61.0 percent and the small traders (not shown in chart) are Bearish with a score of 46.0 percent.

EURO Currency StatisticsSPECULATORSCOMMERCIALSSMALL TRADERS
– Percent of Open Interest Longs:27.057.413.5
– Percent of Open Interest Shorts:25.564.87.6
– Net Position:10,476-52,21241,736
– Gross Longs:190,593404,63095,205
– Gross Shorts:180,117456,84253,469
– Long to Short Ratio:1.1 to 10.9 to 11.8 to 1
NET POSITION TREND:
– COT Index Score (3 Year Range Pct):38.261.046.0
– COT Index Reading (3 Year Range):BearishBullishBearish
NET POSITION MOVEMENT INDEX:
– 6-Week Change in Strength Index:-10.88.58.2


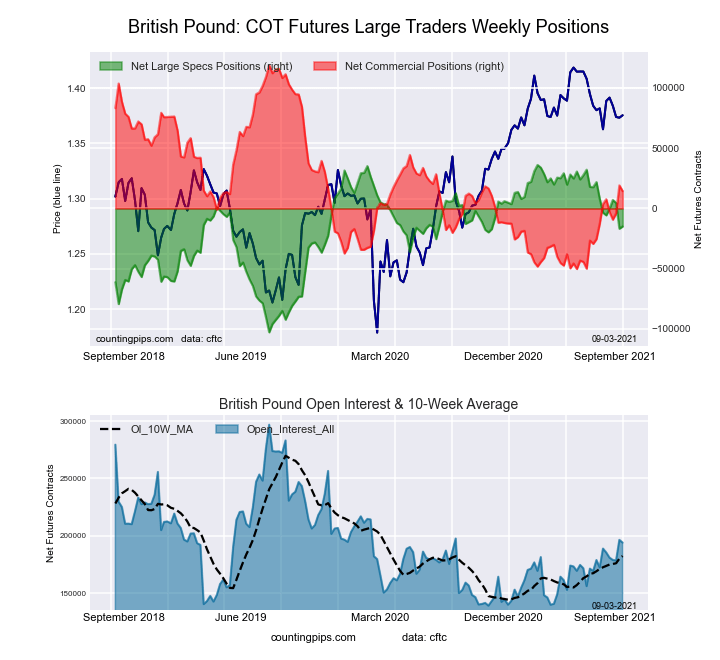
British Pound Sterling Futures:

5-Year Treasury Bonds Futures COT ChartThe British Pound Sterling large speculator standing this week totaled a net position of -14,900 contracts in the data reported through Tuesday. This was a weekly boost of 1,845 contracts from the previous week which had a total of -16,745 net contracts.

This week’s current strength score (the trader positioning range over the past three years, measured from 0 to 100) shows the speculators are currently Bullish with a score of 63.3 percent. The commercials are Bearish with a score of 38.2 percent and the small traders (not shown in chart) are Bullish with a score of 56.6 percent.

BRITISH POUND StatisticsSPECULATORSCOMMERCIALSSMALL TRADERS
– Percent of Open Interest Longs:18.865.214.9
– Percent of Open Interest Shorts:26.557.714.7
– Net Position:-14,90014,435465
– Gross Longs:36,544126,40728,992
– Gross Shorts:51,444111,97228,527
– Long to Short Ratio:0.7 to 11.1 to 11.0 to 1
NET POSITION TREND:
– COT Index Score (3 Year Range Pct):63.338.256.6
– COT Index Reading (3 Year Range):BullishBearishBullish
NET POSITION MOVEMENT INDEX:
– 6-Week Change in Strength Index:-8.26.31.5


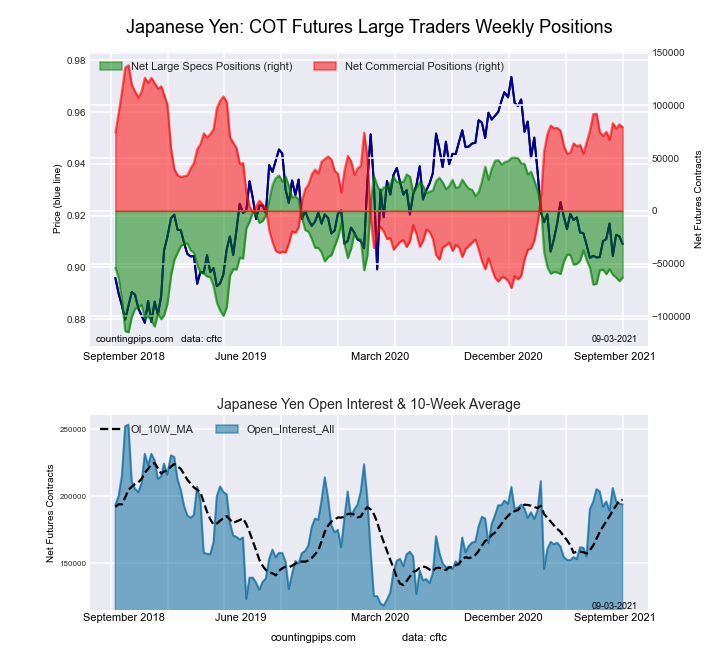
Japanese Yen Futures:

10-Year Treasury Notes Bonds Futures COT ChartThe Japanese Yen large speculator standing this week totaled a net position of -63,130 contracts in the data reported through Tuesday. This was a weekly rise of 3,541 contracts from the previous week which had a total of -66,671 net contracts.

This week’s current strength score (the trader positioning range over the past three years, measured from 0 to 100) shows the speculators are currently Bearish with a score of 31.4 percent. The commercials are Bullish with a score of 72.2 percent and the small traders (not shown in chart) are Bearish with a score of 25.1 percent.

JAPANESE YEN StatisticsSPECULATORSCOMMERCIALSSMALL TRADERS
– Percent of Open Interest Longs:15.074.79.8
– Percent of Open Interest Shorts:47.533.718.2
– Net Position:-63,13079,415-16,285
– Gross Longs:29,030144,84918,955
– Gross Shorts:92,16065,43435,240
– Long to Short Ratio:0.3 to 12.2 to 10.5 to 1
NET POSITION TREND:
– COT Index Score (3 Year Range Pct):31.472.225.1
– COT Index Reading (3 Year Range):BearishBullishBearish
NET POSITION MOVEMENT INDEX:
– 6-Week Change in Strength Index:-4.53.9-1.4


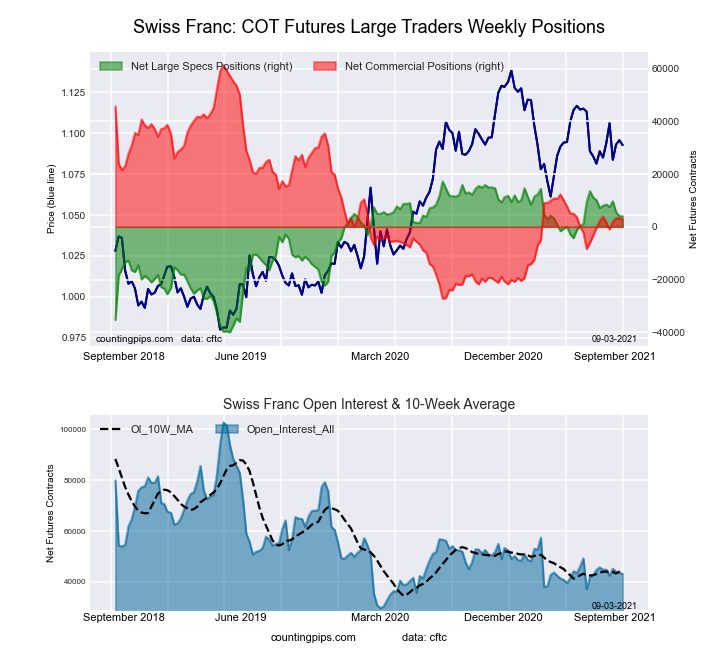
Swiss Franc Futures:

Ultra 10-Year Treasury Notes Bonds Futures COT ChartThe Swiss Franc large speculator standing this week totaled a net position of 3,975 contracts in the data reported through Tuesday. This was a weekly lowering of -119 contracts from the previous week which had a total of 4,094 net contracts.

This week’s current strength score (the trader positioning range over the past three years, measured from 0 to 100) shows the speculators are currently Bullish with a score of 76.9 percent. The commercials are Bearish with a score of 33.9 percent and the small traders (not shown in chart) are Bearish with a score of 43.6 percent.

SWISS FRANC StatisticsSPECULATORSCOMMERCIALSSMALL TRADERS
– Percent of Open Interest Longs:33.142.124.2
– Percent of Open Interest Shorts:23.935.739.8
– Net Position:3,9752,741-6,716
– Gross Longs:14,25918,11610,411
– Gross Shorts:10,28415,37517,127
– Long to Short Ratio:1.4 to 11.2 to 10.6 to 1
NET POSITION TREND:
– COT Index Score (3 Year Range Pct):76.933.943.6
– COT Index Reading (3 Year Range):BullishBearishBearish
NET POSITION MOVEMENT INDEX:
– 6-Week Change in Strength Index:-7.1-1.215.0


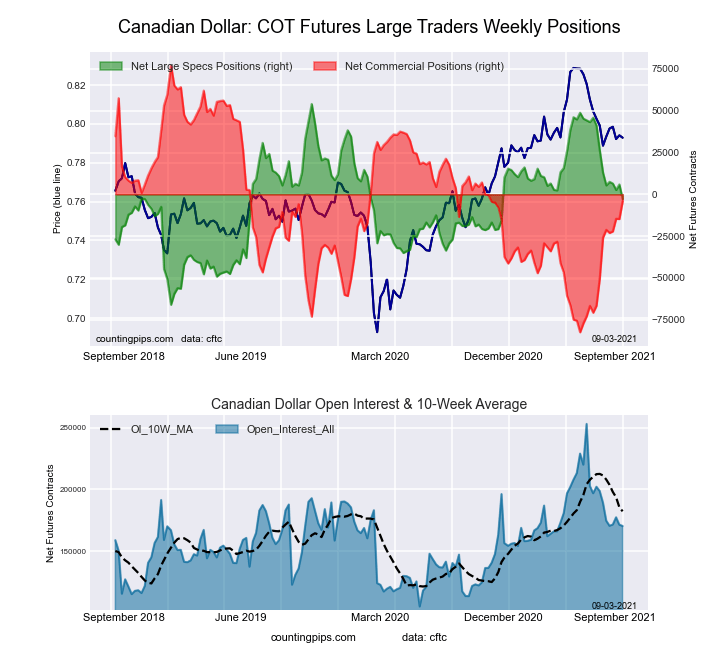
Canadian Dollar Futures:

US Year Treasury Notes Long Bonds Futures COT ChartThe Canadian Dollar large speculator standing this week totaled a net position of -2,848 contracts in the data reported through Tuesday. This was a weekly reduction of -8,725 contracts from the previous week which had a total of 5,877 net contracts.

This week’s current strength score (the trader positioning range over the past three years, measured from 0 to 100) shows the speculators are currently Bullish with a score of 52.6 percent. The commercials are Bearish with a score of 49.1 percent and the small traders (not shown in chart) are Bullish with a score of 57.3 percent.

CANADIAN DOLLAR StatisticsSPECULATORSCOMMERCIALSSMALL TRADERS
– Percent of Open Interest Longs:23.954.320.2
– Percent of Open Interest Shorts:25.556.716.1
– Net Position:-2,848-4,1026,950
– Gross Longs:40,68692,52834,457
– Gross Shorts:43,53496,63027,507
– Long to Short Ratio:0.9 to 11.0 to 11.3 to 1
NET POSITION TREND:
– COT Index Score (3 Year Range Pct):52.649.157.3
– COT Index Reading (3 Year Range):BullishBearishBullish
NET POSITION MOVEMENT INDEX:
– 6-Week Change in Strength Index:-13.113.6-9.1


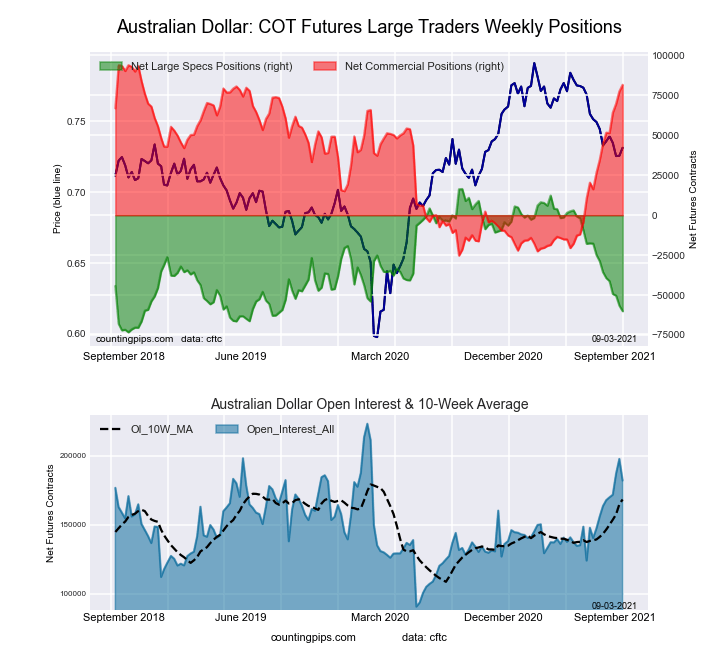
Australian Dollar Futures:

Ultra US Year Treasury Notes Long Bonds Futures COT ChartThe Australian Dollar large speculator standing this week totaled a net position of -60,078 contracts in the data reported through Tuesday. This was a weekly reduction of -3,478 contracts from the previous week which had a total of -56,600 net contracts.

This week’s current strength score (the trader positioning range over the past three years, measured from 0 to 100) shows the speculators are currently Bearish-Extreme with a score of 14.7 percent. The commercials are Bullish-Extreme with a score of 89.7 percent and the small traders (not shown in chart) are Bearish-Extreme with a score of 9.4 percent.

AUSTRALIAN DOLLAR StatisticsSPECULATORSCOMMERCIALSSMALL TRADERS
– Percent of Open Interest Longs:26.063.18.1
– Percent of Open Interest Shorts:59.018.319.9
– Net Position:-60,07881,581-21,503
– Gross Longs:47,384114,93114,812
– Gross Shorts:107,46233,35036,315
– Long to Short Ratio:0.4 to 13.4 to 10.4 to 1
NET POSITION TREND:
– COT Index Score (3 Year Range Pct):14.789.79.4
– COT Index Reading (3 Year Range):Bearish-ExtremeBullish-ExtremeBearish-Extreme
NET POSITION MOVEMENT INDEX:
– 6-Week Change in Strength Index:-27.230.7-27.0


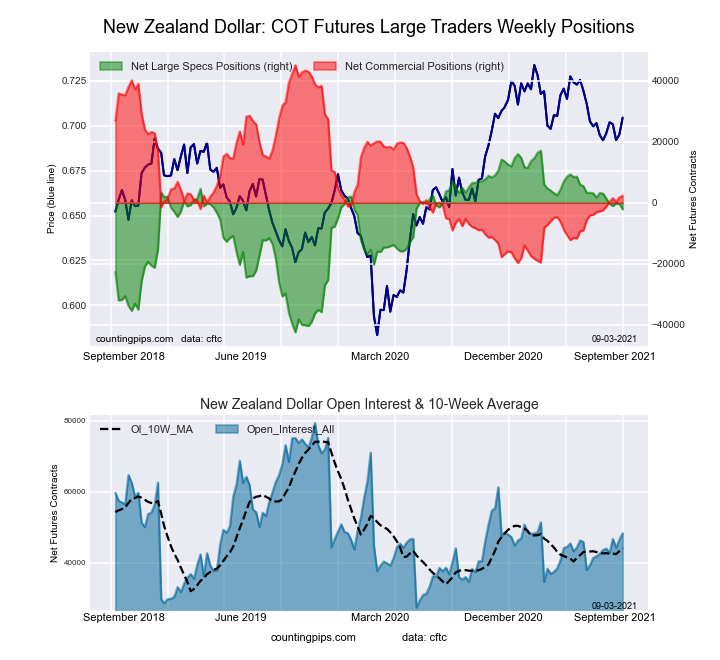
New Zealand Dollar Futures:

Eurodollar Bonds Futures COT ChartThe New Zealand Dollar large speculator standing this week totaled a net position of -2,141 contracts in the data reported through Tuesday. This was a weekly lowering of -1,779 contracts from the previous week which had a total of -362 net contracts.

This week’s current strength score (the trader positioning range over the past three years, measured from 0 to 100) shows the speculators are currently Bullish with a score of 67.7 percent. The commercials are Bearish with a score of 34.1 percent and the small traders (not shown in chart) are Bullish with a score of 50.7 percent.

NEW ZEALAND DOLLAR StatisticsSPECULATORSCOMMERCIALSSMALL TRADERS
– Percent of Open Interest Longs:36.648.58.1
– Percent of Open Interest Shorts:41.143.68.6
– Net Position:-2,1412,372-231
– Gross Longs:17,69223,4253,919
– Gross Shorts:19,83321,0534,150
– Long to Short Ratio:0.9 to 11.1 to 10.9 to 1
NET POSITION TREND:
– COT Index Score (3 Year Range Pct):67.734.150.7
– COT Index Reading (3 Year Range):BullishBearishBullish
NET POSITION MOVEMENT INDEX:
– 6-Week Change in Strength Index:-8.77.44.1


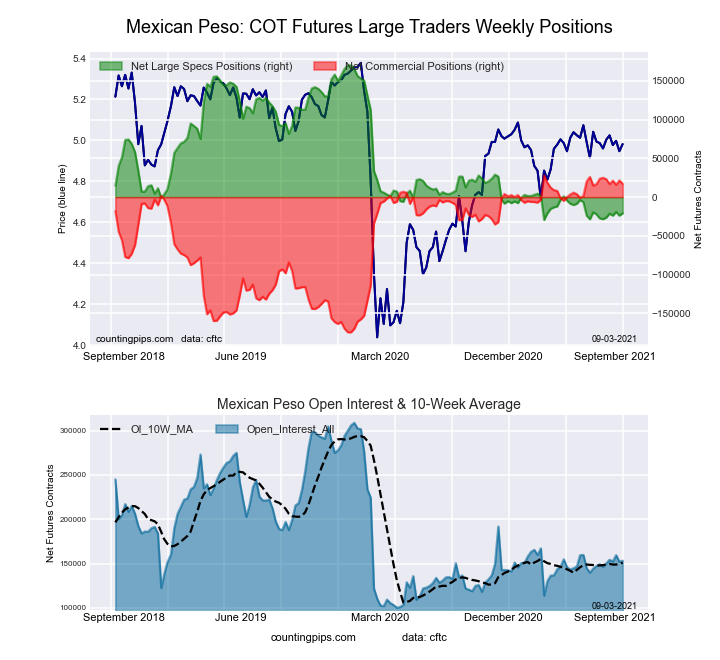
Mexican Peso Futures:

Ultra 10-Year Treasury Notes Bonds Futures COT ChartThe Mexican Peso large speculator standing this week totaled a net position of -21,043 contracts in the data reported through Tuesday. This was a weekly gain of 2,787 contracts from the previous week which had a total of -23,830 net contracts.

This week’s current strength score (the trader positioning range over the past three years, measured from 0 to 100) shows the speculators are currently Bearish-Extreme with a score of 4.2 percent. The commercials are Bullish-Extreme with a score of 94.6 percent and the small traders (not shown in chart) are Bullish with a score of 59.5 percent.

MEXICAN PESO StatisticsSPECULATORSCOMMERCIALSSMALL TRADERS
– Percent of Open Interest Longs:47.045.54.5
– Percent of Open Interest Shorts:60.734.32.0
– Net Position:-21,04317,1573,886
– Gross Longs:72,05269,8096,924
– Gross Shorts:93,09552,6523,038
– Long to Short Ratio:0.8 to 11.3 to 12.3 to 1
NET POSITION TREND:
– COT Index Score (3 Year Range Pct):4.294.659.5
– COT Index Reading (3 Year Range):Bearish-ExtremeBullish-ExtremeBullish
NET POSITION MOVEMENT INDEX:
– 6-Week Change in Strength Index:3.7-3.91.9


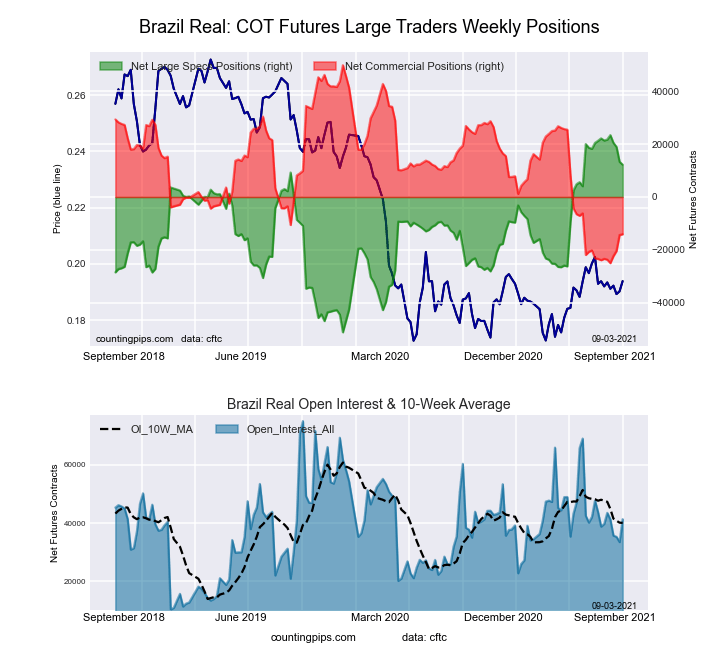
Brazilian Real Futures:

US Year Treasury Notes Long Bonds Futures COT ChartThe Brazilian Real large speculator standing this week totaled a net position of 12,258 contracts in the data reported through Tuesday. This was a weekly lowering of -1,088 contracts from the previous week which had a total of 13,346 net contracts.

This week’s current strength score (the trader positioning range over the past three years, measured from 0 to 100) shows the speculators are currently Bullish-Extreme with a score of 85.0 percent. The commercials are Bearish-Extreme with a score of 14.6 percent and the small traders (not shown in chart) are Bullish-Extreme with a score of 89.3 percent.

BRAZIL REAL StatisticsSPECULATORSCOMMERCIALSSMALL TRADERS
– Percent of Open Interest Longs:48.836.58.2
– Percent of Open Interest Shorts:19.170.73.7
– Net Position:12,258-14,1161,858
– Gross Longs:20,16515,0783,398
– Gross Shorts:7,90729,1941,540
– Long to Short Ratio:2.6 to 10.5 to 12.2 to 1
NET POSITION TREND:
– COT Index Score (3 Year Range Pct):85.014.689.3
– COT Index Reading (3 Year Range):Bullish-ExtremeBearish-ExtremeBullish-Extreme
NET POSITION MOVEMENT INDEX:
– 6-Week Change in Strength Index:-12.312.4-2.0


Russian Ruble Futures:

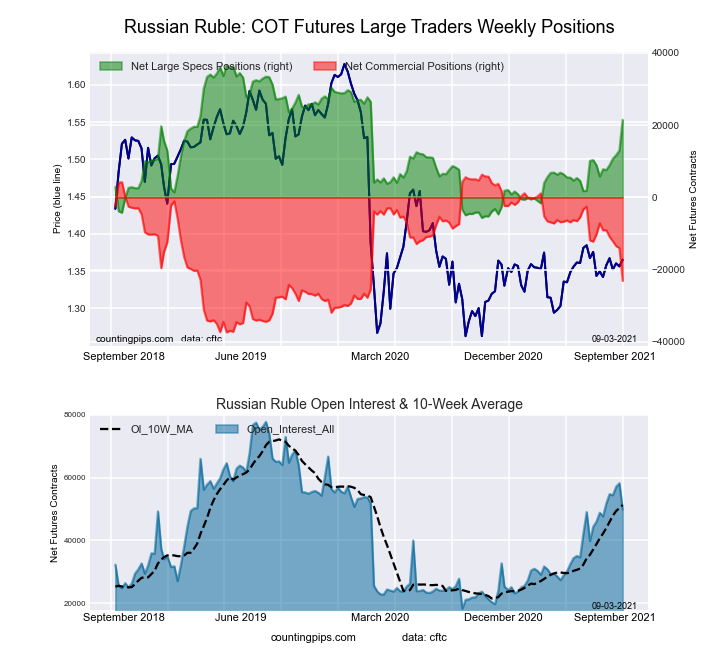
Ultra US Year Treasury Notes Long Bonds Futures COT ChartThe Russian Ruble large speculator standing this week totaled a net position of 21,471 contracts in the data reported through Tuesday. This was a weekly gain of 8,506 contracts from the previous week which had a total of 12,965 net contracts.

This week’s current strength score (the trader positioning range over the past three years, measured from 0 to 100) shows the speculators are currently Bullish with a score of 64.2 percent. The commercials are Bearish with a score of 32.6 percent and the small traders (not shown in chart) are Bullish-Extreme with a score of 88.9 percent.

RUSSIAN RUBLE StatisticsSPECULATORSCOMMERCIALSSMALL TRADERS
– Percent of Open Interest Longs:51.443.65.0
– Percent of Open Interest Shorts:8.389.91.7
– Net Position:21,471-23,0821,611
– Gross Longs:25,60521,7042,469
– Gross Shorts:4,13444,786858
– Long to Short Ratio:6.2 to 10.5 to 12.9 to 1
NET POSITION TREND:
– COT Index Score (3 Year Range Pct):64.232.688.9
– COT Index Reading (3 Year Range):BullishBearishBullish-Extreme
NET POSITION MOVEMENT INDEX:
– 6-Week Change in Strength Index:32.4-32.110.1


Bitcoin Futures:

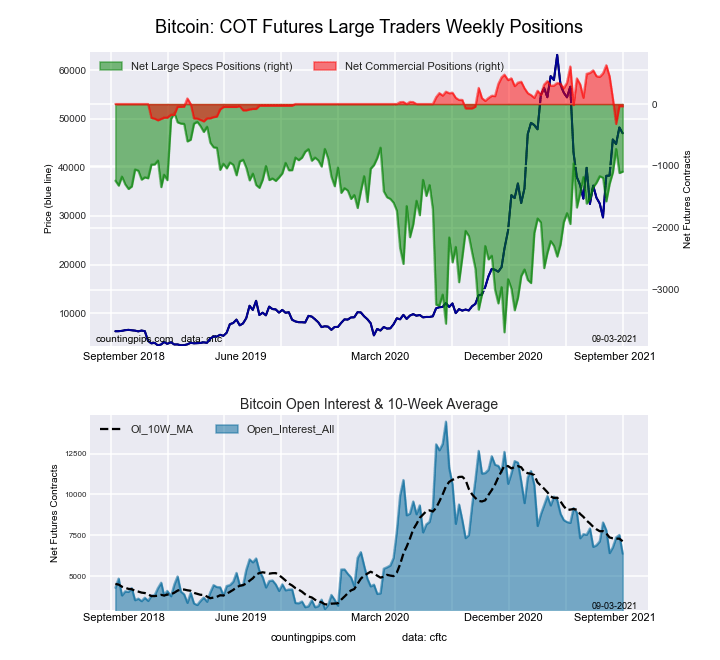
Eurodollar Bonds Futures COT ChartThe Bitcoin large speculator standing this week totaled a net position of -1,092 contracts in the data reported through Tuesday. This was a weekly advance of 22 contracts from the previous week which had a total of -1,114 net contracts.

This week’s current strength score (the trader positioning range over the past three years, measured from 0 to 100) shows the speculators are currently Bullish with a score of 73.2 percent. The commercials are Bearish with a score of 29.9 percent and the small traders (not shown in chart) are Bearish with a score of 26.8 percent.

BITCOIN StatisticsSPECULATORSCOMMERCIALSSMALL TRADERS
– Percent of Open Interest Longs:63.95.627.0
– Percent of Open Interest Shorts:81.16.29.3
– Net Position:-1,092-371,129
– Gross Longs:4,0663581,720
– Gross Shorts:5,158395591
– Long to Short Ratio:0.8 to 10.9 to 12.9 to 1
NET POSITION TREND:
– COT Index Score (3 Year Range Pct):73.229.926.8
– COT Index Reading (3 Year Range):BullishBearishBearish
NET POSITION MOVEMENT INDEX:
– 6-Week Change in Strength Index:2.8-56.214.3


Article By CountingPips.comReceive our weekly COT Reports by Email

*COT Report: The COT data, released weekly to the public each Friday, is updated through the most recent Tuesday (data is 3 days old) and shows a quick view of how large speculators or non-commercials (for-profit traders) were positioned in the futures markets.

The CFTC categorizes trader positions according to commercial hedgers (traders who use futures contracts for hedging as part of the business), non-commercials (large traders who speculate to realize trading profits) and nonreportable traders (usually small traders/speculators).

Find CFTC criteria here: (http://www.cftc.gov/MarketReports/CommitmentsofTraders/ExplanatoryNotes/index.htm).

Fibonacci Retracements Analysis 03.09.2021 (AUDUSD, USDCAD)

Article By RoboForex.com

AUDUSD, “Australian Dollar vs US Dollar”

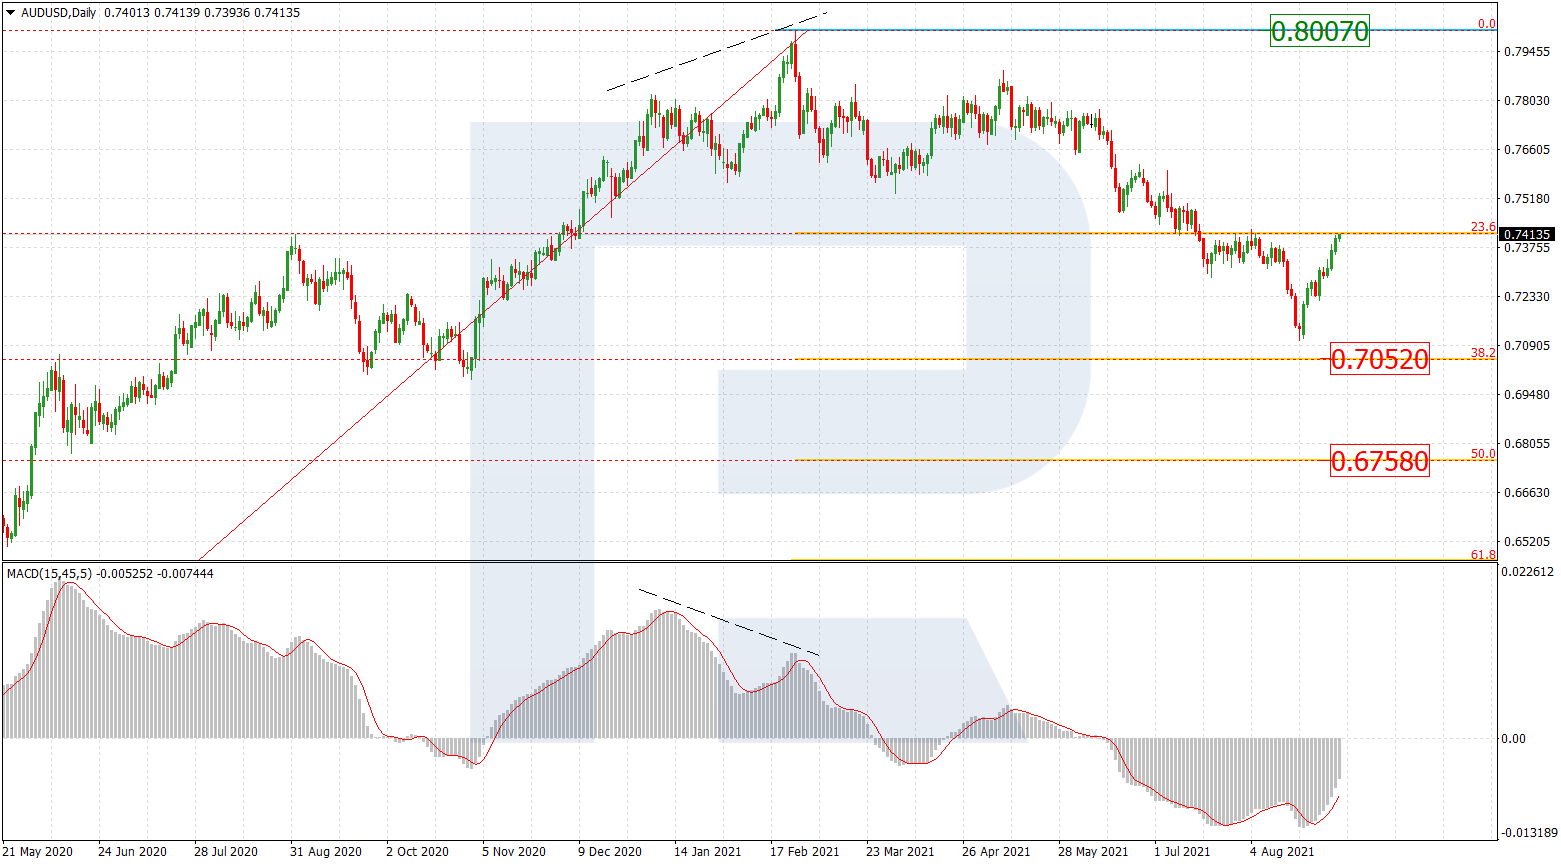
In the daily chart, after attempting to test 38.2% fibo at 0.7052, the asset is correcting upwards to return to 23.6% fibo. After the pullback is over, the asset may continue falling towards 50.0% and 61.8% fibo at 0.6758 and 0.6464 respectively. The key resistance is the high at 0.8007.

AUDUSD_D1
Risk Warning: the result of previous trading operations do not guarantee the same results in the future

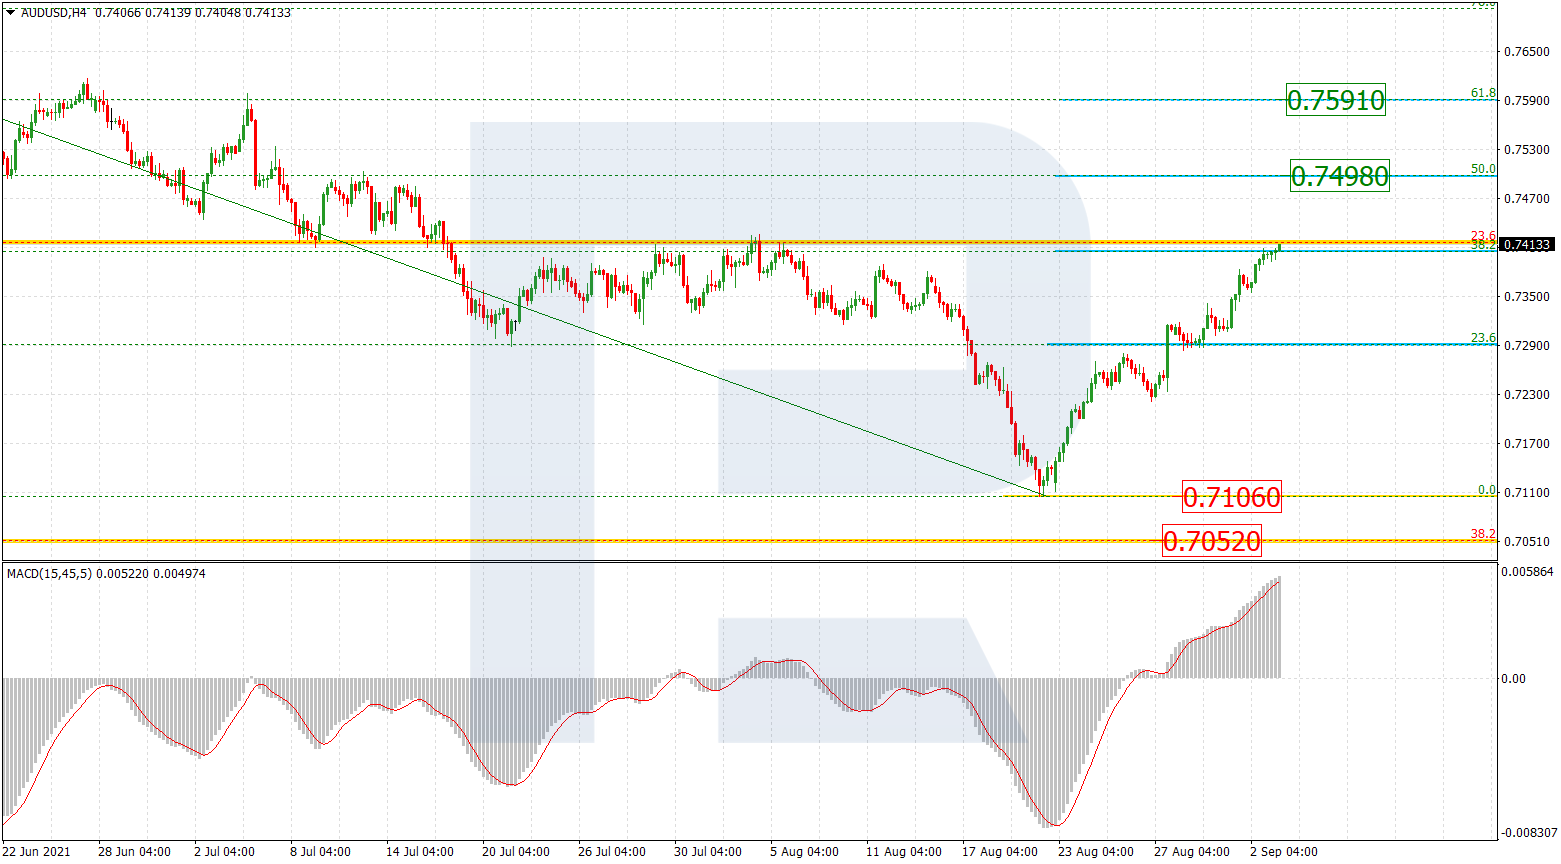
The H4 chart of AUDUSD shows that the correctional uptrend has reached 38.2% fibo and may later continue towards and 50.0% and 61.8% fibo at 0.7498 and 0.7591 respectively. A breakout of the local support at 0.7106 will lead to a further mid-term downtrend with the closest target at 38.2% fibo (0.7052).

AUDUSD_H4
Risk Warning: the result of previous trading operations do not guarantee the same results in the future

USDCAD, “US Dollar vs Canadian Dollar”

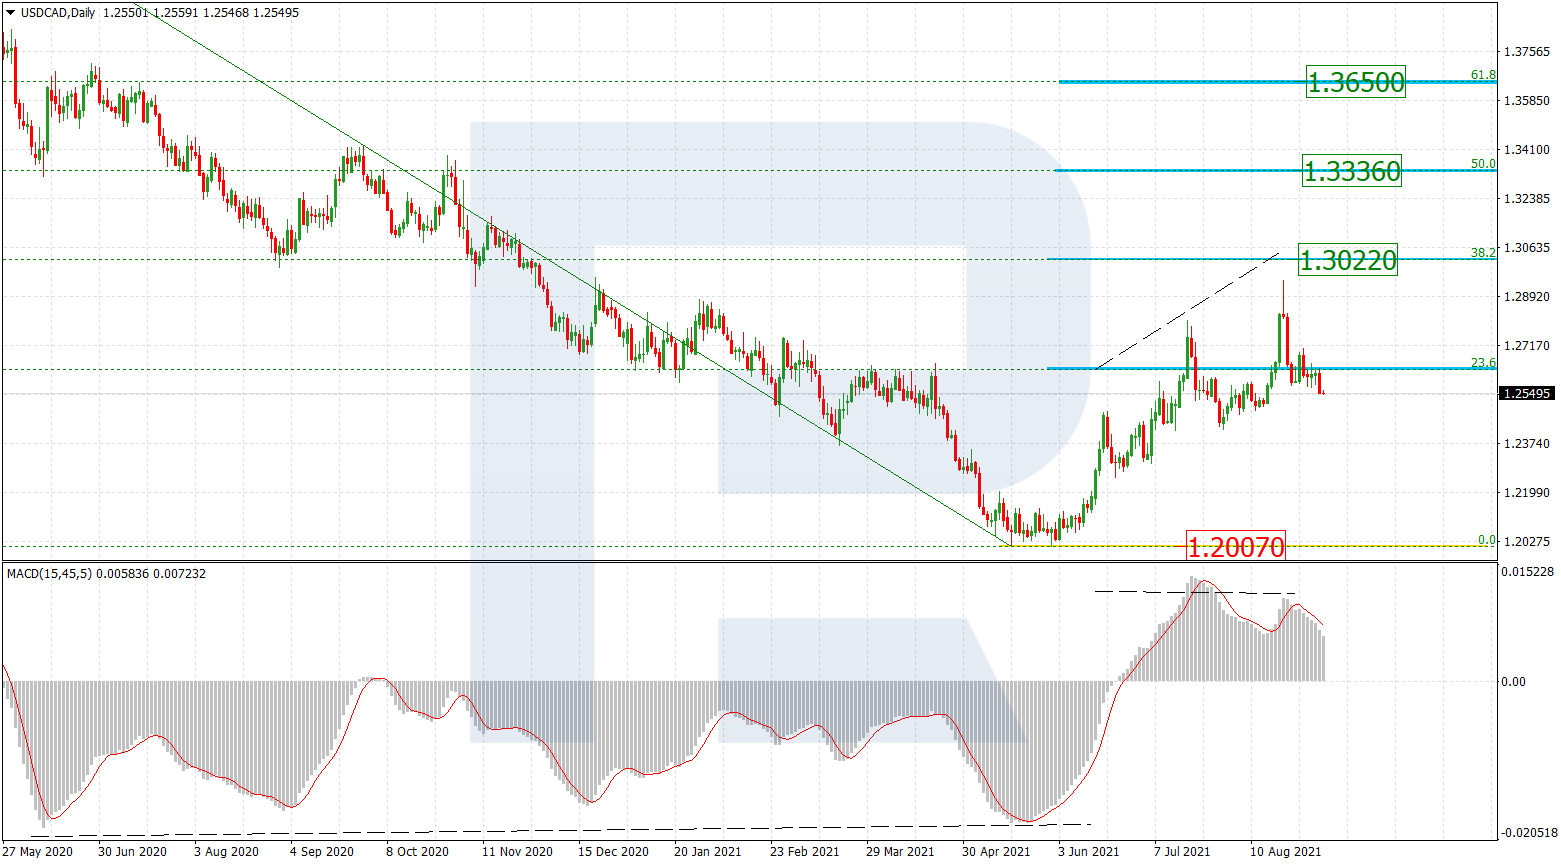
As we can see in the daily chart, after an attempt to reach 38.2% fibo at 1.3022 and local divergence on MACD, the pair is correcting downwards. After finishing the pullback and breaking 38.2% fibo, the asset may form a new wave to the upside with the targets at 50.0% and 61.8% fibo at 1.3336 and 1.3650 respectively. The key support remains at the low at 1.2007.

USDCAD_D1
Risk Warning: the result of previous trading operations do not guarantee the same results in the future

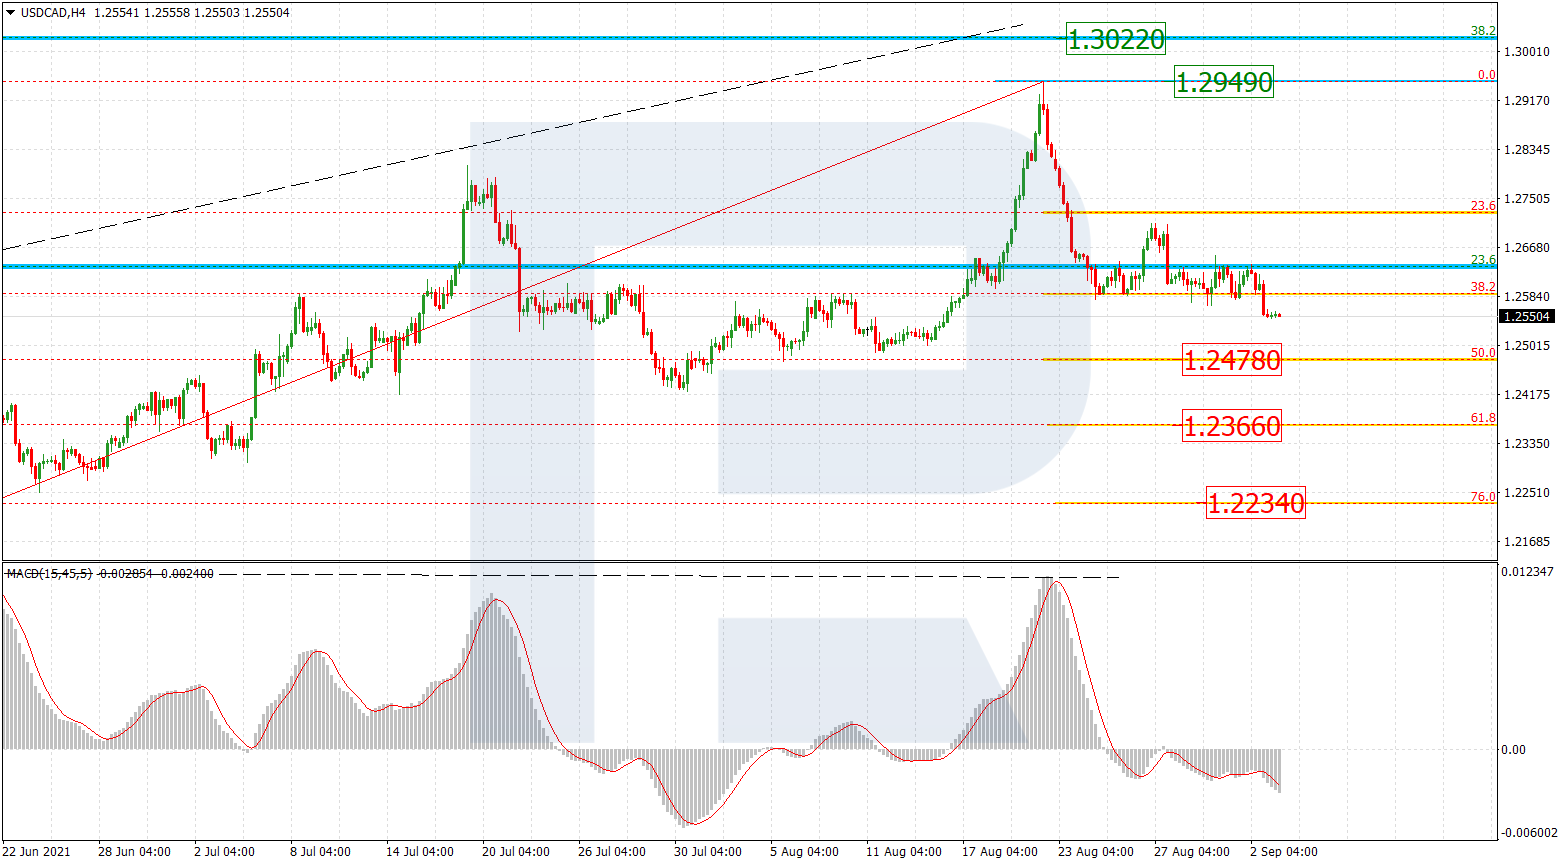
The H4 chart shows that after a thorough test of 38.2% fibo, the asset has broken this level; right now, it is forming a new descending impulse towards 50.0%, 61.8%, and 76.0% fibo at 1.2478, 1.2366, and 1.2234 respectively. The local resistance is the fractal high at 1.2949.

USDCAD_H4

Article By RoboForex.com

Attention!
Forecasts presented in this section only reflect the author’s private opinion and should not be considered as guidance for trading. RoboForex LP bears no responsibility for trading results based on trading recommendations described in these analytical reviews.

Ichimoku Cloud Analysis 03.09.2021 (NZDUSD, GBPUSD, EURUSD)

Article By RoboForex.com

NZDUSD, “New Zealand Dollar vs US Dollar”

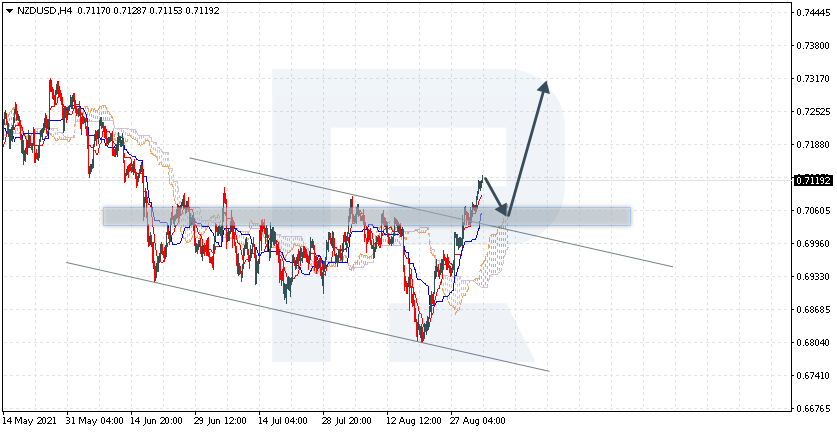
NZDUSD is trading at 0.7119; the instrument is moving above Ichimoku Cloud, thus indicating an ascending tendency. The markets could indicate that the price may test the cloud’s upside border at 0.7065 and then resume moving upwards to reach 0.7315. Another signal in favor of a further uptrend will be a rebound from the descending channel’s upside border. However, the bullish scenario may be cancelled if the price breaks the cloud’s downside border and fixes below 0.6895. In this case, the pair may continue falling towards 0.6805.

NZDUSD
Risk Warning: the result of previous trading operations do not guarantee the same results in the future

GBPUSD, “Great Britain Pound vs US Dollar”

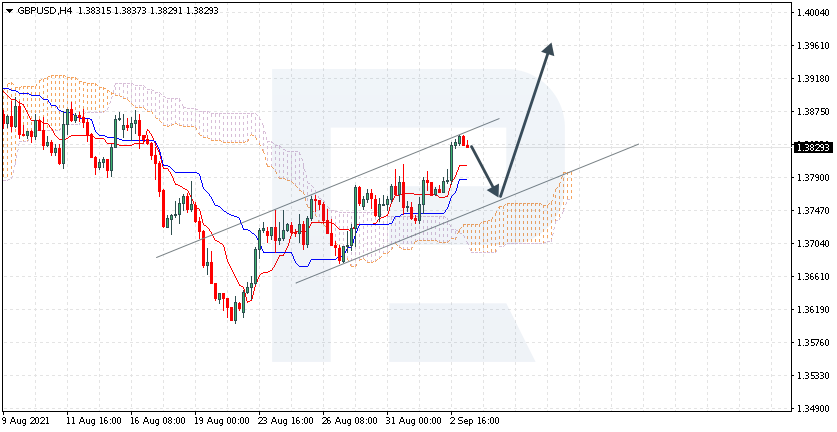
GBPUSD is trading at 1.3829; the instrument is moving above Ichimoku Cloud, thus indicating an ascending tendency. The markets could indicate that the price may test Tenkan-Sen and Kijun-Sen at 1.3765 and then resume moving upwards to reach 1.3965. Another signal in favor of a further uptrend will be a rebound from the rising channel’s downside border. However, the bullish scenario may no longer be valid if the price breaks the cloud’s downside border and fixes below 1.3655. In this case, the pair may continue falling towards 1.3565.

GBPUSD
Risk Warning: the result of previous trading operations do not guarantee the same results in the future

EURUSD, “Euro vs US Dollar”

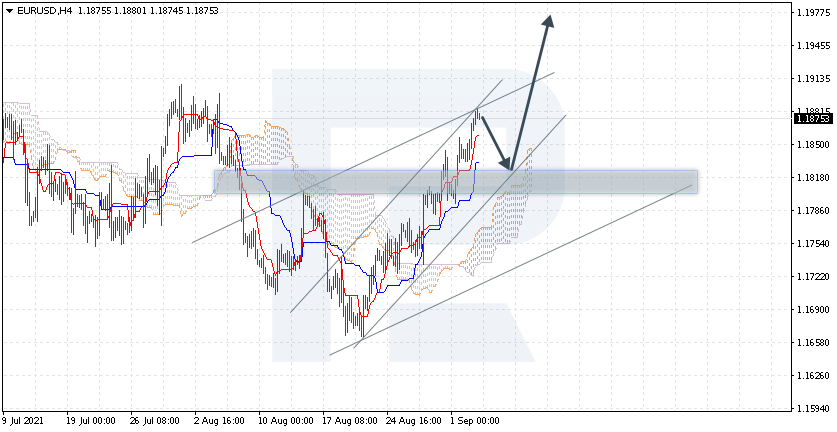
EURUSD is trading at 1.1875; the instrument is moving above Ichimoku Cloud, thus indicating an ascending tendency. The markets could indicate that the price may test Tenkan-Sen and Kijun-Sen at 1.1820 and then resume moving upwards to reach 1.1975. Another signal in favor of a further uptrend will be a rebound from the ascending channel’s downside border. However, the bullish scenario may be cancelled if the price breaks the cloud’s downside border and fixes below 1.1715. In this case, the pair may continue falling towards 1.1625. To confirm further growth, the asset must break the resistance level and fix above 1.1915.

EURUSD

Article By RoboForex.com

Attention!
Forecasts presented in this section only reflect the author’s private opinion and should not be considered as guidance for trading. RoboForex LP bears no responsibility for trading results based on trading recommendations described in these analytical reviews.

The Analytical Overview of the Main Currency Pairs on 2021.09.03

by JustForex

The EUR/USD currency pair

Technical indicators of the currency pair:
  • Prev Open: 1.1838
  • Prev Close: 1.1875
  • % chg. over the last day: +0.31%

Good data on the US labor market has not stopped the decline of the US dollar. The decline in the dollar index plays in favor of the euro strengthening. Considering that investors are betting on the recovery of the European economy, the euro exchange rate may significantly strengthen in the next 1-2 months.

Trading recommendations
  • Support levels: 1.1854, 1.1816, 1.1799, 1.1759, 1.1704, 1.1620
  • Resistance levels: 1.1880, 1.1934, 1.1969

From a technical point of view, the general trend of the EUR/USD currency pair has changed to bullish. The price broke through the priority change level and consolidated above. The MACD indicator is still signaling a divergence in the opposite direction. The price has deviated from the moving average; given the divergence, there is an increasing probability of a corrective downward movement. Under such market conditions, it is best to look for sell trades from the resistance levels, where sellers show initiative. Buy trades can be considered only after a pullback to the support levels near the moving average.

Alternative scenario: if the price breaks through the 1.1704 support level and fixes below, the mid-term uptrend will likely be broken.

EUR/USD
News feed for 2021.09.03:
  • – US Nonfarm Payrolls (m/m) at 15:30 (GMT+3);
  • – US Unemployment Rate (m/m) at 15:30 (GMT+3);
  • – US ISM Services PMI (m/m) at 17:00 (GMT+3).

The GBP/USD currency pair

Technical indicators of the currency pair:
  • Prev Open: 1.3769
  • Prev Close: 1.3732
  • % chg. over the last day: +0.46%

The British pound is also getting stronger against the background of the dollar index decline. The growth of quotes is also supported by the growth of Brent oil price. The UK will report on the situation in the industrial and service sectors today.

Trading recommendations
  • Support levels: 1.3793, 1.3741, 1.3692, 1.3632, 1.3614, 1.3525
  • Resistance levels: 1.3886, 1.3935, 1.4002

On the hourly time frame, the GBP/USD trend changed to bullish. The price broke through the priority change level on the impulsive movement and consolidated higher. The MACD indicator is in the positive zone, and there are the first signs of divergence on higher time frames. Under such market conditions, it is better to look for buy trades from the support levels after the price pullback, as the price has now deviated strongly from the moving average. Sell positions can only be considered from the resistance levels with short targets throughout the day.

Alternative scenario: if the price breaks through the 1.3692 support level and consolidates below, the bearish scenario will likely resume.

GBP/USD
News feed for 2021.09.03:
  • – US Nonfarm Payrolls (m/m) at 15:30 (GMT+3);
  • – US Unemployment Rate (m/m) at 15:30 (GMT+3).

The USD/JPY currency pair

Technical indicators of the currency pair:
  • Prev Open: 109.97
  • Prev Close: 109.93
  • % chg. over the last day: -0.04%

The USD/JPY currency pair is highly dependent on the dynamics of the dollar index now. The dollar index is declining, which leads to a decrease in the USD/JPY quotes. Japan’s services sector activity contracted at the fastest pace in over a year in August as the sharp outbreak of COVID-19 hit the recovery of the world’s third largest economy.

Trading recommendations
  • Support levels: 109.88, 109.43, 109.19, 108.65
  • Resistance levels: 110.11, 110.34, 110.66, 110.95, 111.48

The main trend of the USD/JPY currency pair is bullish. The price is now trading in a narrow corridor. The MACD indicator is inactive. Under such market conditions, traders should look for buy trades from the support level, where buyers show initiative. Sell positions should be considered only on the lower time frames from the false breakdown zone.

Alternative scenario: if the price falls below 109.43, the uptrend is likely to be broken.

USD/JPY
News feed for 2021.09.03:
  • – US Nonfarm Payrolls (m/m) at 15:30 (GMT+3);
  • – US Unemployment Rate (m/m) at 15:30 (GMT+3).

The USD/CAD currency pair

Technical indicators of the currency pair:
  • Prev Open: 1.2610
  • Prev Close: 1.2551
  • % chg. over the last day: -0.47%

The Canadian dollar is a commodity currency, so the USD/CAD currency pair is highly dependent on the dynamics of the dollar index and oil prices. The dollar index is falling while oil prices are rising. As a result, the USD/CAD currency pair is decreasing due to the strengthening of the Canadian dollar.

Trading recommendations
  • Support levels: 1.2518, 1.2471
  • Resistance levels: 1.2583, 1.2656, 1.2713, 1.2812, 1.2891, 1.2951

In terms of technical analysis, the trend on the USD/CAD currency pair has changed to bearish. The price broke through the priority change level on the impulsive movement and consolidated below. It is now best to consider sell positions from the resistance levels, where sellers show the initiative. Buy positions can be considered from the support levels, but after additional confirmation in the form of buyers’ initiative.

Alternative scenario: if the price breaks through the 1.2812 resistance level and fixes above, the uptrend will likely resume.

USD/CAD
News feed for 2021.09.03:
  • – US Nonfarm Payrolls (m/m) at 15:30 (GMT+3);
  • – US Unemployment Rate (m/m) at 15:30 (GMT+3).

by JustForex


This article reflects a personal opinion and should not be interpreted as an investment advice, and/or offer, and/or a persistent request for carrying out financial transactions, and/or a guarantee, and/or a forecast of future events.

Investors’ attention is focused on nonfarm payrolls data

by JustForex

The number of initial jobless claims in the US fell to 340,000, the lowest level since March 2020. Investors are now focusing on nonfarm payrolls data. Economists expect the number of workers to increase by 720,000 a month and the unemployment rate to fall from 5.4% to 5.2%. If the data is above those expectations, the dollar index will rise substantially, and major stock indices will decrease. The US stock market ended Thursday’s trading higher due to the strength of the oil and gas, health care, and utilities sectors. The Dow Jones increased by 0.37%, the S&P 500 increased by 0.28%, and the NASDAQ added 0.14%.

European stock indices increased on Wednesday as investors bet that the global economic recovery would continue, even as central banks considered cutting stimulus. The Stoxx Europe 600 composite index of the region’s largest companies added 0.3%. The current value is very close to its all-time high. The British FTSE 100 added 0.2%, the German DAX and the French CAC 40 increased by 0.1%, the Italian FTSE MIB added 0.2%. Meanwhile, Spain’s IBEX 35 lost 0.1%.

Oil prices jumped sharply yesterday. The pressure on prices triggers a sharp decrease in US inventories, the data on which was released on Wednesday. Despite an increase in production by OPEC+ countries, market supply is still far below demand. Optimism about economic recovery and the weakening of the US dollar also contributed to the growth of quotes.

The situation with gold has not changed much in recent days. Fundamentally, quotes will rise as long as the Federal Reserve maintains a soft monetary policy. But traders have to be careful, as good labor market data can make the dollar index and government bond yields rise, which in turn will make gold prices fall.

Japanese stocks jumped on Friday after officials had said Prime Minister Yoshihide Suga would resign. Japan’s TOPIX stock index jumped to a 30-year high, while the Nikkei added 1.87%.

Main market quotes:

S&P 500 (F) 4,536.95 +12.86 (+0.28%)

Dow Jones 35,443.82 +131.29 (+0.37%)

DAX 15,840.59 +16.30 (+0.10%)

FTSE 100 7,163.90 +14.06 (+0.20%)

USD Index 92.23 −0.22 (−0.23%)

Important events for today:
  • – Australia Retail Sales (m/m) at 04:30 (GMT+3);
  • – UK Composite PMI (m/m) at 11:30 (GMT+3);
  • – UK Services PMI (m/m) at 11:30 (GMT+3);
  • – US Nonfarm Payrolls (m/m) at 15:30 (GMT+3).

by JustForex


This article reflects a personal opinion and should not be interpreted as an investment advice, and/or offer, and/or a persistent request for carrying out financial transactions, and/or a guarantee, and/or a forecast of future events.