Archive for Forex and Currency News – Page 227

Greenback Gains Support Early in the Week

By Dmitriy Gurkovskiy, Chief Analyst at RoboForex

Early in another week of September, EUR/USD is significantly falling and trading at 1.1790.

The major currency pair started moving downwards after negotiations between American and Chinese Presidents. It was their first conversation in seven months. The key topics discussed were economics and mutual interests, including the areas where the parties are still far away from consensus.

Additional support the “greenback” got from the statistics on the Producer Price Index, which improved pretty much in August. As a result, American inflation is likely to remain quite high but the logistic structure for producers may remain as tough as before because of the pandemic effect.

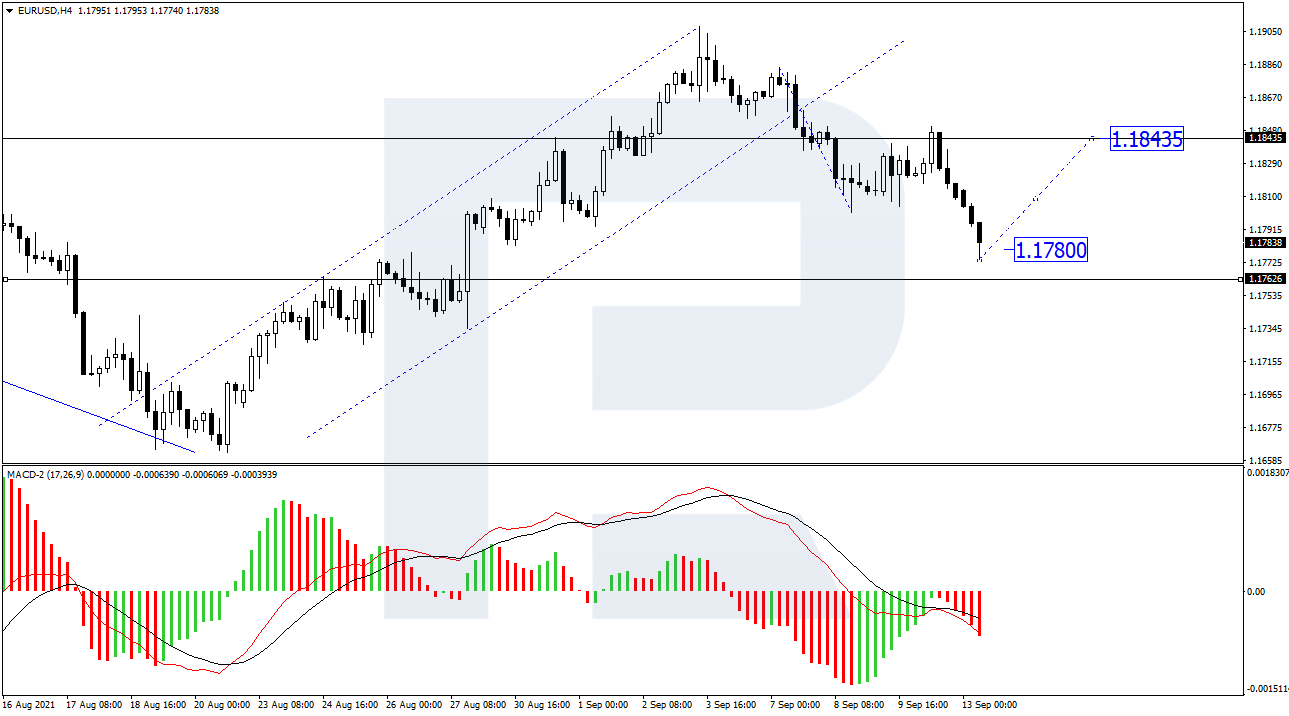
In the H4 chart, after breaking 1.1840 to the downside and finishing the fifth descending structure at 1.1780, EUR/USD is expected to form a new consolidation range near the highs. If the price breaks this range to the upside, the market may resume trading upwards to test 1.1850. From the technical point of view, this scenario is confirmed by MACD Oscillator: its signal line is about to leave the histogram area and start another growth towards 0. After breaking 0, the line is expected to continue growing towards new highs of the indicator.

As we can see in the H1 chart, EUR/USD is consolidating above 1.1780 and may later grow to reach 1.1809. After that, the instrument may fall towards 1.1790 and then start another growth with the short-term target at 1.1830. Later, the market may correct to test 1.1809 from above and then resume trading upwards to reach 1.1850. From the technical point of view, this scenario is confirmed by the Stochastic Oscillator: after breaking 20 to the upside and leaving the “oversold area”, its signal line is steadily moving towards 50, a breakout of which may lead to further growth to reach 80.

Disclaimer

Any forecasts contained herein are based on the author’s particular opinion. This analysis may not be treated as trading advice. RoboForex bears no responsibility for trading results based on trading recommendations and reviews contained herein.

NZDUSD Bullish Impulse To Continue After Correction (2)

By Orbex

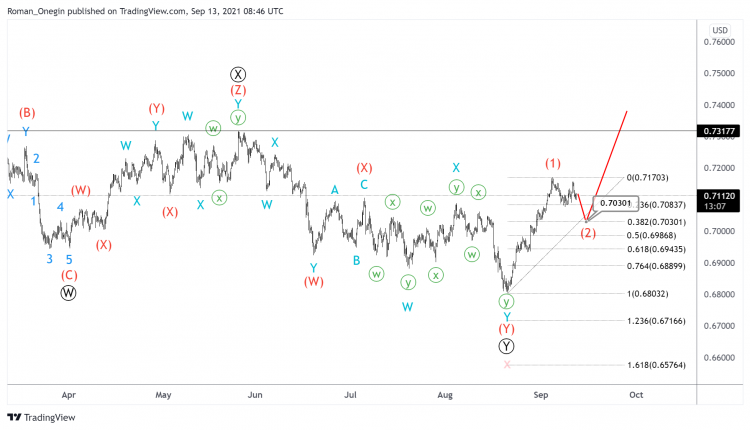
NZDUSD has seen the formation of an intervening wave x of a cycle degree. Wave x is a double zigzag consisting of primary sub-waves, the last part of which is an intermediate double zigzag (W)-(X)-(Y).

After impulse wave (1) ended, the market began to decline in a shallow correction (2). The intermediate wave (2) can end near the target level of 0.703.

At that level, the entire wave (2) will be at 38.2% of impulse (1). Prices could rise above the previous maximum of 0.731, at the primary wave Ⓧ.

NZDUSD

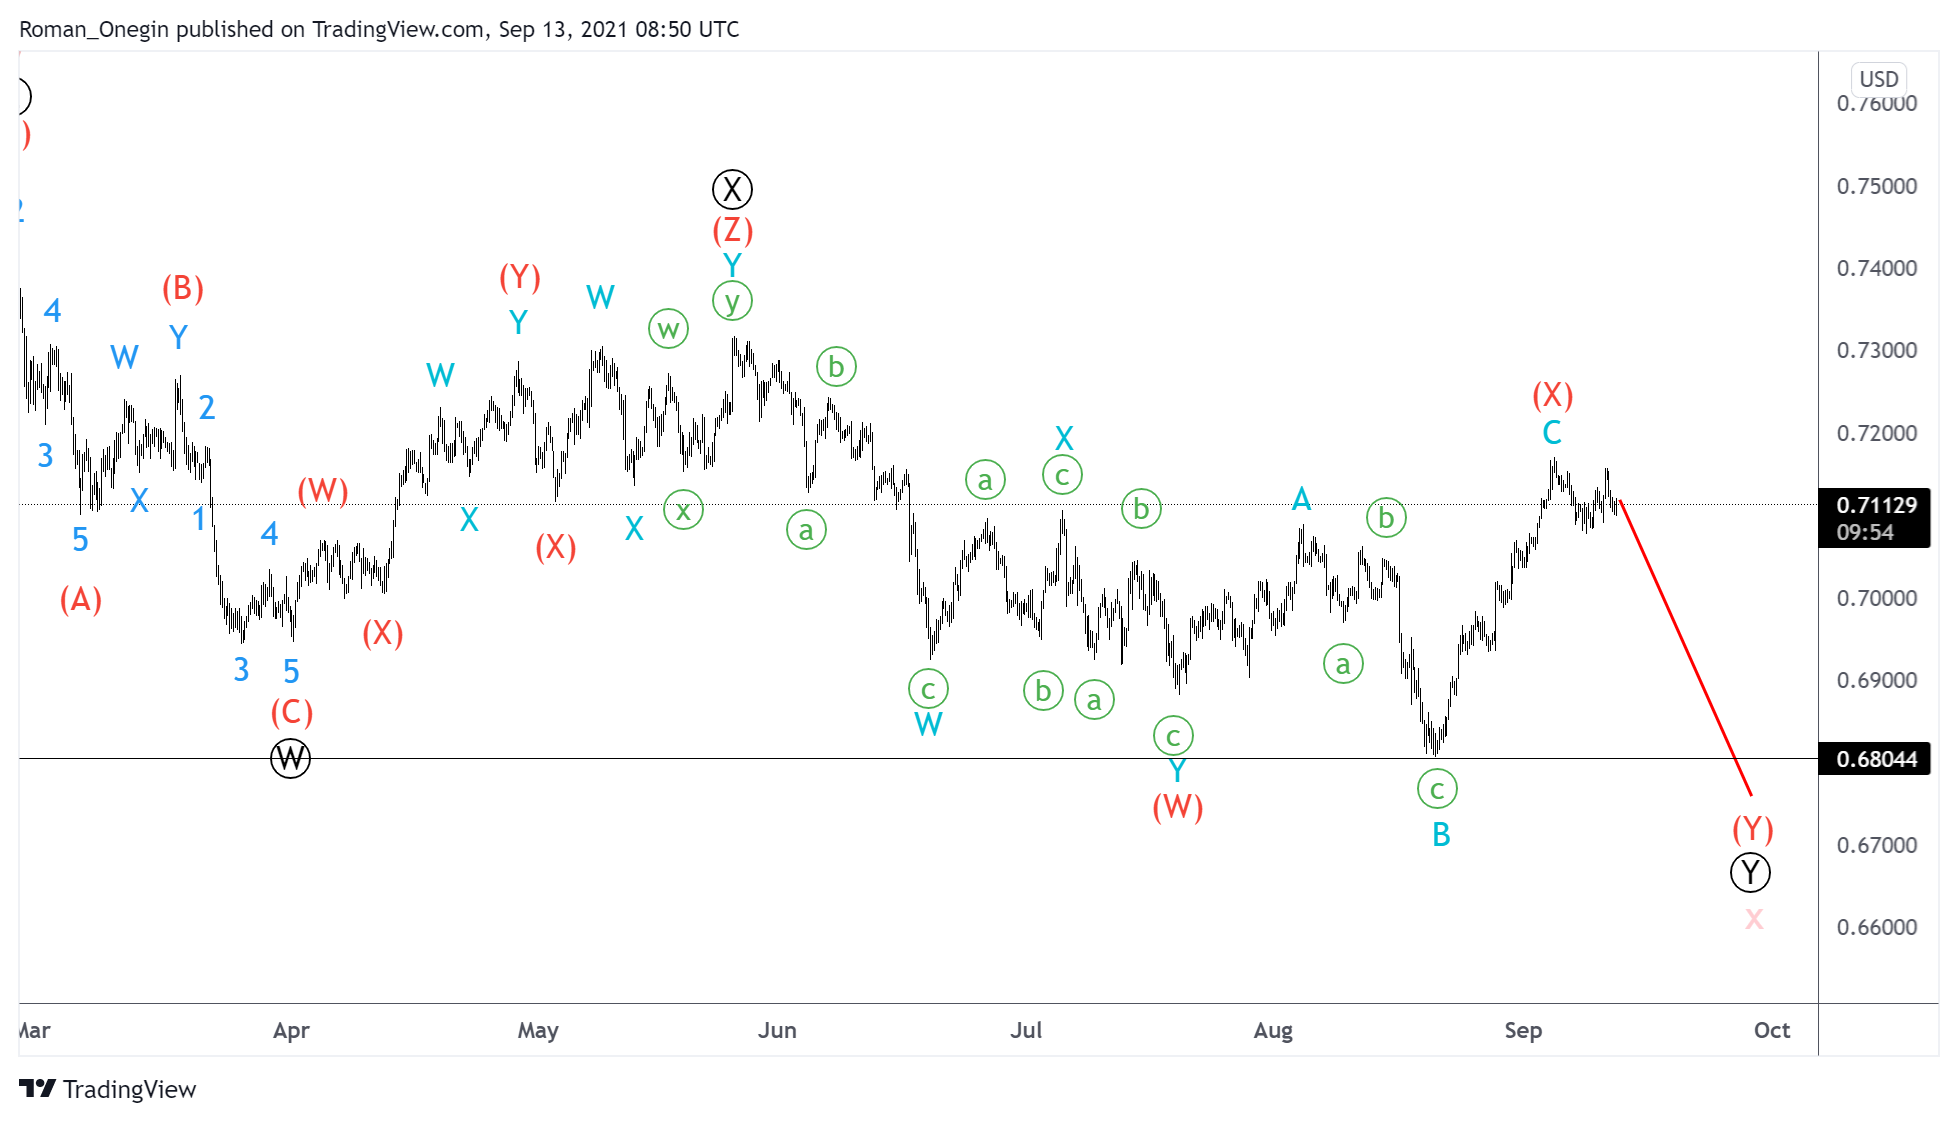
An alternative scenario indicates that the interventing wave x of the cycle degree may not be complete yet. According to this view, the last part of this wave is still under development. It consists of intermediate sub-waves (W)-(X)-(Y), where wave (X) was recently formed.

The wave (X), by its structure, is a simple flat. After the full completion of this flat, the market began to move down in a new bearish wave (Y).

In this case, the previous minimum shown by the minor wave X determines the target.

Thus, in the coming trading weeks, we may see the market decline below the level of 0.680, as indicated on the chart.


Orbex-LogoArticle by Orbex

Orbex is a fully licensed broker that was established in 2011. Founded with a mission to serve its traders responsibly and provides traders with access to the world’s largest and most liquid financial markets. www.orbex.com

The “greenback” strengthened significantly. Overview for 13.09.2021

Article By RoboForex.com

EURUSD is falling; market players like the USD again.

Early in another September week, the major currency pair is falling. The current quote for the instrument is 1.1790.

The American PPI in August added 0.7% m/m after expanding by 1.0% m/m the month before and against the expected reading of 0.6% m/m. The Core PPI also improved, by 0.6% m/m, which is better than expected.

Inflation in the USA will remain high for a while. At the same time, the logistic structure for producers is as tough as before because of the pandemic effect.

Investors’ attention will be focused on the price data this week: as early as Tuesday, the USA will report on the CPI for August, which is expected to show 0.4% m/m after being 0.5% m/m in the previous month.

Apart from the statistic, the “greenback” was supported by politicians: after a phone talk between American and Chinese Presidents, their first conversation over seven months, market players immediately believed that the USD has a bright future. Leaders talked about economic and financial issues, some of which are still very controversial.

In addition to that, the parties discussed the specifics of working during the pandemic, as well as ecology issues.

Article By RoboForex.com

Attention!
Forecasts presented in this section only reflect the author’s private opinion and should not be considered as guidance for trading. RoboForex LP bears no responsibility for trading results based on trading recommendations described in these analytical reviews.

The Analytical Overview of the Main Currency Pairs on 2021.09.13

by JustForex

The EUR/USD currency pair

Technical indicators of the currency pair:
  • Prev Open: 1.1823
  • Prev Close: 1.1810
  • % chg. over the last day: -0.11%

The US dollar ended the week with an increase of about 0.6% against the euro. The US policy prospects, which increased the US Treasury bond yields, had a positive effect on the dollar index. On the other hand, last week, ECB officials said they plan to start cutting stimulus programs in the next quarter, which will play in favor of strengthening the European currency in the medium term.

Trading recommendations
  • Support levels: 1.1783, 1.1759, 1.1704, 1.1620
  • Resistance levels: 1.1840, 1.1894, 1.1934, 1.1969

From the technical point of view, the general trend on the EUR/USD currency pair is bullish, but on the background of the dollar index growth, the EUR/USD quotes are declining, forming a local downtrend. The breakout of the downtrend line was false on Friday. The MACD indicator is in the negative zone, but there are the first signs of sellers’ weakness. Under such market conditions, buy trades can be considered from the support levels, or after the breakout of the downtrend line. It is better to look for sell trades from the resistance levels, where sellers show initiative.

Alternative scenario: if the price breaks through the 1.1704 support level and fixes below, the mid-term uptrend will likely be broken.

EUR/USD
There is no news feed for today.

The GBP/USD currency pair

Technical indicators of the currency pair:
  • Prev Open: 1.3833
  • Prev Close: 1.3830
  • % chg. over the last day: -0.02%

The growth of Great Britain’s economy slowed down, as the increase in the number of coronavirus cases and the shortage of labor has inflicted a hit on the recovery. Due to a large labor shortage and the complex procedure for hiring foreign workers, the United Kingdom is at risk of a shortage of products on store shelves. According to the representative of Logistics UK, currently, the lack of drivers ranges from 90,000 to 120,000 people, while British are reluctant to work in this industry. The UK-EU trade volume is also decreasing as Brexit and Covid reduced exports.

Trading recommendations
  • Support levels: 1.3793, 1.3750, 1.3692, 1.3632, 1.3614, 1.3525
  • Resistance levels: 1.3886, 1.3935, 1.4002

On the hourly time frame, the GBP/USD trend is bullish. But amid the growth of the dollar index, the GBP/USD quotes are declining. The MACD indicator has become inactive. Under such market conditions, it is better to look for buy trades from the support levels near the moving average line. Sell positions can only be considered from the resistance levels with short targets throughout the day.

Alternative scenario: if the price breaks through the 1.3692 support level and consolidates below, the bearish scenario will likely resume.

GBP/USD
There is no news feed for today.

The USD/JPY currency pair

Technical indicators of the currency pair:
  • Prev Open: 109.73
  • Prev Close: 109.90
  • % chg. over the last day: +0.15%

The producer price index in Japan remained at about the same level, indicating that inflation at industrial companies is not rising. Many economists expect that Japan’s new prime minister will continue working on monetary policy stimulation along with the National Bank of Japan.

Trading recommendations
  • Support levels: 109.62, 109.43, 109.19, 108.65
  • Resistance levels: 110.11, 110.40, 110.66, 110.95, 111.48

The main trend on the USD/JPY currency pair is bullish. But the Japanese yen has shown strength in recent days, which, together with the rise in the dollar index led to the formation of a wide trading range, within which the price has consolidated. The MACD indicator has become inactive. Under such market conditions, traders should look for buy trades from the support level where buyers show initiative throughout the day. Sell positions should be considered on the lower time frames with short targets from the zones where sellers show initiative.

Alternative scenario: if the price falls below 109.43, the uptrend is likely to be broken.

USD/JPY
News feed for 2021.09.13:
  • – Japan PPI (m/m) at 02:50 (GMT+3).

The USD/CAD currency pair

Technical indicators of the currency pair:
  • Prev Open: 1.2661
  • Prev Close: 1.2691
  • % chg. over the last day: +0.24%

In Canada, the unemployment rate decreased to 7.1% after companies added 90,200 jobs in August. This is a good sign for the economy. The Canadian dollar is a commodity currency, so the USD/CAD currency pair is highly dependent on the dynamics of the dollar index and oil prices. Both the dollar index and oil prices increased at the end of last week. As a result, the price of USD/CAD is trading in a wide corridor with a slight advantage of the dollar index, which contributes to the growth of quotes.

Trading recommendations
  • Support levels: 1.2625, 1.2583, 1.2518, 1.2425
  • Resistance levels: 1.2713, 1.2812, 1.2891, 1.2951

In terms of technical analysis, the trend on the USD/CAD currency pair is bearish. But the price has consolidated in a local correctional upward movement. The MACD indicator shows weak buying pressure. Buy positions can be considered from the support levels where buyers show initiative, and only with short targets. It is better to look for sell positions from the resistance levels of a higher time frame.

Alternative scenario: if the price breaks through the 1.2812 resistance level and fixes above, the uptrend will likely resume.

USD/CAD
There is no news feed for today.

by JustForex


This article reflects a personal opinion and should not be interpreted as an investment advice, and/or offer, and/or a persistent request for carrying out financial transactions, and/or a guarantee, and/or a forecast of future events.

The dollar index continues to strengthen, sending major stock indices down

by JustForex

Last week, investors focused on the release of the ECB’s monetary policy plans. The European Central Bank left the interest rate unchanged and slightly raised its inflation target this year. But the ECB will likely start to reduce its stimulus program in the next quarter. Such news had a negative impact on the US market as well. Also, investors are now inclined to believe that the Federal Reserve will follow its colleagues from Europe and start cutting its quantitative easing program next quarter as well. A lot will depend on inflation data released this week in the USA, Canada, Great Britain, Europe, and Japan.

The US stock market finished Friday’s trading with a decline amid negative dynamics from the utilities, technology, and health care sectors. Dow Jones index lost 0.78% (-2.24% for the week) reaching a monthly minimum, S&P 500 decreased by 0.77% (-1.63% for the week), NASDAQ index lost 0.87% (-1.29% for the week). Apple shares were the biggest fallers among the Dow Jones components, falling by 3.3%. It becomes clear that investors and hedge funds are cutting their positions now.

US Democratic senators have proposed imposing a 2% tax on the amount that public companies spend on stock buybacks. Given the Democrats’ plans to substantially increase taxes on large corporations, such rhetoric puts negative pressure on major US stock markets. On the other hand, tax benefits for electric vehicles will be expanded.

The main European stock indexes closed in the red zone on Friday. The only exception was the British FTSE 100 index, which increased by 0.07%. But by the end of the week, the index lost 1.53%. German DAX lost 1.32% at the end of the week. The correlation between the American and the European indices is clearly seen again. Considering the fact that the ECB plans to start cutting back its stimulus program in the next quarter, traders should not expect significant growth of the main European indices.

Oil prices increased to $73 a barrel on Friday, helped by growing signs of a US inventory shortage in the wake of Hurricane Ida and the hopes for a renewal of trade between the US and China, which boosted riskier assets. Two OPEC+ sources said Monday the group would lower its 2022 oil demand growth forecast as the spread of the Delta virus casts doubt on fuel demand growth.

Asia-Pacific stock indices opened the trading week lower, following Friday’s negative performance by US indices last week. Japan’s Nikkei 225 index has already lost 0.3% since the opening session, Hong Kong’s Hang Seng index decreased by 2.2%, China’s Shanghai Composite decreased by 0.2%, South Korea’s KOSPI lost 0.5%. In Japan, the PPI index increased by 5.5% in August compared to the same period of the previous year. Shares of Chinese technology companies are falling again amid increasing control by the authorities. Regulators have strongly warned internet platforms not to try to bypass recently introduced restrictive measures.

Main market quotes:

S&P 500 (F) 4,458.58 −34.70 (−0.77%)

Dow Jones 34,607.72 −271.66 (−0.78%)

DAX 15,609.81 −13.34 (−0.085%)

FTSE 100 7,029.20 +4.99 (+0.07%)

USD Index 92.64 +0.16 (−0.17%)

Important events for today:
  • – Japan PPI (m/m) at 02:50 (GMT+3).

by JustForex


This article reflects a personal opinion and should not be interpreted as an investment advice, and/or offer, and/or a persistent request for carrying out financial transactions, and/or a guarantee, and/or a forecast of future events.

US dollar pushed through and appreciated

By Admiral Markets

Last week the world’s reserve currency recovered some of last month’s losses, rebounding from the 200-day moving average on a daily chart. Financial markets were in a mildly corrective mood, with equity indices slightly reddening and bond yields rising, which probably contributed to the stronger demand for the US dollar in this context.

USD

US economic data were good, albeit limited. Much attention was drawn to the country’s Producer Price Index, which showed a rise of 8.3% year-on-year, a new high in the last decade. This suggests that upward price pressures are still not abating and that inflation rates are likely to remain higher for longer. The number of job openings in the country continued to rise and reached 10.93 million in the latest JOLTs data, the highest point in decades, indicating that the labour market is recovering faster than people are willing to return to work. The number of new jobless claims continued to fall from 0.340 million to 0.310 million on a weekly basis, suggesting a decline in the number of people claiming job loss assistance.

Virus data showed positive signs, with the global weekly average of new infections falling from 629 to 552 thousand per day. In the US, data supported the global trend, with the country’s weekly average of new cases decreasing from 162 to 135 thousand per day. The number of vaccines administered increased from 374 million to 379 million, a weekly change of 5 million. Overall, the number of people vaccinated with at least one dose in the US rose from 62.2% to 63.0% of the population, an increase of 0.8% per week. In Lithuania, the number of people vaccinated with at least one dose rose from 59.9% to 60.8%, a difference of 0.9%. In England, the number of cases increased slightly from 34 to 37 thousand per day.

Euro

The main currency pair EUR/USD depreciated to the level of 1.180, reflecting the trend of a stronger US dollar. Economic data on the Old Continent were good and preliminary data show that the economy grew by 14.3% year-on-year or 2.2% quarter-on-quarter in the second quarter. The ZEW economic sentiment index stood at 31.1 points in Europe and 26.5 points in Germany, both falling to their lowest level in over a year. The European Central Bank also kept interest rates and the size of its stimulus programme unchanged, but announced that they are likely to be cut at the end of the year or at the beginning of the next one, if market conditions permit. No specific figures or dates were provided. The EUR/USD pair ended the week down -0.6%.

JPY

The most important Asian pair USD/JPY continued its consolidation and moved around its 50-day moving average on the daily chart. The data included the actual economic growth in the second quarter, which amounted to 1.9% year-on-year or 0.5% quarter-on-quarter. The country’s household spending grew by 0.7% year-on-year. USD/JPY ended the week trading up 0.2%.

GBP

The British pound-US dollar pair consolidated in the trading ranges of the last few months. The data included an annual economic growth of 7.5% and a 3.8% year-on-year increase in industrial production. GBP/USD ended the week down -0.2%.

Economic Events

This week will start quietly and the Japanese Producer Price Index will be monitored on Monday. On Tuesday, investors will be looking forward to Japanese industrial production, English labour market data and US August inflation. On Wednesday, important Chinese industrial, inflation and retail sales indicators will be monitored, as well as English inflation and European and US industrial production data. On Thursday, the focus will be on the US retail sales figures, and on Friday on the English figure.

According to Admiral Markets market sentiment data, 65% of investors have long positions in the EUR/USD pair (up +37 percentage points compared to last week). In the main Asian pair USD/JPY, 49% of investors have long positions (down -6 percentage points). In GBP/USD, 40% of participants expect a rise (up +18 percentage points). Such market data is interpreted as a contrarian indicator, so EUR/USD is likely to fall, GBP/USD to rise, USD/JPY is in neutral. The analysis of positioning data should be combined with fundamental projections and technical analysis.


Source: bloomberg.com, reuters.com, Admiral Markets MT4 Supreme Edition, investing.com


Trade With MetaTrader 5

INFORMATION ABOUT ANALYTICAL MATERIALS

The given data provides additional information regarding all analysis, estimates, prognosis, forecasts, market reviews, weekly outlooks or other similar assessments or information (hereinafter “Analysis”) published on the websites of Admiral Markets investment firms operating under the Admiral Markets trademark (hereinafter “Admiral Markets”) Before making any investment decisions please pay close attention to the following: 

  • This is a marketing communication. The content is published for informative purposes only and is in no way to be construed as investment advice or recommendation. It has not been prepared in accordance with legal requirements designed to promote the independence of investment research, and that it is not subject to any prohibition on dealing ahead of the dissemination of investment research. 
  • Any investment decision is made by each client alone whereas Admiral Markets shall not be responsible for any loss or damage arising from any such decision, whether or not based on the content. 
  • With view to protecting the interests of our clients and the objectivity of the Analysis, Admiral Markets has established relevant internal procedures for prevention and management of conflicts of interest. 
  • The Analysis is prepared by an independent analyst, Skirmantus Paulavicious (analyst), (hereinafter “Author”) based on their personal estimations. 
  • Whilst every reasonable effort is taken to ensure that all sources of the content are reliable and that all information is presented, as much as possible, in an understandable, timely, precise and complete manner, Admiral Markets does not guarantee the accuracy or completeness of any information contained within the Analysis. 
  • Any kind of past or modeled performance of financial instruments indicated within the content should not be construed as an express or implied promise, guarantee or implication by Admiral Markets for any future performance. The value of the financial instrument may both increase and decrease and the preservation of the asset value is not guaranteed. 
  • Leveraged products (including contracts for difference) are speculative in nature and may result in losses or profit. Before you start trading, please ensure that you fully understand the risks involved.
Avatar-Admirals
Admirals An all-in-one solution for spending, investing, and managing your moneyMore than a broker, Admirals is a financial hub, offering a wide range of financial products and services. We make it possible to approach personal finance through an all-in-one solution for investing, spending, and managing money.

By Admiral Markets

COT Forex Futures Charts: Australian Dollar, Euro, CAD, Swiss Franc, Ruble, Bitcoin & British Pound Sterling

By CountingPips.com COT Home | Data Tables | Data Downloads | Newsletter

Here are the latest charts and statistics for the Commitment of Traders (COT) data published by the Commodities Futures Trading Commission (CFTC).

The latest COT data is updated through Tuesday September 7th 2021 and shows a quick view of how large traders (for-profit speculators and commercial entities) were positioned in the futures markets. All currency positions are in direct relation to the US dollar where, for example, a bet for the euro is a bet that the euro will rise versus the dollar while a bet against the euro will be a bet that the euro will decline versus the dollar.


US Dollar Index Futures:
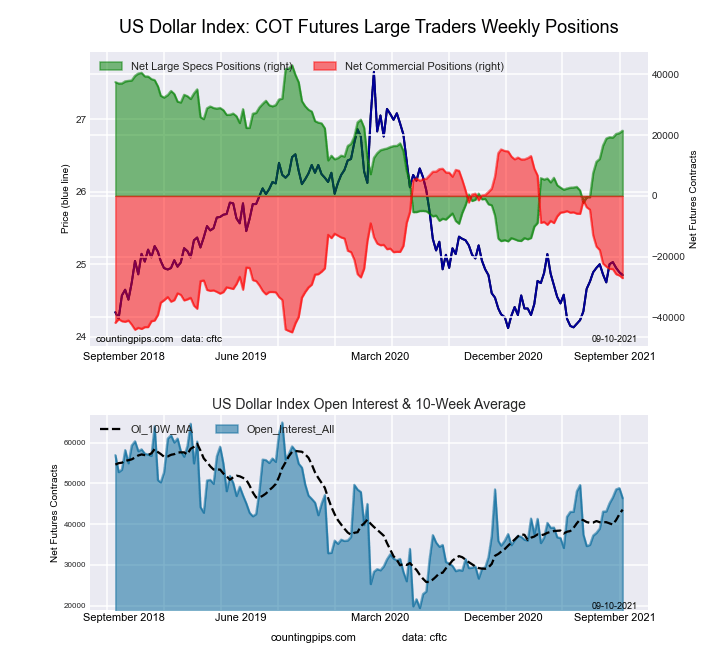
Federal Funds 30-Day Bonds Futures COT ChartThe US Dollar Index large speculator standing this week resulted in a net position of 21,465 contracts in the data reported through Tuesday. This was a weekly advance of 775 contracts from the previous week which had a total of 20,690 net contracts.

This week’s current strength score (the trader positioning range over the past three years, measured from 0 to 100) shows the speculators are currently Bullish with a score of 62.8 percent. The commercials are Bearish with a score of 29.6 percent and the small traders (not shown in chart) are Bullish-Extreme with a score of 98.4 percent.

US DOLLAR INDEX StatisticsSPECULATORSCOMMERCIALSSMALL TRADERS
– Percent of Open Interest Longs:71.43.517.3
– Percent of Open Interest Shorts:25.161.95.2
– Net Position:21,465-27,0645,599
– Gross Longs:33,0991,6438,014
– Gross Shorts:11,63428,7072,415
– Long to Short Ratio:2.8 to 10.1 to 13.3 to 1
NET POSITION TREND:
– COT Index Score (3 Year Range Pct):62.829.698.4
– COT Index Reading (3 Year Range):BullishBearishBullish-Extreme
NET POSITION MOVEMENT INDEX:
– 6-Week Change in Strength Index:8.5-8.0-1.6


Euro Currency Futures:

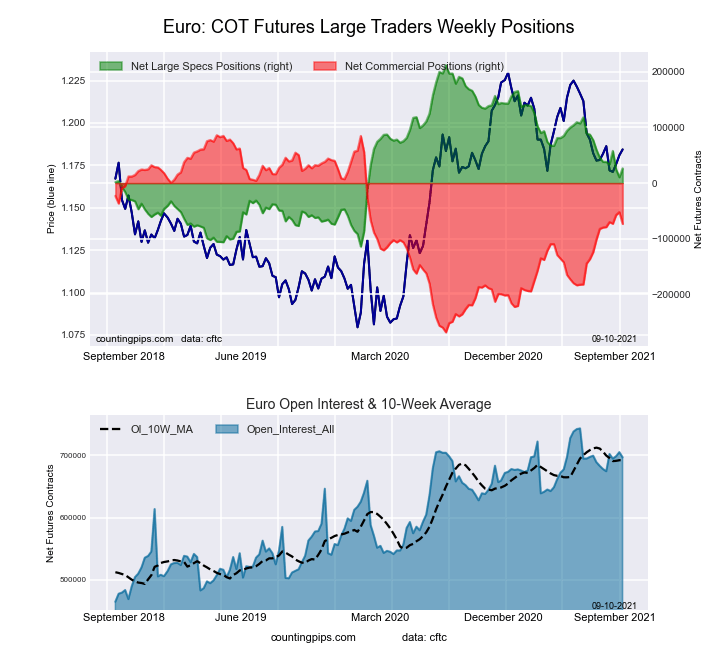
2-Year Treasury Bonds Futures COT ChartThe Euro Currency large speculator standing this week resulted in a net position of 26,308 contracts in the data reported through Tuesday. This was a weekly advance of 15,832 contracts from the previous week which had a total of 10,476 net contracts.

This week’s current strength score (the trader positioning range over the past three years, measured from 0 to 100) shows the speculators are currently Bearish with a score of 43.1 percent. The commercials are Bullish with a score of 55.0 percent and the small traders (not shown in chart) are Bullish with a score of 54.4 percent.

EURO Currency StatisticsSPECULATORSCOMMERCIALSSMALL TRADERS
– Percent of Open Interest Longs:27.357.114.1
– Percent of Open Interest Shorts:23.567.67.4
– Net Position:26,308-73,31647,008
– Gross Longs:189,904397,75598,252
– Gross Shorts:163,596471,07151,244
– Long to Short Ratio:1.2 to 10.8 to 11.9 to 1
NET POSITION TREND:
– COT Index Score (3 Year Range Pct):43.155.054.4
– COT Index Reading (3 Year Range):BearishBullishBullish
NET POSITION MOVEMENT INDEX:
– 6-Week Change in Strength Index:-3.61.88.4


British Pound Sterling Futures:

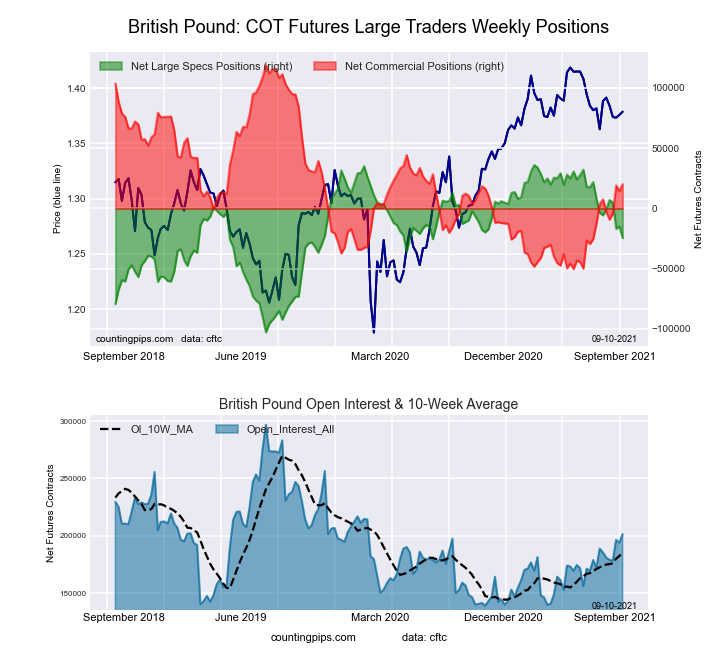
5-Year Treasury Bonds Futures COT ChartThe British Pound Sterling large speculator standing this week resulted in a net position of -24,524 contracts in the data reported through Tuesday. This was a weekly decline of -9,624 contracts from the previous week which had a total of -14,900 net contracts.

This week’s current strength score (the trader positioning range over the past three years, measured from 0 to 100) shows the speculators are currently Bullish with a score of 56.3 percent. The commercials are Bearish with a score of 41.7 percent and the small traders (not shown in chart) are Bullish with a score of 64.5 percent.

BRITISH POUND StatisticsSPECULATORSCOMMERCIALSSMALL TRADERS
– Percent of Open Interest Longs:14.665.915.0
– Percent of Open Interest Shorts:26.855.912.8
– Net Position:-24,52420,2664,258
– Gross Longs:29,348132,78330,118
– Gross Shorts:53,872112,51725,860
– Long to Short Ratio:0.5 to 11.2 to 11.2 to 1
NET POSITION TREND:
– COT Index Score (3 Year Range Pct):56.341.764.5
– COT Index Reading (3 Year Range):BullishBearishBullish
NET POSITION MOVEMENT INDEX:
– 6-Week Change in Strength Index:-13.67.512.9


Japanese Yen Futures:

10-Year Treasury Notes Bonds Futures COT ChartThe Japanese Yen large speculator standing this week resulted in a net position of -62,325 contracts in the data reported through Tuesday. This was a weekly gain of 805 contracts from the previous week which had a total of -63,130 net contracts.

This week’s current strength score (the trader positioning range over the past three years, measured from 0 to 100) shows the speculators are currently Bearish with a score of 31.9 percent. The commercials are Bullish with a score of 71.8 percent and the small traders (not shown in chart) are Bearish with a score of 25.1 percent.

JAPANESE YEN StatisticsSPECULATORSCOMMERCIALSSMALL TRADERS
– Percent of Open Interest Longs:14.574.19.2
– Percent of Open Interest Shorts:45.035.717.2
– Net Position:-62,32578,582-16,257
– Gross Longs:29,704151,58518,896
– Gross Shorts:92,02973,00335,153
– Long to Short Ratio:0.3 to 12.1 to 10.5 to 1
NET POSITION TREND:
– COT Index Score (3 Year Range Pct):31.971.825.1
– COT Index Reading (3 Year Range):BearishBullishBearish
NET POSITION MOVEMENT INDEX:
– 6-Week Change in Strength Index:-1.41.7-2.2


Swiss Franc Futures:

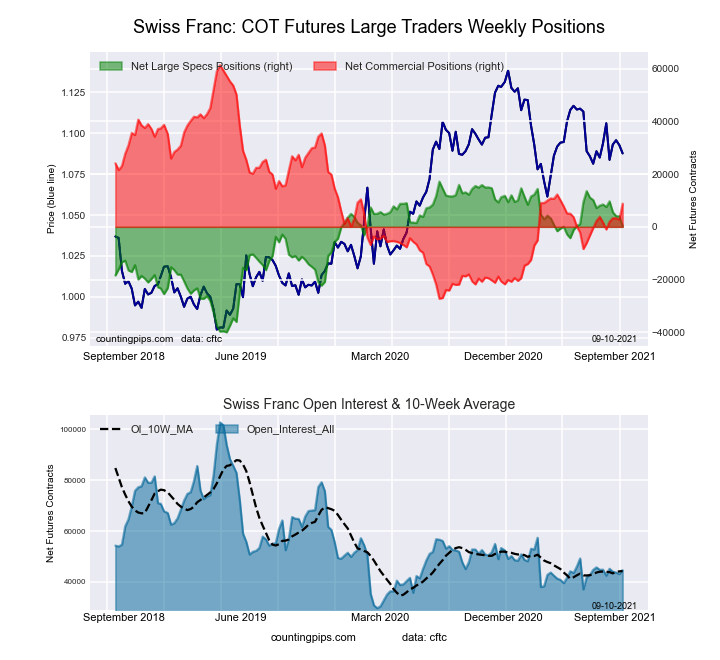
Ultra 10-Year Treasury Notes Bonds Futures COT ChartThe Swiss Franc large speculator standing this week resulted in a net position of 220 contracts in the data reported through Tuesday. This was a weekly reduction of -3,755 contracts from the previous week which had a total of 3,975 net contracts.

This week’s current strength score (the trader positioning range over the past three years, measured from 0 to 100) shows the speculators are currently Bullish with a score of 70.4 percent. The commercials are Bearish with a score of 40.7 percent and the small traders (not shown in chart) are Bearish with a score of 36.8 percent.

SWISS FRANC StatisticsSPECULATORSCOMMERCIALSSMALL TRADERS
– Percent of Open Interest Longs:26.248.124.3
– Percent of Open Interest Shorts:25.728.344.5
– Net Position:2208,789-9,009
– Gross Longs:11,67121,41910,810
– Gross Shorts:11,45112,63019,819
– Long to Short Ratio:1.0 to 11.7 to 10.5 to 1
NET POSITION TREND:
– COT Index Score (3 Year Range Pct):70.440.736.8
– COT Index Reading (3 Year Range):BullishBearishBearish
NET POSITION MOVEMENT INDEX:
– 6-Week Change in Strength Index:-14.58.13.3


Canadian Dollar Futures:

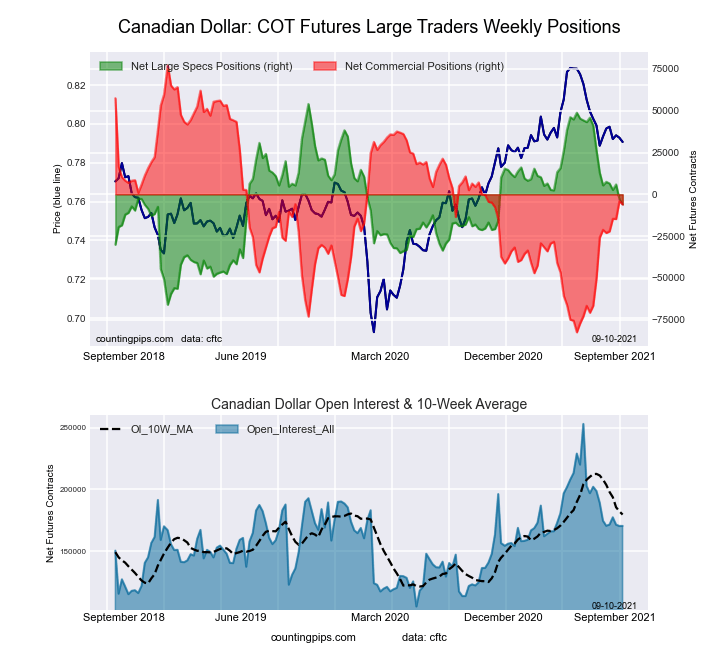
US Year Treasury Notes Long Bonds Futures COT ChartThe Canadian Dollar large speculator standing this week resulted in a net position of -6,010 contracts in the data reported through Tuesday. This was a weekly fall of -3,162 contracts from the previous week which had a total of -2,848 net contracts.

This week’s current strength score (the trader positioning range over the past three years, measured from 0 to 100) shows the speculators are currently Bearish with a score of 50.0 percent. The commercials are Bearish with a score of 47.8 percent and the small traders (not shown in chart) are Bullish with a score of 65.0 percent.

CANADIAN DOLLAR StatisticsSPECULATORSCOMMERCIALSSMALL TRADERS
– Percent of Open Interest Longs:21.555.321.4
– Percent of Open Interest Shorts:25.158.914.3
– Net Position:-6,010-6,08112,091
– Gross Longs:36,70494,31636,407
– Gross Shorts:42,714100,39724,316
– Long to Short Ratio:0.9 to 10.9 to 11.5 to 1
NET POSITION TREND:
– COT Index Score (3 Year Range Pct):50.047.865.0
– COT Index Reading (3 Year Range):BearishBearishBullish
NET POSITION MOVEMENT INDEX:
– 6-Week Change in Strength Index:-9.59.5-5.7


Australian Dollar Futures:

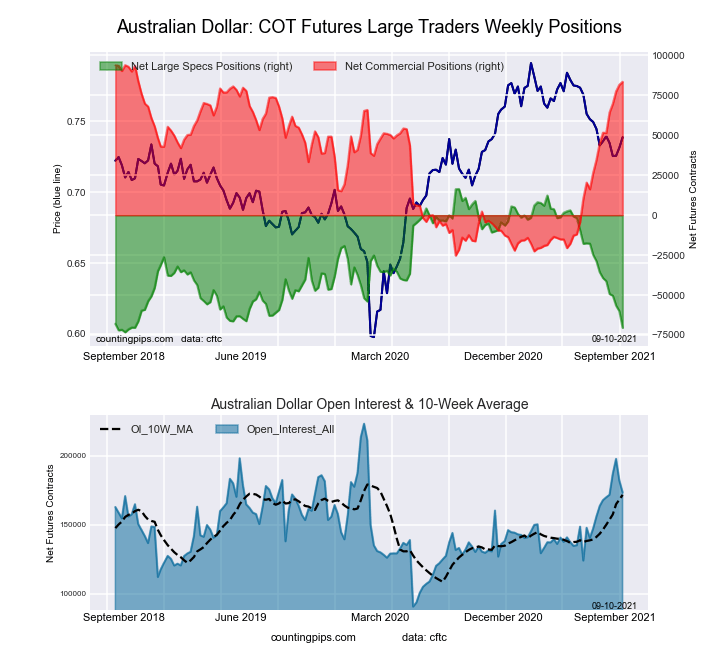
Ultra US Year Treasury Notes Long Bonds Futures COT ChartThe Australian Dollar large speculator standing this week resulted in a net position of -70,488 contracts in the data reported through Tuesday. This was a weekly lowering of -10,410 contracts from the previous week which had a total of -60,078 net contracts.

This week’s current strength score (the trader positioning range over the past three years, measured from 0 to 100) shows the speculators are currently Bearish-Extreme with a score of 3.1 percent. The commercials are Bullish-Extreme with a score of 91.3 percent and the small traders (not shown in chart) are Bearish with a score of 28.3 percent.

AUSTRALIAN DOLLAR StatisticsSPECULATORSCOMMERCIALSSMALL TRADERS
– Percent of Open Interest Longs:18.767.011.5
– Percent of Open Interest Shorts:59.418.919.0
– Net Position:-70,48883,455-12,967
– Gross Longs:32,496116,16419,996
– Gross Shorts:102,98432,70932,963
– Long to Short Ratio:0.3 to 13.6 to 10.6 to 1
NET POSITION TREND:
– COT Index Score (3 Year Range Pct):3.191.328.3
– COT Index Reading (3 Year Range):Bearish-ExtremeBullish-ExtremeBearish
NET POSITION MOVEMENT INDEX:
– 6-Week Change in Strength Index:-34.726.7-1.6


New Zealand Dollar Futures:

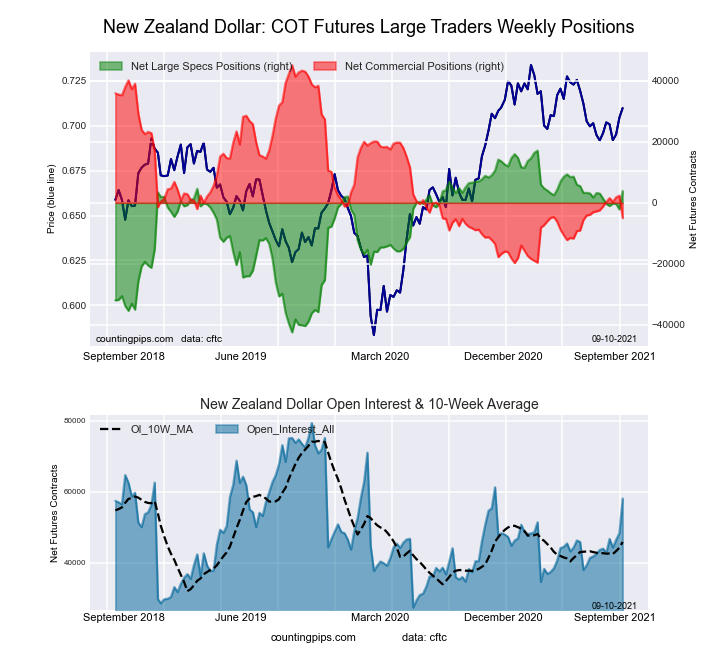
Eurodollar Bonds Futures COT ChartThe New Zealand Dollar large speculator standing this week resulted in a net position of 3,863 contracts in the data reported through Tuesday. This was a weekly boost of 6,004 contracts from the previous week which had a total of -2,141 net contracts.

This week’s current strength score (the trader positioning range over the past three years, measured from 0 to 100) shows the speculators are currently Bullish with a score of 77.7 percent. The commercials are Bearish with a score of 22.7 percent and the small traders (not shown in chart) are Bullish with a score of 65.8 percent.

NEW ZEALAND DOLLAR StatisticsSPECULATORSCOMMERCIALSSMALL TRADERS
– Percent of Open Interest Longs:34.648.58.8
– Percent of Open Interest Shorts:27.957.16.8
– Net Position:3,863-4,9891,126
– Gross Longs:20,07428,1845,104
– Gross Shorts:16,21133,1733,978
– Long to Short Ratio:1.2 to 10.8 to 11.3 to 1
NET POSITION TREND:
– COT Index Score (3 Year Range Pct):77.722.765.8
– COT Index Reading (3 Year Range):BullishBearishBullish
NET POSITION MOVEMENT INDEX:
– 6-Week Change in Strength Index:4.1-5.915.1


Mexican Peso Futures:

Ultra 10-Year Treasury Notes Bonds Futures COT ChartThe Mexican Peso large speculator standing this week resulted in a net position of -17,517 contracts in the data reported through Tuesday. This was a weekly gain of 3,526 contracts from the previous week which had a total of -21,043 net contracts.

This week’s current strength score (the trader positioning range over the past three years, measured from 0 to 100) shows the speculators are currently Bearish-Extreme with a score of 6.0 percent. The commercials are Bullish-Extreme with a score of 92.5 percent and the small traders (not shown in chart) are Bullish with a score of 62.7 percent.

MEXICAN PESO StatisticsSPECULATORSCOMMERCIALSSMALL TRADERS
– Percent of Open Interest Longs:48.843.74.0
– Percent of Open Interest Shorts:58.536.51.4
– Net Position:-17,51712,8654,652
– Gross Longs:88,16878,8107,263
– Gross Shorts:105,68565,9452,611
– Long to Short Ratio:0.8 to 11.2 to 12.8 to 1
NET POSITION TREND:
– COT Index Score (3 Year Range Pct):6.092.562.7
– COT Index Reading (3 Year Range):Bearish-ExtremeBullish-ExtremeBullish
NET POSITION MOVEMENT INDEX:
– 6-Week Change in Strength Index:4.4-5.15.8


Brazilian Real Futures:

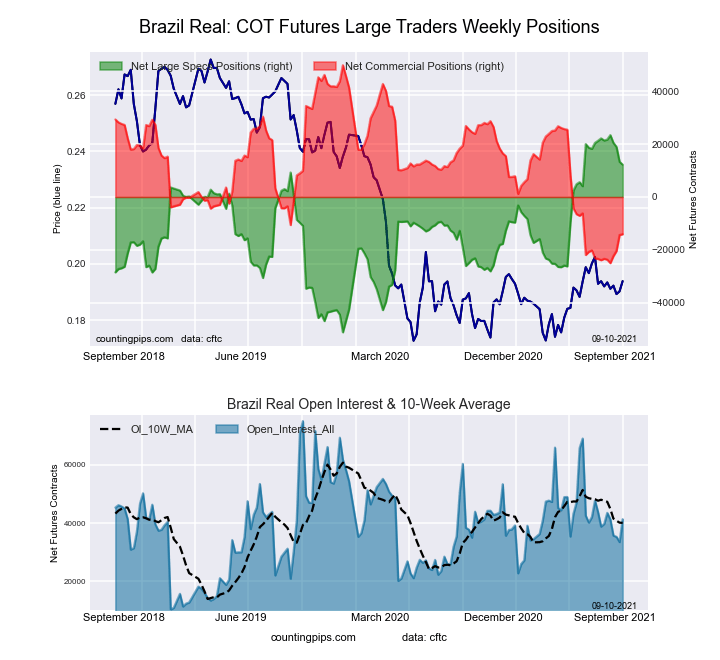
US Year Treasury Notes Long Bonds Futures COT ChartThe Brazilian Real large speculator standing this week resulted in a net position of 12,258 contracts in the data reported through Tuesday. This was a weekly decrease of -1,088 contracts from the previous week which had a total of 13,346 net contracts.

This week’s current strength score (the trader positioning range over the past three years, measured from 0 to 100) shows the speculators are currently Bullish-Extreme with a score of 85.0 percent. The commercials are Bearish-Extreme with a score of 14.6 percent and the small traders (not shown in chart) are Bullish-Extreme with a score of 89.3 percent.

BRAZIL REAL StatisticsSPECULATORSCOMMERCIALSSMALL TRADERS
– Percent of Open Interest Longs:48.836.58.2
– Percent of Open Interest Shorts:19.170.73.7
– Net Position:12,258-14,1161,858
– Gross Longs:20,16515,0783,398
– Gross Shorts:7,90729,1941,540
– Long to Short Ratio:2.6 to 10.5 to 12.2 to 1
NET POSITION TREND:
– COT Index Score (3 Year Range Pct):85.014.689.3
– COT Index Reading (3 Year Range):Bullish-ExtremeBearish-ExtremeBullish-Extreme
NET POSITION MOVEMENT INDEX:
– 6-Week Change in Strength Index:-12.312.4-2.0


Russian Ruble Futures:

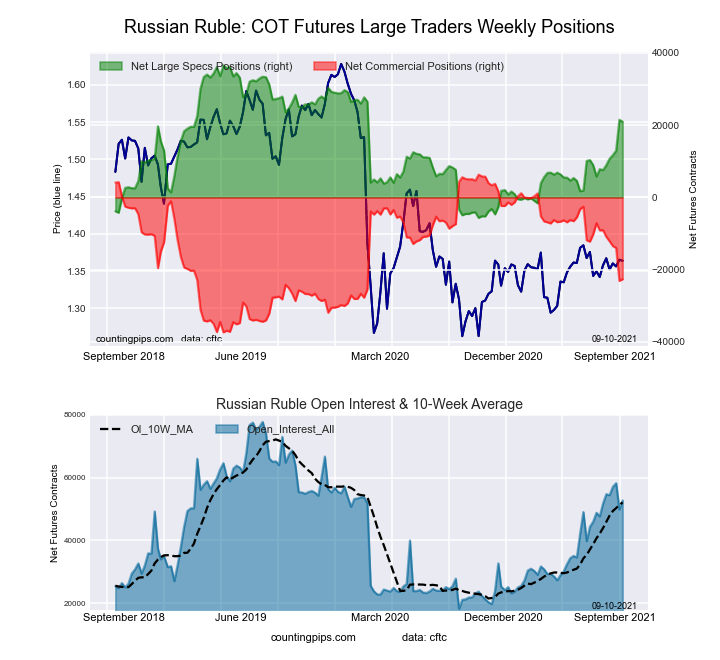
Ultra US Year Treasury Notes Long Bonds Futures COT ChartThe Russian Ruble large speculator standing this week resulted in a net position of 20,945 contracts in the data reported through Tuesday. This was a weekly reduction of -526 contracts from the previous week which had a total of 21,471 net contracts.

This week’s current strength score (the trader positioning range over the past three years, measured from 0 to 100) shows the speculators are currently Bullish with a score of 63.0 percent. The commercials are Bearish with a score of 33.7 percent and the small traders (not shown in chart) are Bullish-Extreme with a score of 91.0 percent.

RUSSIAN RUBLE StatisticsSPECULATORSCOMMERCIALSSMALL TRADERS
– Percent of Open Interest Longs:52.242.55.1
– Percent of Open Interest Shorts:12.485.51.9
– Net Position:20,945-22,6251,680
– Gross Longs:27,49822,4232,704
– Gross Shorts:6,55345,0481,024
– Long to Short Ratio:4.2 to 10.5 to 12.6 to 1
NET POSITION TREND:
– COT Index Score (3 Year Range Pct):63.033.791.0
– COT Index Reading (3 Year Range):BullishBearishBullish-Extreme
NET POSITION MOVEMENT INDEX:
– 6-Week Change in Strength Index:31.6-31.16.6


Bitcoin Futures:

Eurodollar Bonds Futures COT ChartThe Bitcoin large speculator standing this week resulted in a net position of -1,094 contracts in the data reported through Tuesday. This was a weekly reduction of -2 contracts from the previous week which had a total of -1,092 net contracts.

This week’s current strength score (the trader positioning range over the past three years, measured from 0 to 100) shows the speculators are currently Bullish with a score of 73.2 percent. The commercials are Bearish with a score of 21.7 percent and the small traders (not shown in chart) are Bearish with a score of 29.5 percent.

BITCOIN StatisticsSPECULATORSCOMMERCIALSSMALL TRADERS
– Percent of Open Interest Longs:62.65.427.8
– Percent of Open Interest Shorts:79.17.19.6
– Net Position:-1,094-1151,209
– Gross Longs:4,1703601,850
– Gross Shorts:5,264475641
– Long to Short Ratio:0.8 to 10.8 to 12.9 to 1
NET POSITION TREND:
– COT Index Score (3 Year Range Pct):73.221.729.5
– COT Index Reading (3 Year Range):BullishBearishBearish
NET POSITION MOVEMENT INDEX:
– 6-Week Change in Strength Index:13.5-78.38.7


Article By CountingPips.comReceive our weekly COT Reports by Email

*COT Report: The COT data, released weekly to the public each Friday, is updated through the most recent Tuesday (data is 3 days old) and shows a quick view of how large speculators or non-commercials (for-profit traders) were positioned in the futures markets.

The CFTC categorizes trader positions according to commercial hedgers (traders who use futures contracts for hedging as part of the business), non-commercials (large traders who speculate to realize trading profits) and nonreportable traders (usually small traders/speculators).

Find CFTC criteria here: (http://www.cftc.gov/MarketReports/CommitmentsofTraders/ExplanatoryNotes/index.htm).

USDCAD Upside Correction Might Be Complete

By Orbex

Price action on USDCAD hints at an upcoming bullish 5-wave impulse in correction wave w of a triple zigzag.

With three-thirds of a combination in minute wave four completed, we expect prices to ascend.

Once the minuette wave (z) ends, a correction in x should follow. Thereafter, markets might appreciate in wave (z) towards $1.312. At that level, wave (z) will be equal to wave (y).

USDCAD

Another perspective suggests that the minute wave four has ended as a double zigzag (w)-(x)-(y). This assumes that the slide from the $1.3212 top is the final impulse wave ⓥ.

To confirm the 5-wave move markers should decline in waves (iii)-(iv)-(v). Analysts expect impulse (iii) to finish at the previous low of $1.201.

And after a slight correction in the sub-wave (iv), prices might continue to fall in the sub-wave (v) to lower territories.


Orbex-LogoArticle by Orbex

Orbex is a fully licensed broker that was established in 2011. Founded with a mission to serve its traders responsibly and provides traders with access to the world’s largest and most liquid financial markets. www.orbex.com

Intraday Market Analysis – The Euro Attempts To Bounce

By Orbex

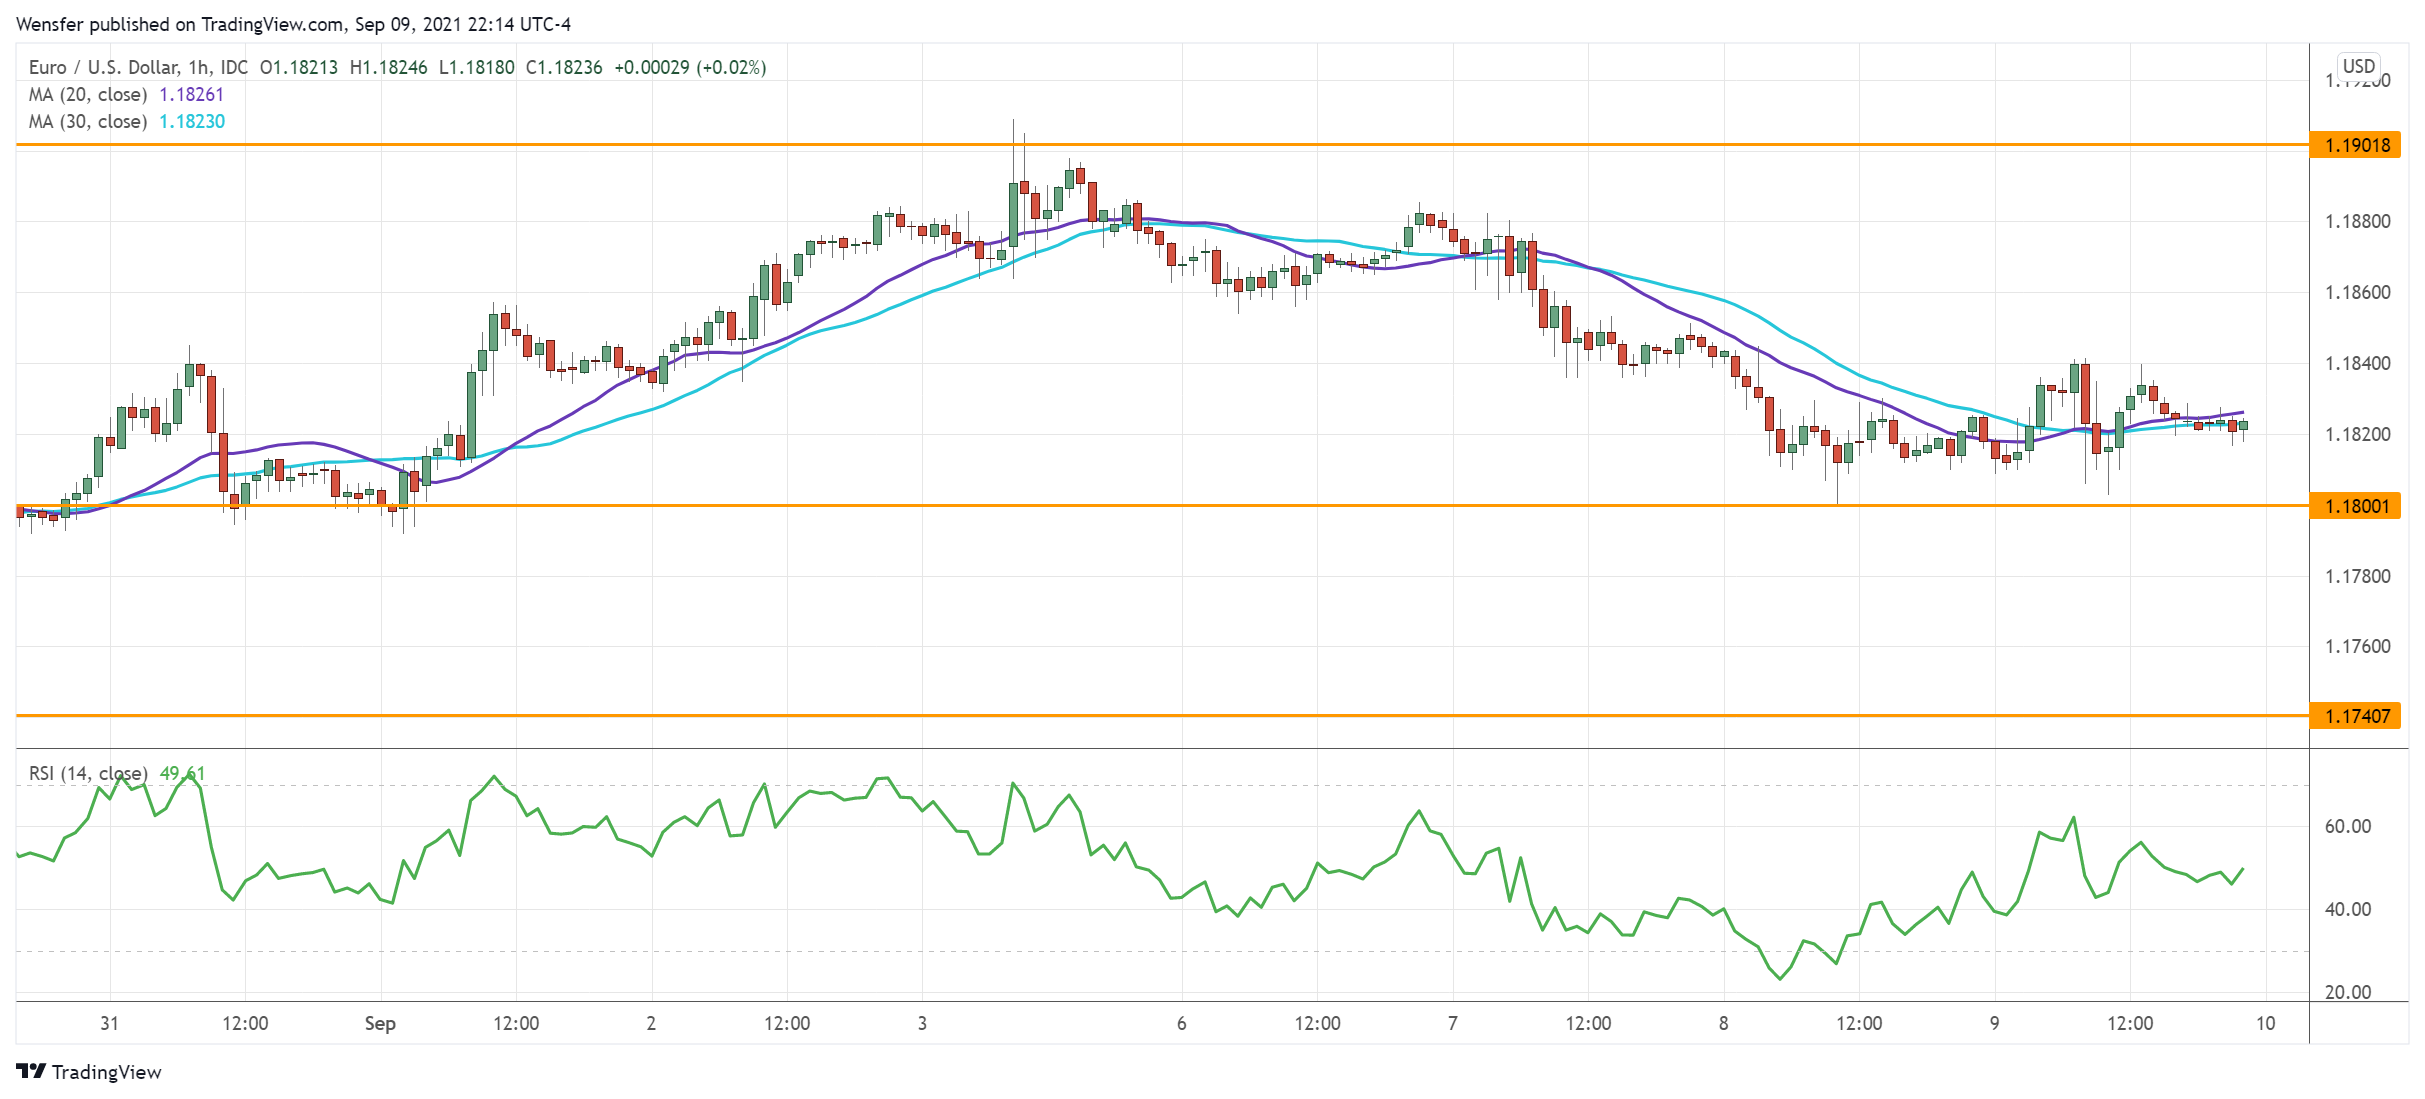
EURUSD tests support

EURUSD

The euro steadied after the ECB signaled it would reduce its bond-buying under PEPP.

The pair is looking for support after it met strong selling pressure at the daily resistance near 1.1900. An oversold RSI has attracted buying interest as the price tests the support at 1.1800.

A rebound above the double top (1.1900) would put the single currency back on track and extend the rally to 1.1970.

A close below said support would deepen the correction to 1.1740 at the origin of the late August breakout.

US 30 struggles to rebound

US30

The Dow Jones 30 recoups losses over new low jobless claims. Price action’s struggle near the top at 35630 suggests a lack of commitment for a new high.

The subsequent drop below the consolidation range (35200) has prompted short-term buyers to take the exit. However, an oversold RSI has drawn a buy-the-dips crowd.

After a bounce above 35150, the index will need to clear 35400 before the rally could resume. 34600 is critical support on the daily chart to keep the bullish bias valid.

USOIL consolidates gains

USOIL

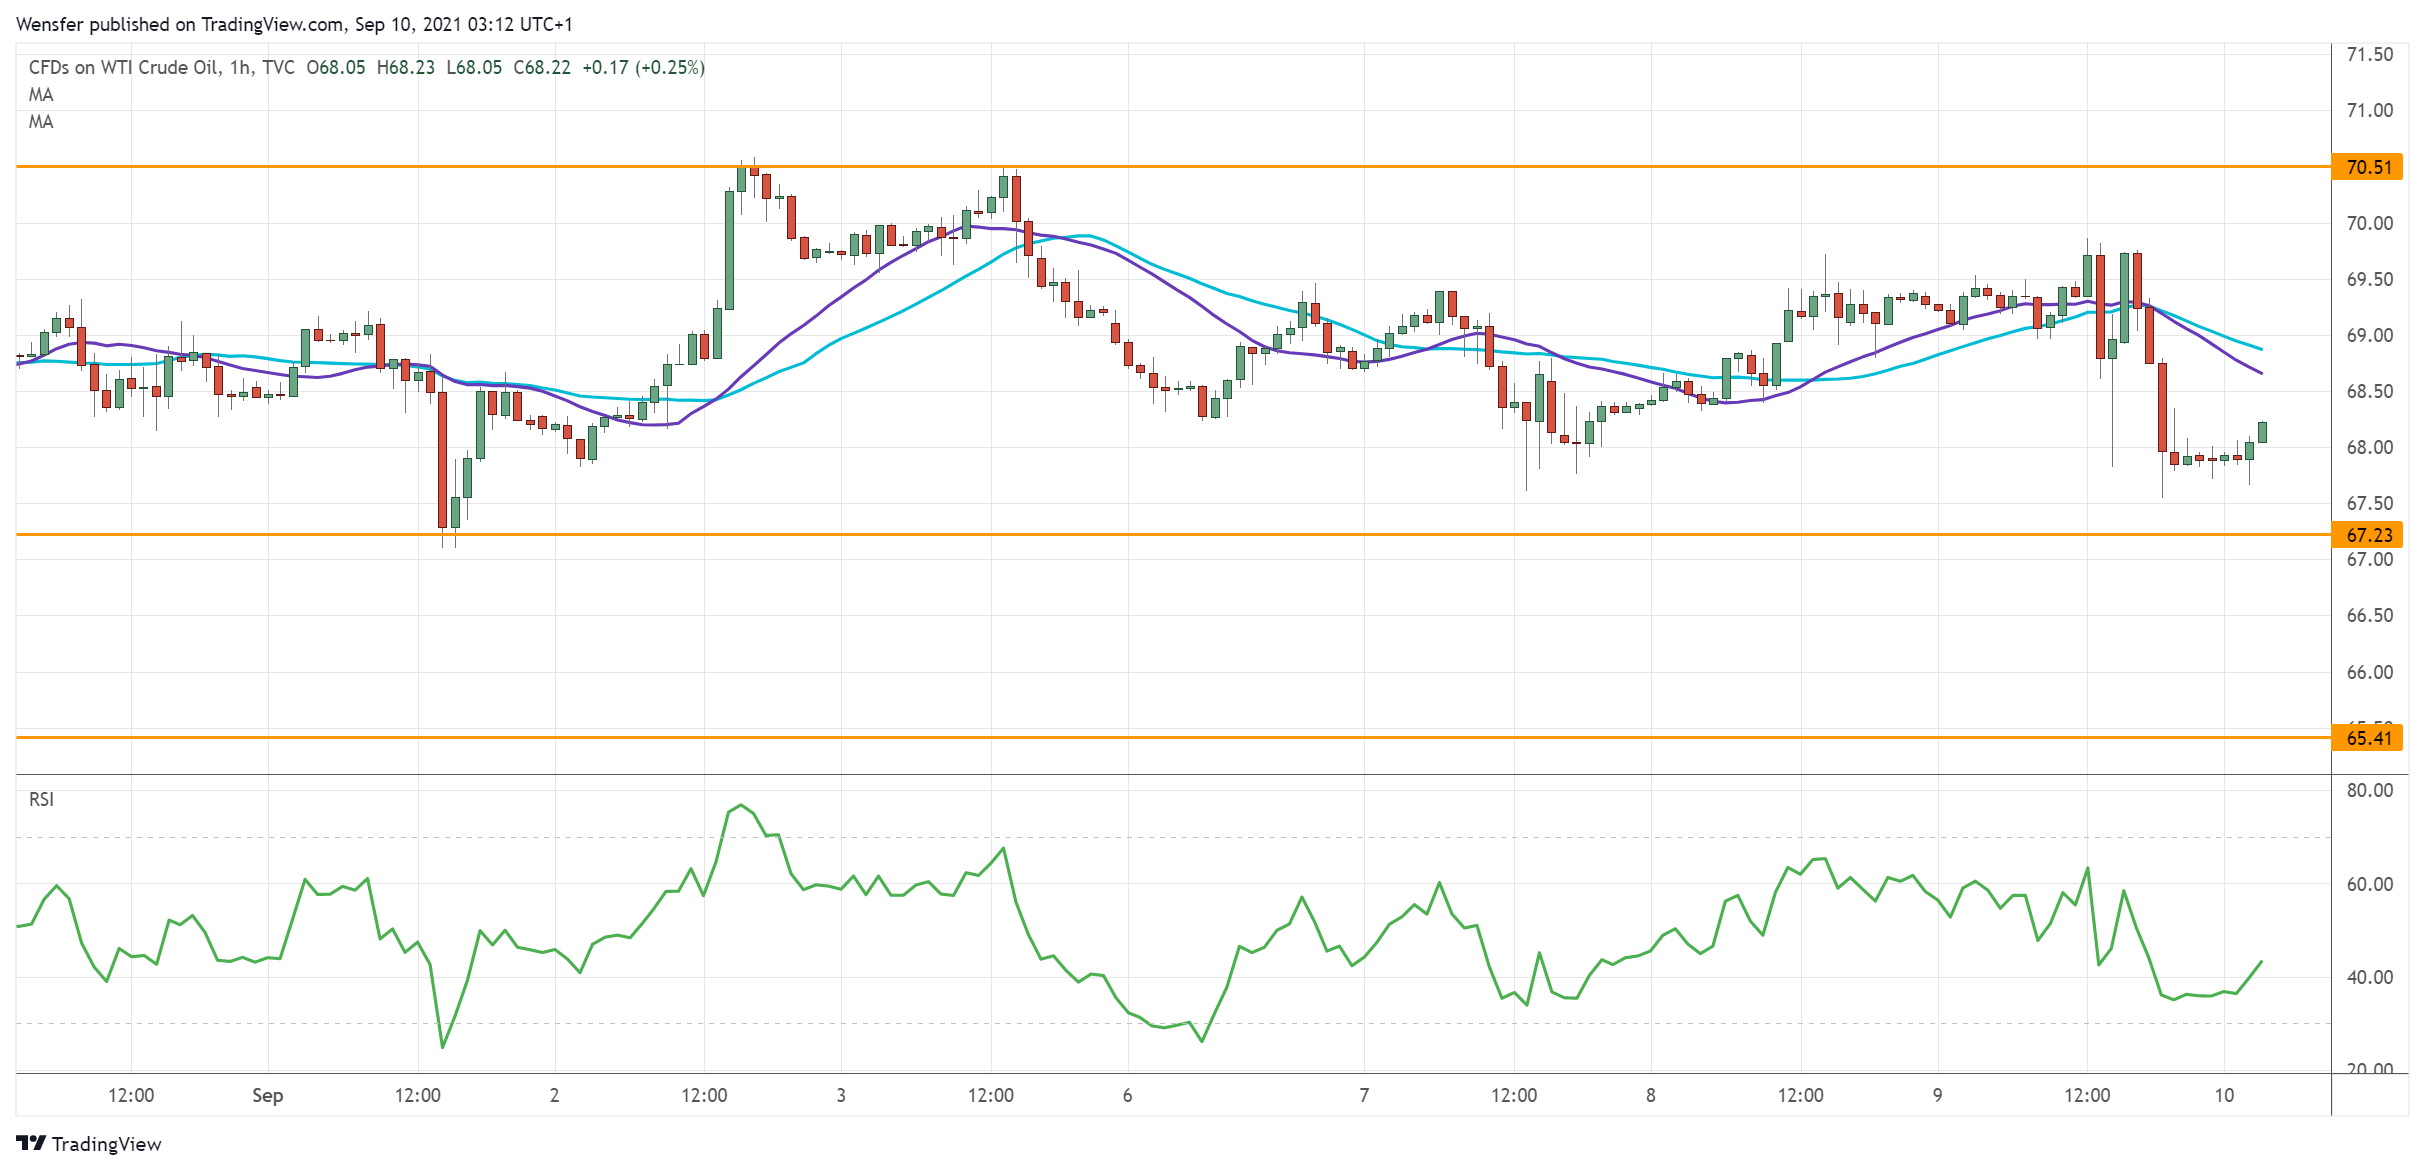
WTI crude tumbled after the EIA reported only a slight decrease in stockpiles.

Sentiment has shifted to the bullish side after a recovery above the daily resistance at 69.50. The sideways action has allowed buyers to hold onto recent gains.

The RSI’s double-dip in the oversold area has soaked up bids with 67.20 as fresh support.

If the bulls succeed in lifting the hurdle at 70.50, 74.10 could be the next target when momentum makes its return. 65.40 would be the second line of defense in case of a pullback.


Orbex-LogoArticle by Orbex

Orbex is a fully licensed broker that was established in 2011. Founded with a mission to serve its traders responsibly and provides traders with access to the world’s largest and most liquid financial markets. www.orbex.com

The “greenback” is clinging to stability. Overview for 10.09.2021

Article By RoboForex.com

The major currency pair remains neutral on Friday and prepares to respond to the news.

EURUSD is consolidating before the weekend. The current quote for the instrument is 1.1830.

During its September meeting, the European Central Bank left the benchmark interest rate intact at zero. The rates will remain the way they are until inflation in the Euro Area reaches the target of 2%. The regulator said that purchases under the PEPP would continue at €20 billion every month at least until March 2022 or until the coronavirus pandemic was over. The total volume of the program is € 1.85 trillion.

The ECB Governor Christine Lagarde is sure that the economy will continue recovering and the GDP will regain its losses incurred because of the pandemic by the year-end. The GDP expectations for 2021 were revised upwards from 4.6% to 50%, for 2022 – downwards from 4.7% to 4.6%. According to the regulator’s estimations, inflation this year will be 2.2% instead of 1.9%, in 2022 and 2023 – 1.7% and 1.5% respectively.

The ECB believes that the price pressure is slowly increasing and the recent inflation boost happened because of the energy price surge. The employment sector is also improving, while the business sentiment is going up and stimulating the investment flow.

The regulator sees economic progress in some sectors and that’s good news.

Later today, Christine Lagarde will give some more comments. Apart from that, some European countries will report on their inflation. In the late afternoon, the USA is scheduled to publish the Producer Price Index for August.

Article By RoboForex.com

Attention!
Forecasts presented in this section only reflect the author’s private opinion and should not be considered as guidance for trading. RoboForex LP bears no responsibility for trading results based on trading recommendations described in these analytical reviews.