Archive for Forex and Currency News – Page 226

AUDUSD Final Leg Of Triple Zigzag

By Orbex

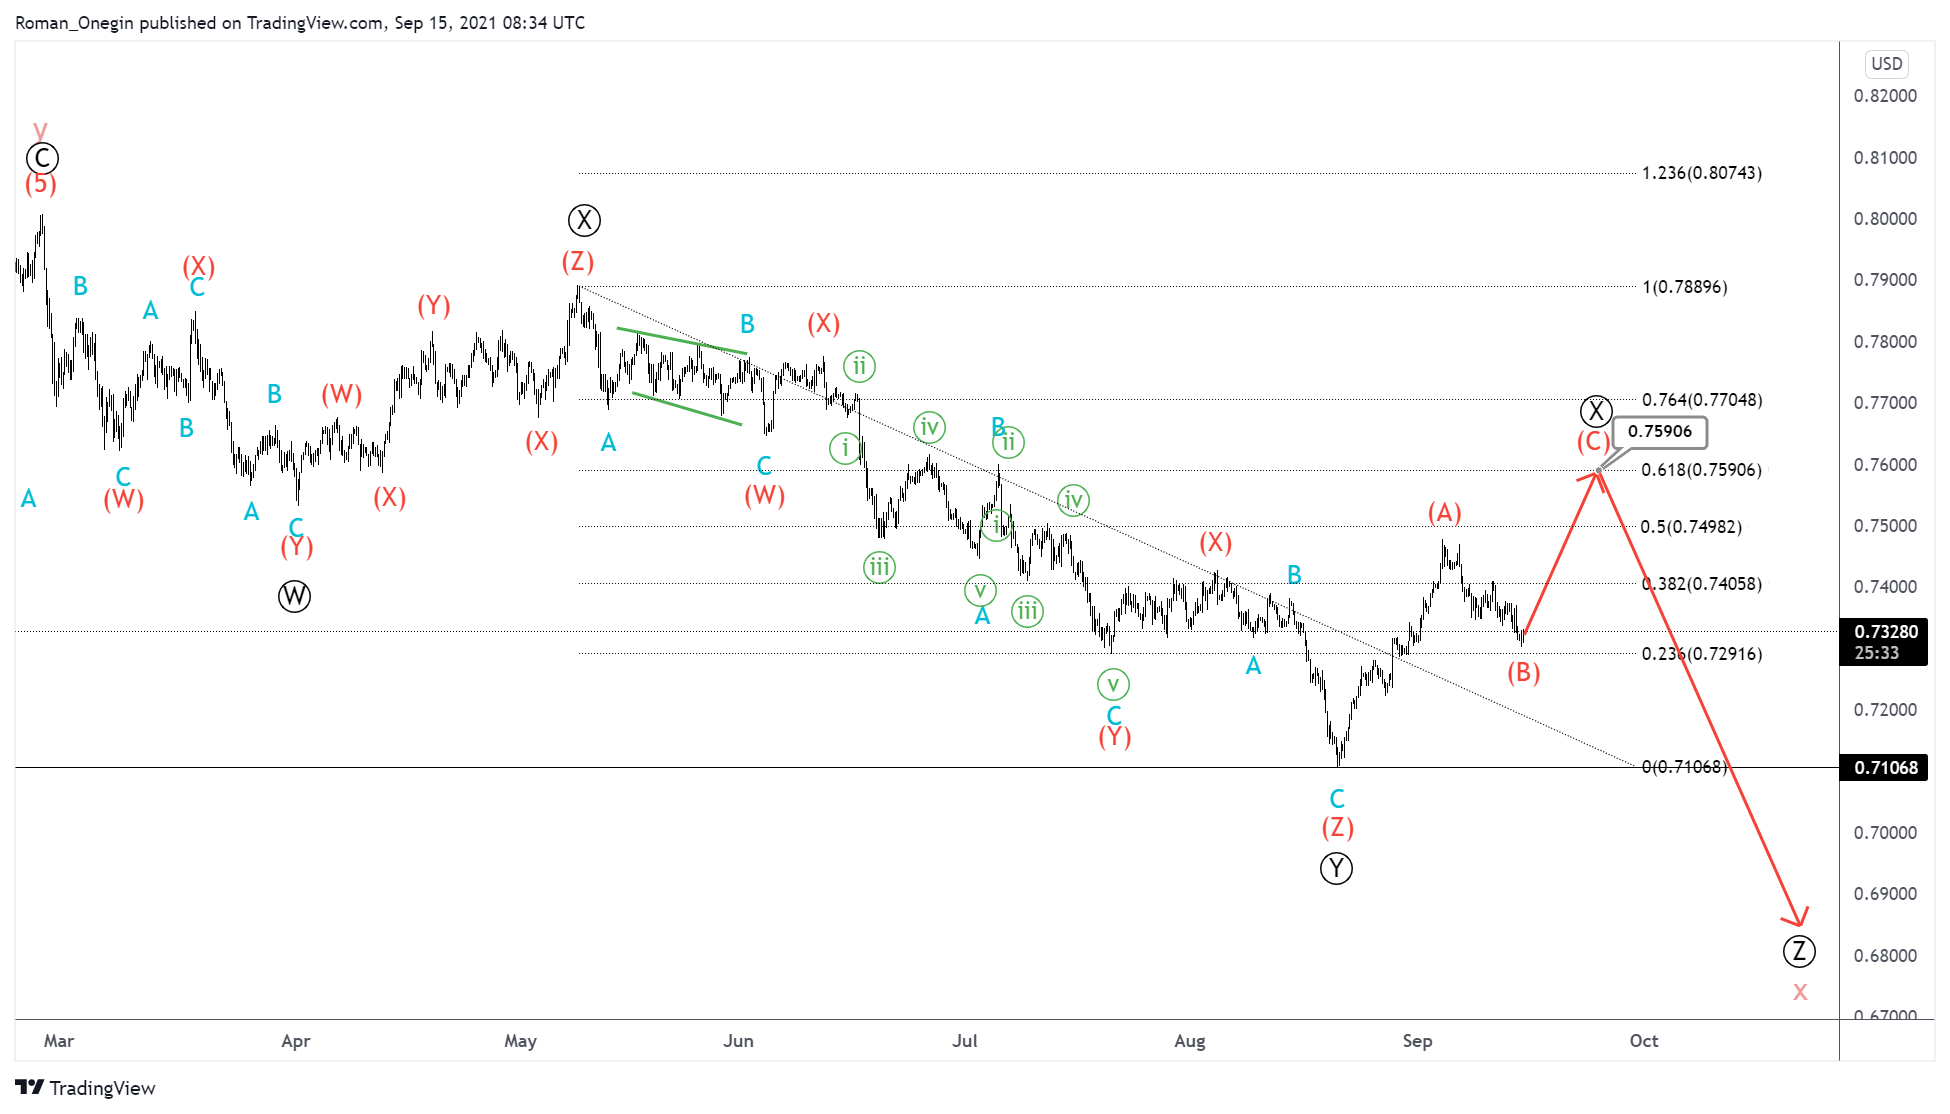
The structure of the AUDUSD pair suggests the construction of a triple zigzag consisting of cycle sub-waves w-x-y-x-z.

On the chart, we can see the end of the actionary wave y. After this, the market formed a bearish intervening wave x. It is likely that this wave has ended, as it represents a double zigzag of the primary degree.

We are currently in the initial part of the final actionary wave z. It will most likely take the form of a double combination, as shown on the chart.

In the short term, we expect the construction of a double zigzag Ⓦ-Ⓧ-Ⓨ near 0.787. At that level, wave z will be at 76.4% of wave y.

AUDUSD

It is worth considering an alternative scenario, in which the formation of the cycle intervening wave x is not complete yet.

We can assume that it takes the form of a triple zigzag Ⓦ-Ⓧ-Ⓨ-Ⓧ-Ⓩ. Perhaps soon we will see the end of the primary intervening wave Ⓧ near the level of 0.759, where it will be at 61.8% of wave Ⓨ.

Then the primary wave Ⓩ may send the price down significantly below the maximum of 0.710.


Orbex-LogoArticle by Orbex

Orbex is a fully licensed broker that was established in 2011. Founded with a mission to serve its traders responsibly and provides traders with access to the world’s largest and most liquid financial markets. www.orbex.com

Intraday Market Analysis – USD Attempts Rebound

By Orbex

USDCHF seeks support

USDCHF

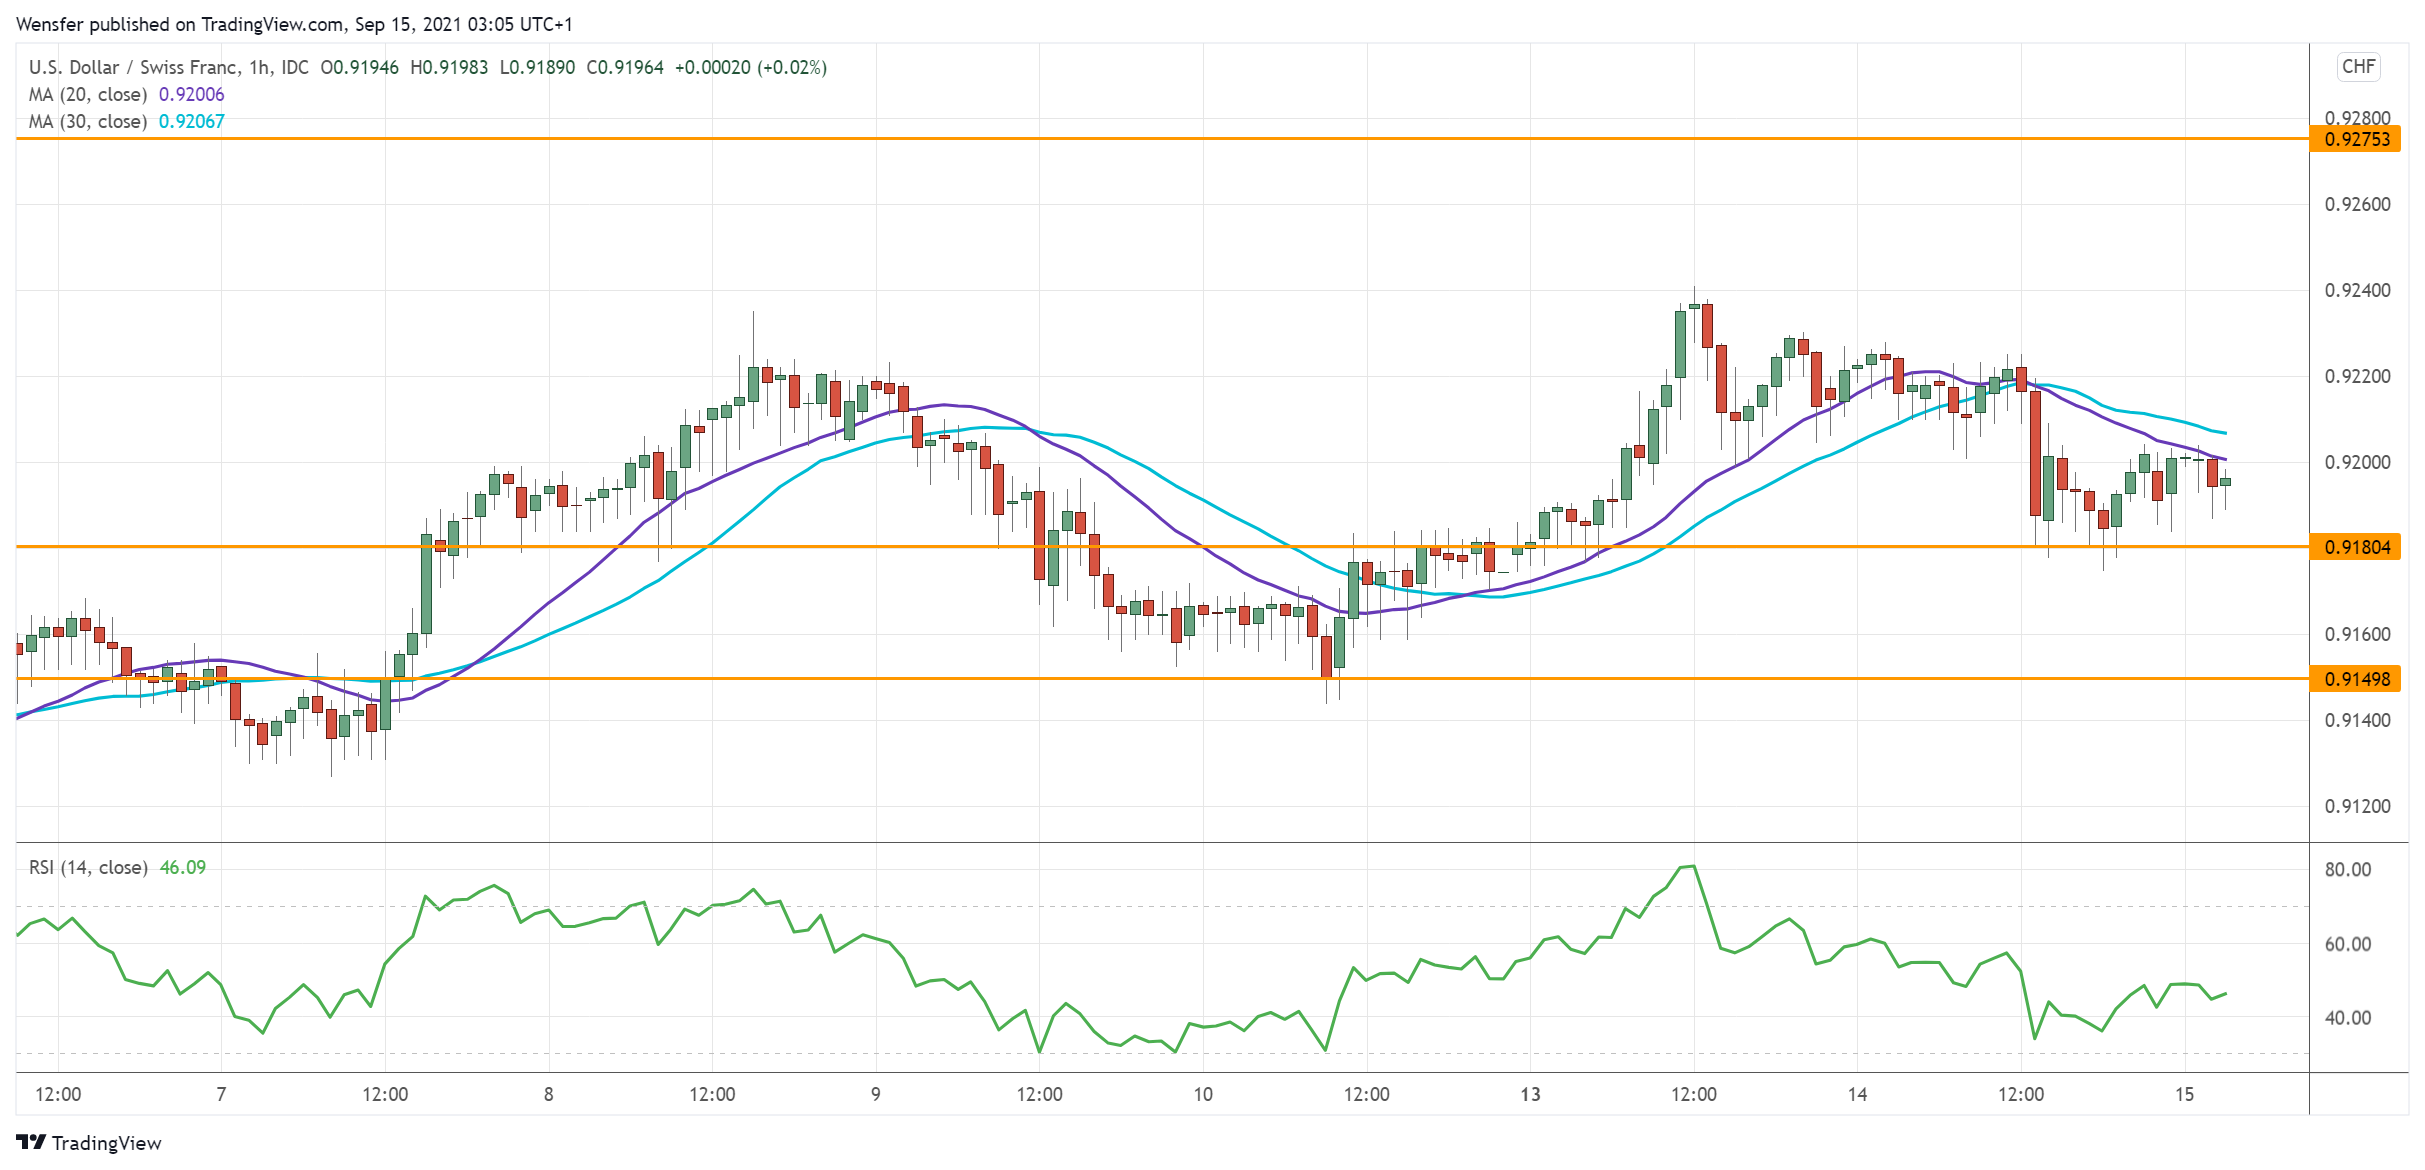
The US dollar initially tumbled after a minor drop in August’s core CPI. However, the pair can capitalize on strong buying interest from the trough near 0.9150.

A tentative break of August’s high at 0.9240 suggests that buyers are in control of price action. Though an overbought RSI has tempered the bullish drive, the latest pullback to 0.9180 can be an accumulation phase.

A rebound may lift bids to July’s high at 0.9275. A breach of that ceiling would attract momentum buying and resume the greenback’s rally.

XAUUSD bounces off demand zone

XAUUSD

Gold surged thanks to a decline in Treasury yields. The precious metal had met stiff selling pressure at the triple top (1830) from the daily chart.

Short-term sentiment has turned positive after a week-long consolidation above the demand area of 1780. The break above 1803 would prompt the bears to cover their bets. An overbought RSI may trigger a temporary pullback.

A rebound would challenge the critical level of 1830 once again, where a bullish breakout may resume the five-week-long rally.

US 30 breaks support

US30

The Dow Jones 30 retreated as last month’s US inflation remained above the Fed’s target. The index was bought out of the dip over the daily support at 34580.

The rebound turned out to be short-lived after a breakout invalidated this key floor. A bearish MA cross indicates that sentiment has become increasingly downbeat.

The psychological level (34000) from last July would be the next target. On the upside, 34950 is a fresh resistance where sellers would be eager to erase any rebound.


Orbex-LogoArticle by Orbex

Orbex is a fully licensed broker that was established in 2011. Founded with a mission to serve its traders responsibly and provides traders with access to the world’s largest and most liquid financial markets. www.orbex.com

Has US CPI peaked?

By The Market Research Team, ForexTime

The big risk event this week has seen US price pressures slow as re-opening hotspots ease. The headline rose 0.3% m/m which was one-tenth below the 0.4% estimate, while the core rose a mere 0.1% with analysts forecasting a 0.3% rise. The y/y rates also moderated, to 5.3% from 5.4% for the headline and 4% form 4.3% in the core.

Used car prices – one of the now well-known drivers of higher prices – fell 1.5% which was the largest drop since November 2016 and ended a series of five straight monthly increases. The biggest rises were in energy and food prices which may hit consumer spending going forward.

But many analysts believe prices will remain elevated and sticky. Firms are finding it easier to raise prices, supply bottlenecks are still apparent and housing costs may be the next big driver of higher costs. Bloomberg noted this week that consensus estimates for inflation through Q2-2022 have risen in each of their last three monthly surveys. Wage pressures are also potentially rising now as the demand for workers is outstripping supply.

All eyes will be on the Fed’s updated dot plot which we will see at next week’s critical FOMC meeting.

USD unmoved on softer data

King dollar did move lower after the inflation numbers but regained its poise to close at marginally higher on the DXY. The index is currently trading around the 50-day moving average with long upper and lower shadows on a series of candles over the last few sessions signalling a sense of indirection.

Prices will need to move either above 92.89 or below 92.32 to break out of the current indecision. The markets could be in wait-and-see mode until next week.

Chinese data disappoints

We had a raft of data out of China overnight, which showed that businesses are still grappling with localised lockdowns, supply bottlenecks and high raw material costs. Retail sales grew at the slowest pace since August 2020 and industrial output rose at a weaker pace from July.

The S&P500 is now approaching its trusty 50-day moving average which has acted as firm support on numerous occasions since the pandemic crisis began. Prices have rarely dropped below this indicator for more than a couple of sessions. Similarly, the index hasn’t closed below the 21- day moving average for three days in a row since the mid-May correction.


UK inflation surges, strong UK jobs support GBP

UK CPI jumped up to 3.2% from 2.0% seen in July primarily due to base effects. Supply constraints also added to the mix, but both these factors are set to ease in the medium term as the reopening of the economy sees a move to services from goods. Yesterday’s UK unemployment held steady at 4.6% as the data gave us a glimpse of how the labour market will react to the tapering of the furlough scheme.

GBP moved higher yesterday beyond 1.39 and up to the 100-day moving average. But dollar strength kicked in and pushed prices back near to the 200-day SMA support at 1.3824.

We get US retail sales out tomorrow with Delta variant concerns potentially weighing on sales and the impact of stimulus checks fading.


Disclaimer: The content in this article comprises personal opinions and should not be construed as containing personal and/or other investment advice and/or an offer of and/or solicitation for any transactions in financial instruments and/or a guarantee and/or prediction of future performance. ForexTime (FXTM), its affiliates, agents, directors, officers or employees do not guarantee the accuracy, validity, timeliness or completeness, of any information or data made available and assume no liability as to any loss arising from any investment based on the same.


Forex-Time-LogoArticle by ForexTime

ForexTime Ltd (FXTM) is an award winning international online forex broker regulated by CySEC 185/12 www.forextime.com

Fibonacci Retracements Analysis 14.09.2021 (EURUSD, USDJPY)

Article By RoboForex.com

EURUSD, “Euro vs US Dollar”

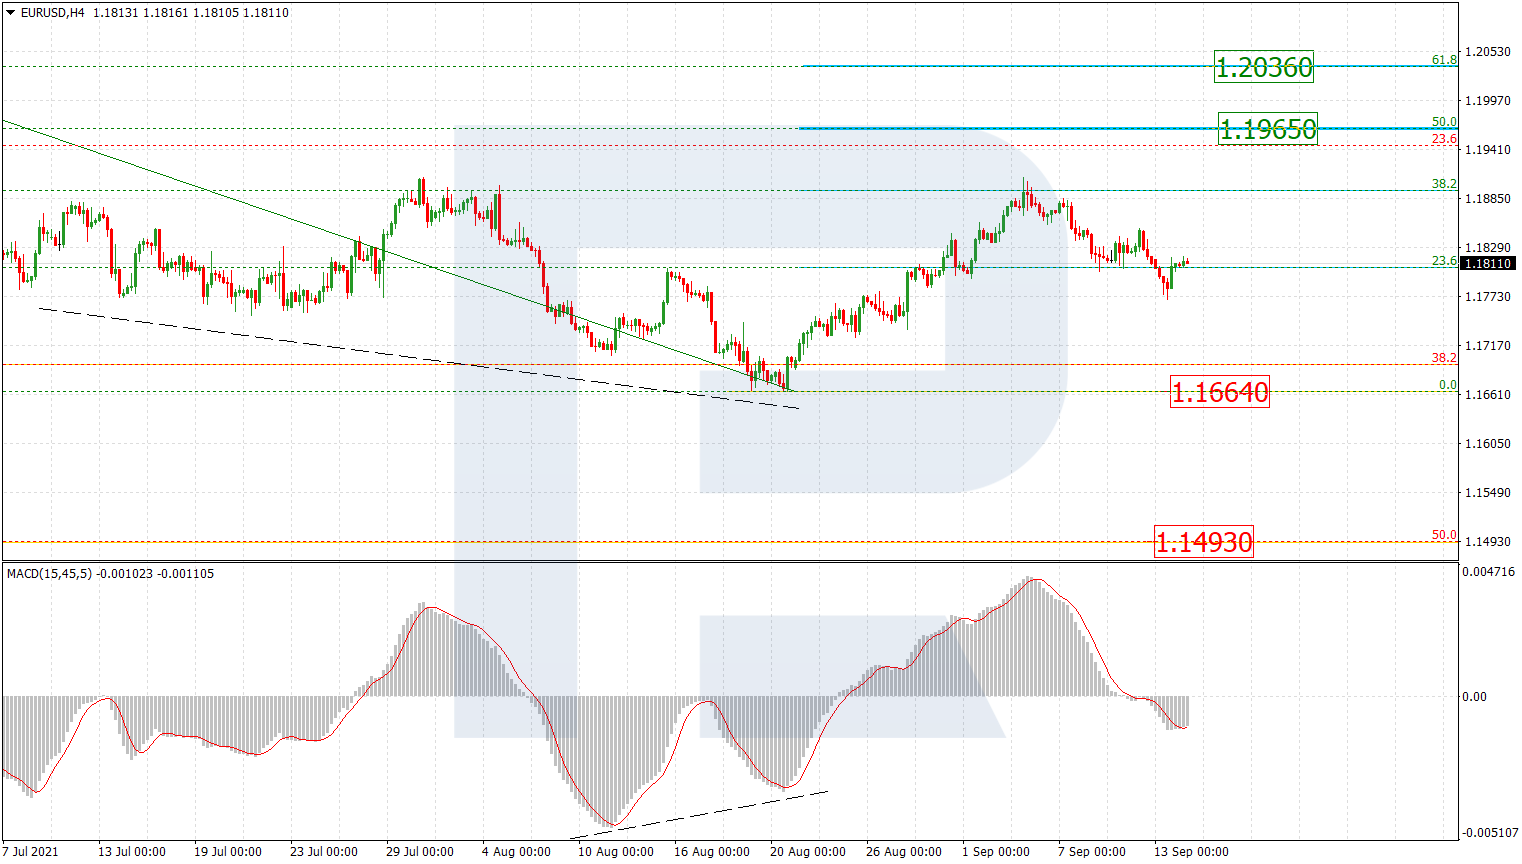
As we can see in the H4 chart, after completing the correctional uptrend at 38.2% fibo, the asset is moving downwards. Such a situation may imply a possible descending wave to break the low at 1.1664 and then reach the long-term 50.0% fibo at 1.1493. However, this scenario should be considered as an alternative one. The main trading idea suggests that EURUSD may complete this decline and start another growth to reach 50.0% and 61.8% fibo at 1.1965 and 1.2036 respectively.

EURUSD_H4
Risk Warning: the result of previous trading operations do not guarantee the same results in the future

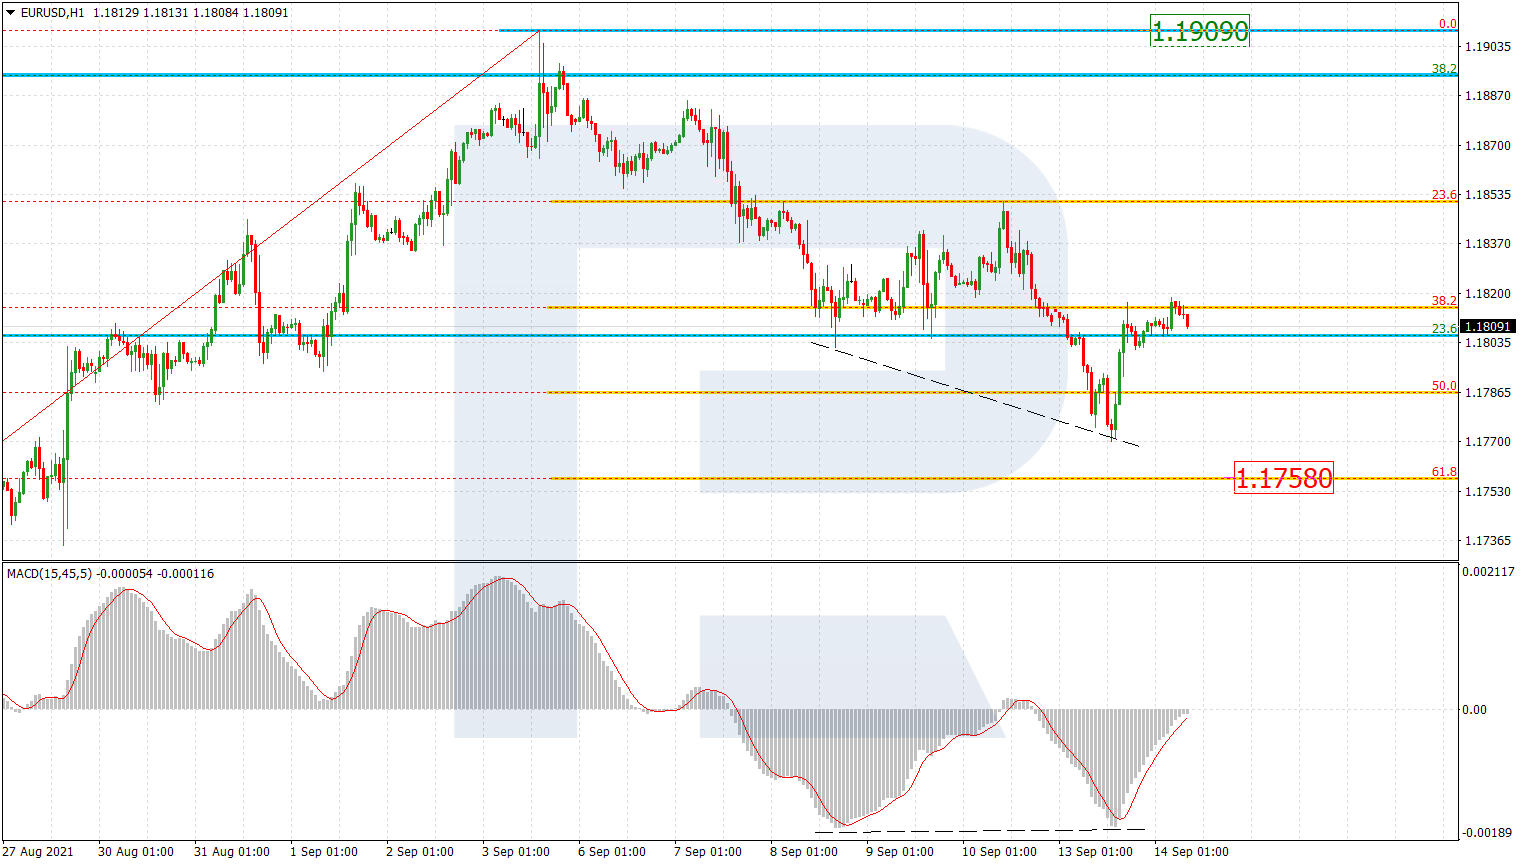
The H1 chart shows the descending correction, which, after reaching 50.0% fibo, was followed by a new pullback forced by convergence on MACD. The pullback may be over soon and the asset is highly likely to start another descending impulse towards 61.8% fibo at 1.1758. Only after that, we can expect a new wave to the upside to reach the high at 1.1909.

EURUSD_H1
Risk Warning: the result of previous trading operations do not guarantee the same results in the future

USDJPY, “US Dollar vs. Japanese Yen”

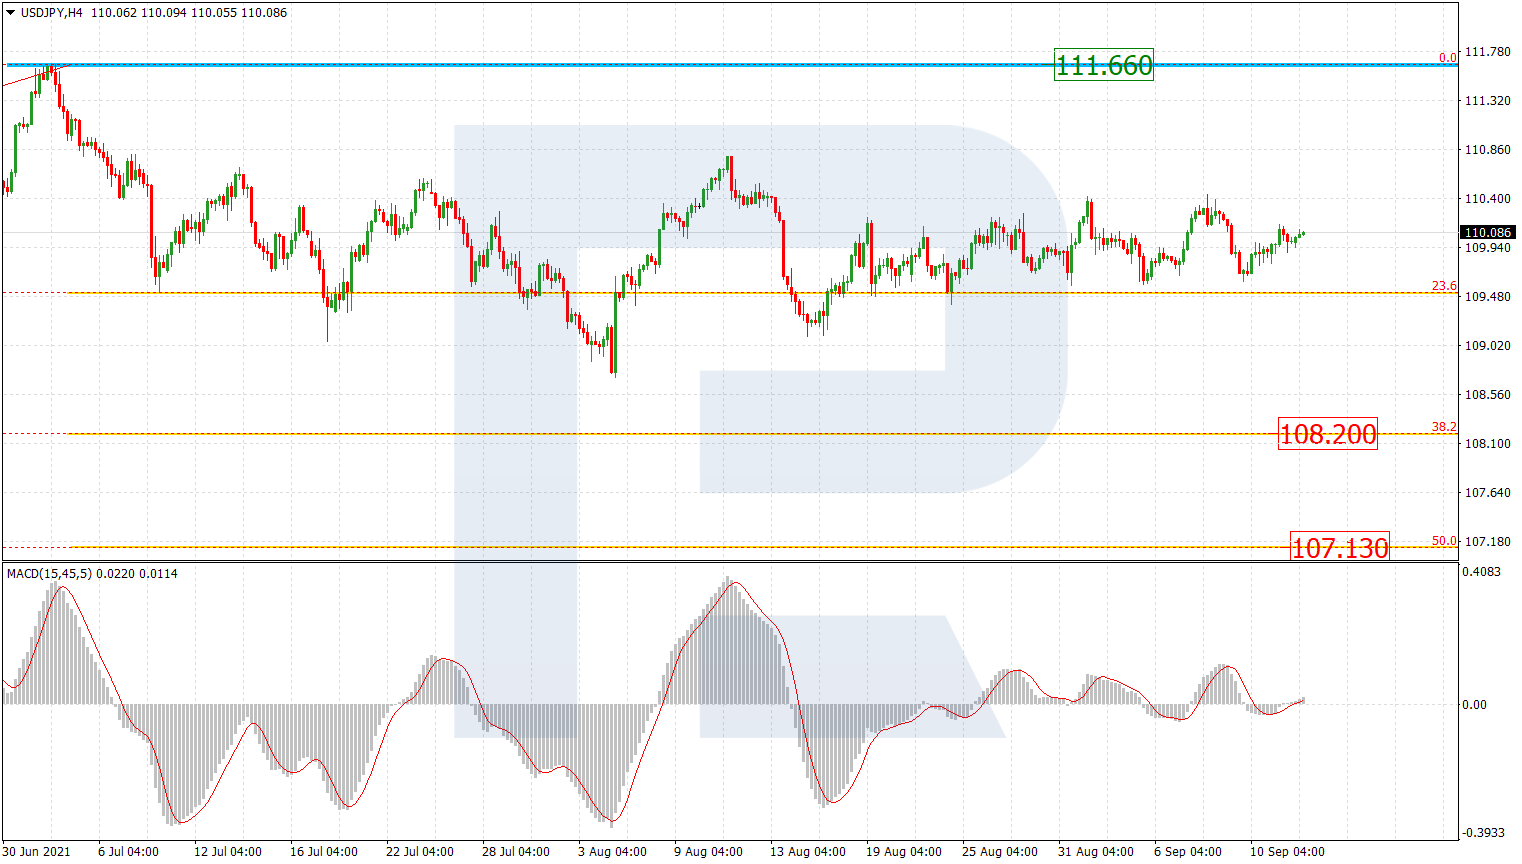
As we can see in the H4 chart, the situation hasn’t changed much. The asset is still consolidating above 23.6% fibo. Expectations remain the same – the pair may break this range to the downside and start a new wave to the downside towards 38.2% and 50.0% fibo at 108.20 and 107.13 respectively. The resistance is still the high at 111.66.

USDJPY_H4
Risk Warning: the result of previous trading operations do not guarantee the same results in the future

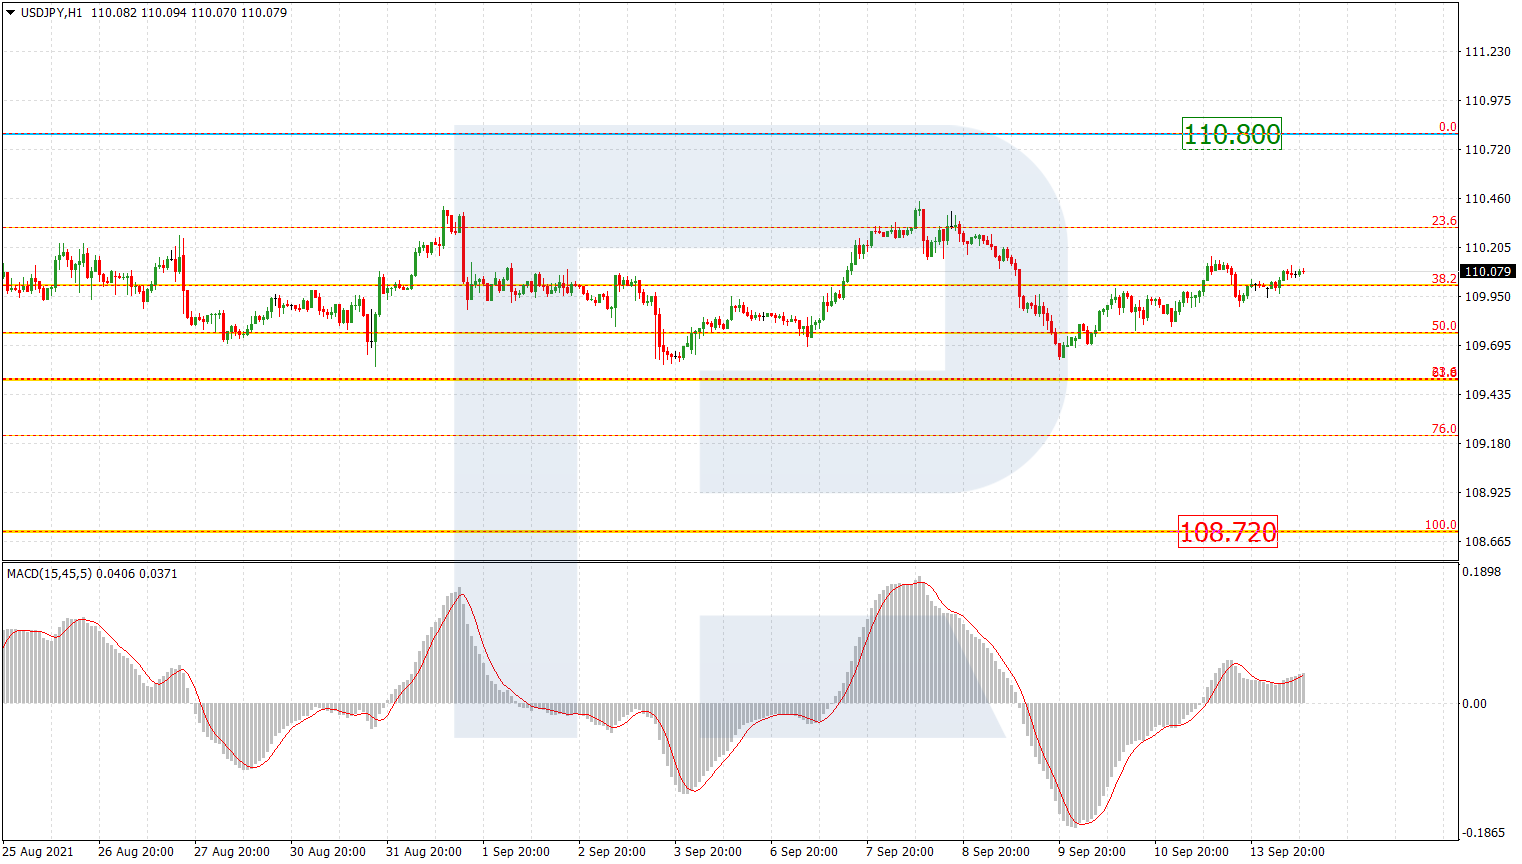
The H1 chart shows that the price is stuck between 110.80 and 108.72. On a smaller scale – between 23.6% and 61.8% fibo. The main scenario implies that the pair may grow towards 110.80, rebound from it, and resume trading downwards.

USDJPY_H1

Article By RoboForex.com

Attention!
Forecasts presented in this section only reflect the author’s private opinion and should not be considered as guidance for trading. RoboForex LP bears no responsibility for trading results based on trading recommendations described in these analytical reviews.

Murrey Math Lines 14.09.2021 (AUDUSD, NZDUSD)

Article By RoboForex.com

AUDUSD, “Australian Dollar vs US Dollar”

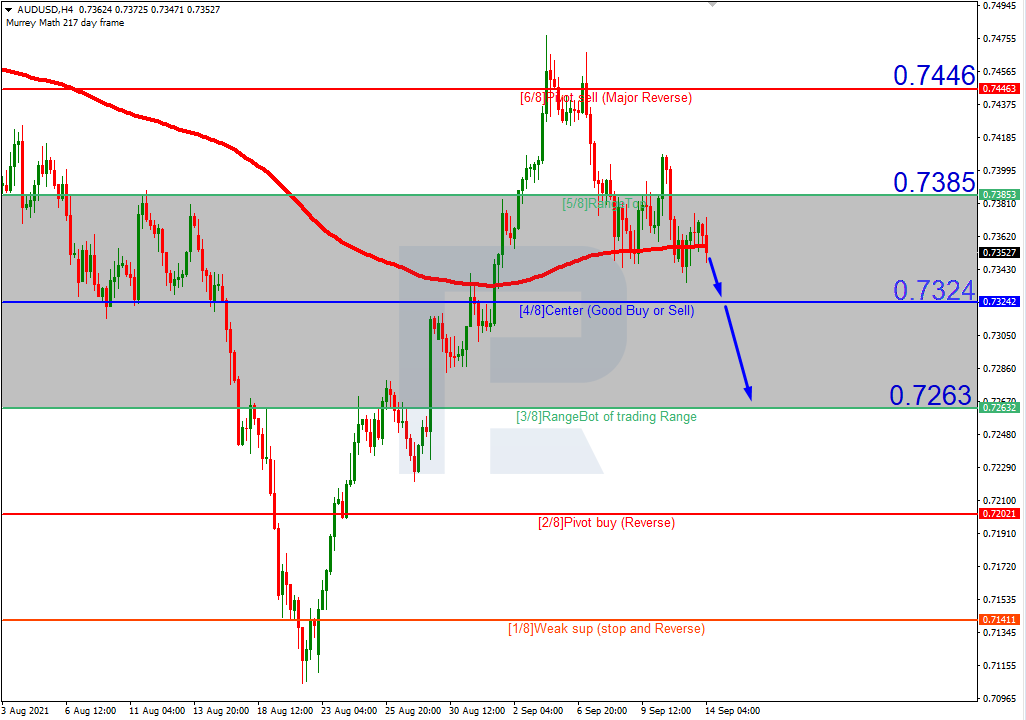
In the H4 chart, after breaking 5/8, AUDUSD is back to consolidating. In this case, the price is expected to test 4/8, break it, and then continue moving downwards to reach the support at 3/8. However, this scenario may no longer be valid if the price breaks 5/8 to the upside. After that, the instrument may reverse and grow towards the resistance at 6/8.

AUDUSDH4
Risk Warning: the result of previous trading operations do not guarantee the same results in the future

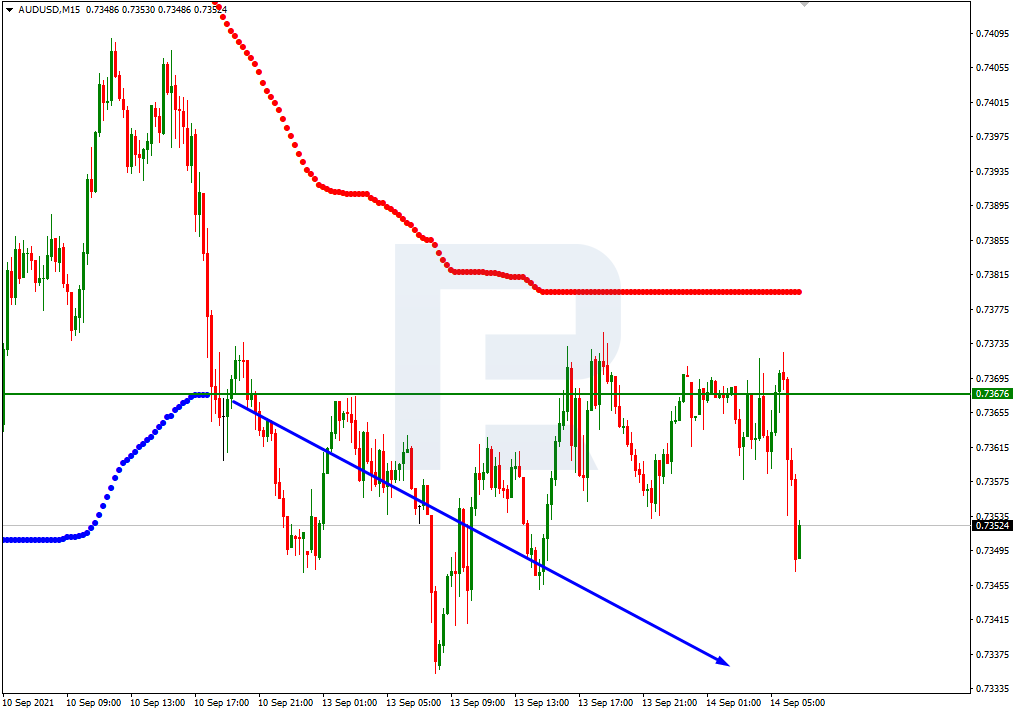
As we can see in the M15 chart, the pair has broken the downside line of the VoltyChannel indicator and, as a result, may continue trading downwards.

AUDUSD_M15
Risk Warning: the result of previous trading operations do not guarantee the same results in the future

NZDUSD, “New Zealand Dollar vs US Dollar”

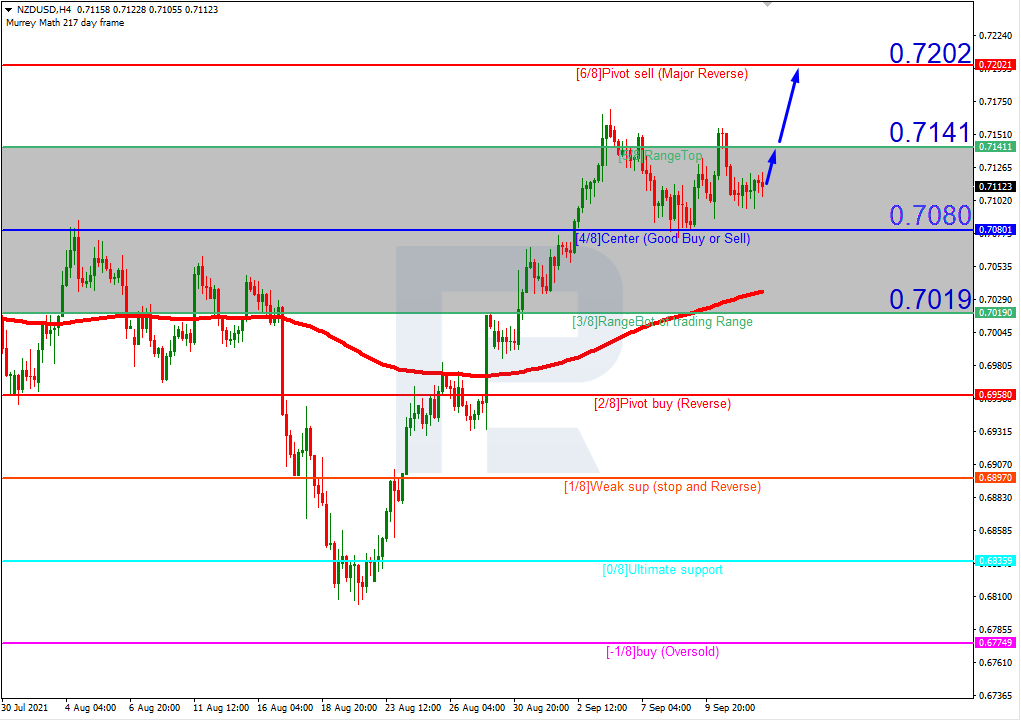
As we can see in the H4 chart, NZDUSD is trading above the 200-day Moving Average, thus indicating an ascending tendency. In this case, the price is expected to test 5/8, break it, and then continue growing to reach the resistance at 6/8. However, this scenario may no longer be valid if the price breaks the support at 4/8 to the downside. In this case, the instrument may continue falling towards 3/8.

NZDUSD_H4
Risk Warning: the result of previous trading operations do not guarantee the same results in the future

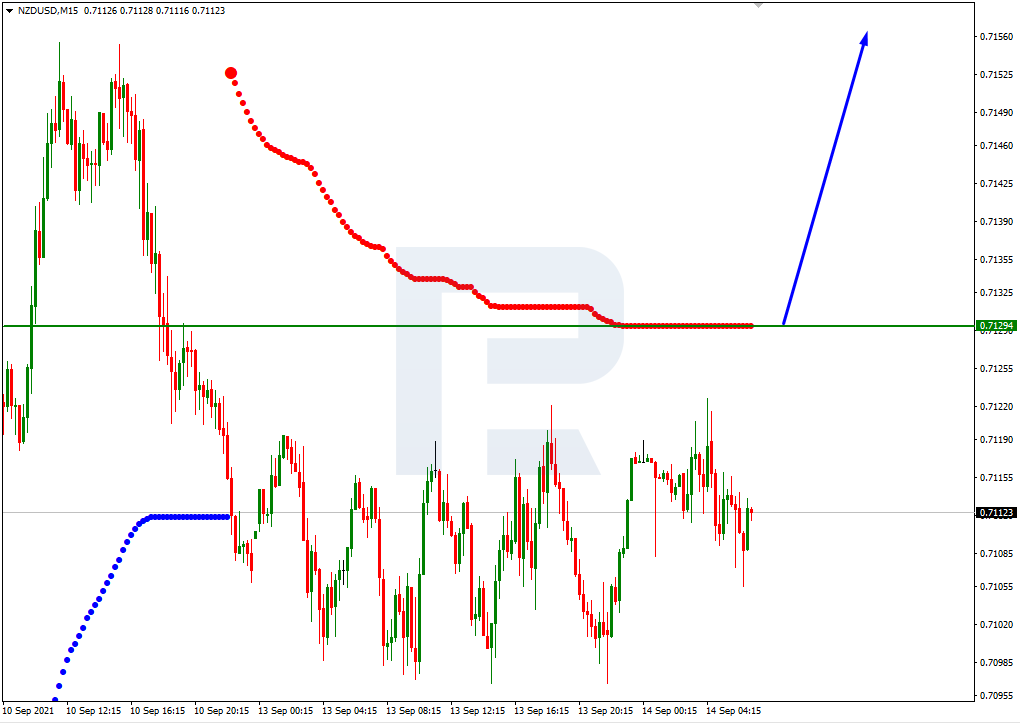
In the M15 chart, the pair may break the upside line of the VoltyChannel indicator and, as a result, continue its growth.

NZDUSD_M15

Article By RoboForex.com

Attention!
Forecasts presented in this section only reflect the author’s private opinion and should not be considered as guidance for trading. RoboForex LP bears no responsibility for trading results based on trading recommendations described in these analytical reviews.

The Analytical Overview of the Main Currency Pairs on 2021.09.14

by JustForex

The EUR/USD currency pair

Technical indicators of the currency pair:
  • Prev Open: 1.1813
  • Prev Close: 1.1810
  • % chg. over the last day: -0.03%

The head of the Philadelphia Fed Patrick Harker has become another official who wants the central bank to start cutting stimulus measures as soon as this year. On the one hand, such verbal interventions lead to an increase in the dollar index at the moment. However, traders should not forget that the European Central Bank is also preparing to cut stimulus, which will have a fundamental effect on the euro strength.

Recomendaciones de trading
  • Support levels: 1.1783, 1.1759, 1.1704, 1.1620
  • Resistance levels: 1.1840, 1.1894, 1.1934, 1.1969

From the technical point of view, the general trend on the EUR/USD currency pair is bullish. Yesterday, the buyers took the initiative from the support level 1.1783. The MACD indicator is in the negative zone, but there are signs of sellers’ weakness and an increase in buyers’ strength. Under such market conditions, buy trades can be considered from the support levels where buyers show initiative. It is better to look for sell trades from the resistance levels above the moving average and only with short targets.

Alternative scenario: if the price breaks through the 1.1704 support level and fixes below, the mid-term uptrend will likely be broken.

EUR/USD
News feed for 2021.09.14:
  • – US Consumer Price Index (m/m) at 15:30 (GMT+3);
  • – US Core Consumer Price Index (m/m) at 15:30 (GMT+3).

The GBP/USD currency pair

Technical indicators of the currency pair:
  • Prev Open: 1.3833
  • Prev Close: 1.3842
  • % chg. over the last day: +0.07%

The UK government is considering the possibility of postponing checks on food imports amid fears of increased pressure on supermarket supplies in the run-up to Christmas. Business executives have said that import cancellation rules will not solve the problem because food shortages are related to a lack of truck drivers.

Recomendaciones de trading
  • Support levels: 1.3793, 1.3750, 1.3692, 1.3632, 1.3614, 1.3525
  • Resistance levels: 1.3886, 1.3935, 1.4002

On the hourly time frame, the GBP/USD trend is bullish. But against the background of the dollar index growth, the growth of GBP/USD quotes is limited. The MACD indicator has become inactive. Under such market conditions, it is better to look for buy trades from the support levels near the moving average line. Sell positions can be considered from the resistance levels with short targets throughout the day.

Alternative scenario: if the price breaks through the 1.3692 support level and consolidates below, the bearish scenario will likely resume.

GBP/USD
News feed for 2021.09.14:
  • – UK Average Earnings Index (m/m) at 09:00 (GMT+3);
  • – UK Claimant Count Change (m/m) at 09:00 (GMT+3);
  • – UK Unemployment Rate (m/m) at 09:00 (GMT+3).

The USD/JPY currency pair

Technical indicators of the currency pair:
  • Prev Open: 109.85
  • Prev Close: 109.99
  • % chg. over the last day: +0.12%

Japan’s revised industrial production hasn’t been changed over the past month. The Japanese Yen is highly correlated with the dollar index right now, but the USD/JPY price is trading in a wide corridor amid the strengthening of both currencies.

Recomendaciones de trading
  • Support levels: 109.62, 109.43, 109.19, 108.65
  • Resistance levels: 110.11, 110.40, 110.66, 110.95, 111.48

The main trend on the USD/JPY currency pair is bullish. But the Japanese yen has shown strength in recent days, which, together with the rise in the dollar index, led to the formation of a wide trading range, within which the price has consolidated. The MACD indicator has become inactive. Under such market conditions, traders should look for buy trades from the support level where buyers show initiative throughout the day. Sell positions should be considered on the lower time frames with short targets from the zones where sellers show initiative.

Alternative scenario: if the price falls below 109.43, the uptrend is likely to be broken.

USD/JPY
There is no news feed for today.

The USD/CAD currency pair

Technical indicators of the currency pair:
  • Prev Open: 1.2680
  • Prev Close: 1.2641
  • % chg. over the last day: -0.30%

The Canadian dollar is a commodity currency, so the USD/CAD currency pair is highly dependent on the dynamics of the dollar index and oil prices. By the end of yesterday’s trading session, the dollar index lost its positions while oil prices grew. As a result, the USD/CAD price has slightly decreased due to the strengthening of the Canadian dollar.

Recomendaciones de trading
  • Support levels: 1.2625, 1.2583, 1.2518, 1.2425
  • Resistance levels: 1.2713, 1.2812, 1.2891, 1.2951

In terms of technical analysis, the trend on the USD/CAD currency pair is bearish. But the price has consolidated in a local correctional upward movement. The MACD indicator became inactive. Buy positions can be considered from the support levels where buyers show initiative, and only with short targets. It is better to look for sell positions from the resistance levels of a higher time frame.

Alternative scenario: if the price breaks through the 1.2812 resistance level and fixes above, the uptrend will likely resume.

USD/CAD
There is no news feed for today.

by JustForex


This article reflects a personal opinion and should not be interpreted as an investment advice, and/or offer, and/or a persistent request for carrying out financial transactions, and/or a guarantee, and/or a forecast of future events.

USDCNH Double WXY Zigzag To End Cycle?

By Orbex

The USDCHN currency pair has completed an intervening wave x of a cycle degree. Now we can see the initial part of a new zigzag pattern.

Perhaps now we are in a bullish impulse wave Ⓐ of the primary degree, in the intermediate sub-waves (1)-(2)-(3)-(4)-(5). The intermediate correction wave (4) has ended as a double W-X-Y zigzag.

Thus, in the near future, with wave (5) going up, prices could rise above the level of 6.588, at the primary correction wave Ⓑ. At that level, minor wave 3 is likely to end, as shown in the chart.

USDCNH

An alternative scenario indicates an incomplete cycle intervening wave x. It takes the form of a double zigzag Ⓦ-Ⓧ-Ⓨ.

Apparently, as part of the final primary wave Ⓨ, which also looks like a double zigzag of a smaller wave level, the intermediate intervening wave (X) in the form of a triple zigzag has come to an end.

In the near future, analysts expect the market to continue declining in the actionary wave (Y). This wave is only half-complete.

Additionally, the bears can send the market to 6.29. At that level, wave (Y) will be at the 100% Fibonacci extension of wave (W).


Orbex-LogoArticle by Orbex

Orbex is a fully licensed broker that was established in 2011. Founded with a mission to serve its traders responsibly and provides traders with access to the world’s largest and most liquid financial markets. www.orbex.com

Intraday Market Analysis – USD Lacks Rebound Strength

By Orbex

EURUSD seeks support

EURUSD

The US dollar advanced after the Philadelphia Fed President commented in favor of tapering this year.

The single currency has not looked back after it turned away from the daily resistance at 1.1920. The bulls’ effort to bid at 1.1800 has been futile.

An oversold RSI has attracted some buying interest, but they will need to clear the fresh hurdle at 1.1840. Then 1.1900 would be the next stop.

Failing that, the rebound could be an opportunity to sell into strength. 1.1740 is a key support in case of an extended pullback.

USDNOK tests supply area

USDNOK

The Norwegian krone held onto its gains thanks to a recovery in oil prices.

The drop below the daily support at 8.7200 suggests that sentiment has turned sour in the short term. The US dollar’s failure to rally back above the supply zone at 8.7300 adds more pressure to the long side.

An oversold RSI has led to a limited rebound. If buyers can clear said resistance, they may gain confidence to claim back 8.8400.

Otherwise, a new round of sell-off would push the price to another support (8.5200) on the daily chart.

UK 100 bounces off daily support

UK100

The FTSE 100 recoups losses supported by strong performance in cyclical stocks. The index has bounced off the critical support (6970) from the daily chart.

An oversold RSI near the psychological level of 7000 has attracted bargain hunters. A bullish MA cross confirms the upward bias. 7100 from the latest sell-off is key resistance and its breach could raise bids to the triple top at 7210.

In the meantime, the RSI’s overbought situation may temporarily limit the buying power and the bulls would have to wait to buy the dip.


Orbex-LogoArticle by Orbex

Orbex is a fully licensed broker that was established in 2011. Founded with a mission to serve its traders responsibly and provides traders with access to the world’s largest and most liquid financial markets. www.orbex.com

Trade of the Week: ‘Inflation persuasion’ to sway USD, GBP, EUR?

富拓市场分析师Han Tan

By Han Tan Chief Market Analyst at Exinity Group

This week there will be headline inflation readings, also known as the consumer price index (CPI), released for three major Western economies:

  • Tuesday, Sept 14: US August CPI expected to grow 5.3% compared to August 2020 (year-on-year, y/y) and 0.4% month-on-month (m/m).
  • Wednesday, Sept 15: UK August CPI forecasted to grow 2.9% y/y and 0.5% m/m.
  • Friday, Sept 17: The final readings of the Eurozone’s CPI is expected to confirm the estimated 3% y/y and 0.4% m/m prints. (The initial figures had been released on 31 August).

Why do central banks focus on inflation?

Part of the mandate for many major central banks is to keep inflation in check to help their respective economies.

Out-of-control inflation could hurt consumers, with lower demand potentially resulting in less hiring as well.

And thanks to the trillions that central banks have pumped out into their respective financial systems since the pandemic, headline inflation has been surging higher in these major economies!

  • In the US, the headline CPI came in at 5.4% in June and July, which are the highest y/y CPI readings since 2008.
  • In the Eurozone, the estimated 3% y/y CPI reading for August would be its highest in a decade (since 2011). In Germany, the EU’s largest economy, prices last month rose by 3.4% y/y – the most since 2008.
  • For the UK, the forecasted August CPI y/y reading of 2.9% would be its highest since 2017.

Failure to act in a timely manner and curb such inflationary pressures could in turn derail the economic recoveries.

The inflation debate

Yet, central bankers have differing views as to whether these elevated inflation prints are here to stay.

Fed Chair Jerome Powell has long maintained that the inflationary surges of late will be ‘transitory’, or temporary. Likewise, Powell’s counterpart at the European Central Bank, President Christine Lagarde, shares the same view. They think the supply bottlenecks that have contributed to higher inflation would eventually be sorted out, prompting prices to moderate.

However, the likes of Dutch central bank President Klaas Knot and the Austrian central bank Governor Robert Holzmann believe that the higher inflation could stick around for longer. That suggests that the ECB should already start thinking about how to intervene, specifically by way of easing up on its emergency asset purchases (also known as the Pandemic Emergency Purchase Programme or PEPP).

Across the Atlantic, Federal Reserve Bank of Philadelphia President Patrick Harker reportedly just this week voiced his support for a ‘sooner rather than later’ tapering. Similar sentiment has been expressed by Dallas Fed President Robert Kaplan, St. Louis Fed President James Bullard, and Kansas City Fed President Esther George.

And the debate is not confined to just among policymakers, but also playing out across global financial markets as well.

Why markets care what central banks think about inflation?

The inflation outlook is a crucial consideration for the timing of policy moves by central banks.

Overall, should these central banks start unwinding their respective stimulus measures, that should trigger profit-taking in stock markets while spurring their own currency higher.

Note how the benchmark dollar index (DXY), which measures the greenback’s performance against other major G10 currencies, has been lifted onto a higher plane since the Fed started talking about its own tapering plans.


Conversely, because the ECB is seen lagging behind the Fed in the path towards normalizing policy closer towards pre-pandemic levels, the euro has been subdued and has been finding it hard to breach the 1.19 mark against the US dollar of late.


When comparing how close the ECB’s is to a rate hike versus their counterparts at the Bank of England, with the latter closer to it than the former, that explains in part why EURGBP has been returned back below its 50-day simple moving average (SMA).


And although markets are forecasting that the Bank of England’s rate hike would happen sooner than the Fed’s (81% chance of a rate hike by the Bank of England in May 2022, compared to a 77% chance of a Fed rate hike in December 2022), GBPUSD has been confined between a wide range of 1.35-1.40 so far this quarter. This sideways pattern is confirmed by the convergence of its shorter- and longer-term moving averages.

Still, Sterling remains the best-performing G10 currency vs. the US dollar so far this year, with GBPUSD boasting of a 1.24% year-to-date gain. The Pound has also strengthened against all of its G10 peers so far this year.


Overall, should the CPI releases for the US, UK, or the Eurozone over the coming days come in higher-than-expected, that could persuade the respective central banks to move closer to adjusting its own policy settings.

The closer each central bank is perceived to be normalizing policy, that could spur that particular currency higher, be it the US dollar, the British Pound, or the euro.


Disclaimer: The content in this article comprises personal opinions and should not be construed as containing personal and/or other investment advice and/or an offer of and/or solicitation for any transactions in financial instruments and/or a guarantee and/or prediction of future performance. ForexTime (FXTM), its affiliates, agents, directors, officers or employees do not guarantee the accuracy, validity, timeliness or completeness, of any information or data made available and assume no liability as to any loss arising from any investment based on the same.


Forex-Time-LogoArticle by ForexTime

ForexTime Ltd (FXTM) is an award winning international online forex broker regulated by CySEC 185/12 www.forextime.com

Ichimoku Cloud Analysis 13.09.2021 (EURUSD, NZDUSD, CADJPY)

Article By RoboForex.com

EURUSD, “Euro vs US Dollar”

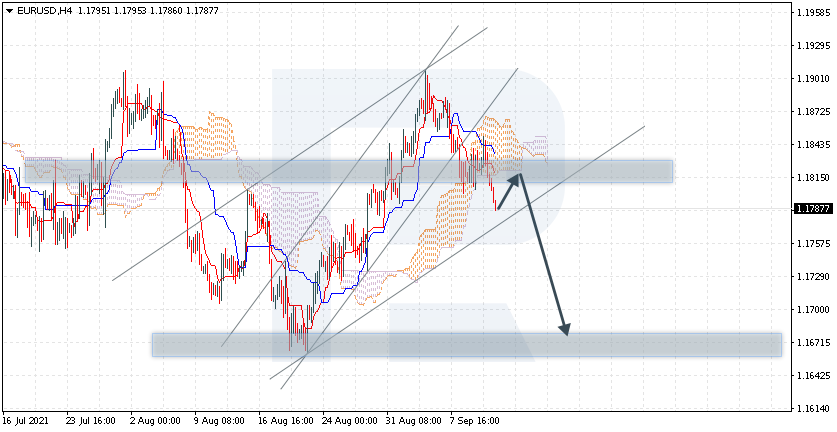
EURUSD is trading at 1.1787; the instrument is moving below Ichimoku Cloud, thus indicating a descending tendency. The markets could indicate that the price may test the cloud’s downside border at 1.1815 and then resume moving downwards to reach 1.1670. Another signal in favor of a further downtrend will be a rebound from the resistance level. However, the bearish scenario may be cancelled if the price breaks the cloud’s upside border and fixes above 1.1875. In this case, the pair may continue growing towards 1.1965. To confirm further decline, the asset must break the rising channel’s downside border and fix below 1.1750.

EURUSD
Risk Warning: the result of previous trading operations do not guarantee the same results in the future

NZDUSD, “New Zealand Dollar vs US Dollar”

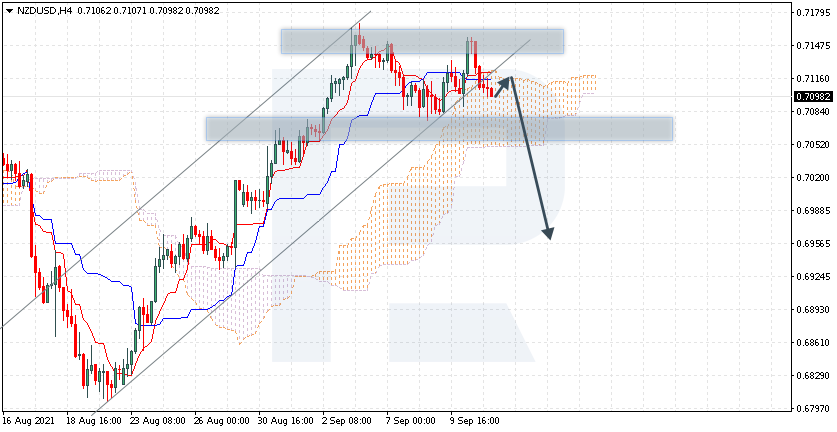
NZDUSD is trading at 0.7098; the instrument is moving inside Ichimoku Cloud, thus indicating a sideways tendency. The markets could indicate that the price may test the cloud’s upside border at 0.7115 and then resume moving downwards to reach 0.6955. Another signal in favor of a further downtrend will be a rebound from the resign channel’s downside border. However, the bearish scenario may be cancelled if the price breaks the cloud’s upside border and fixes above 0.7145. In this case, the pair may continue growing towards 0.7235. To confirm further decline, the asset must break the support level and fix below 0.7040, thus completing a Double Top reversal pattern.

NZDUSD
Risk Warning: the result of previous trading operations do not guarantee the same results in the future

CADJPY, “Canadian Dollar vs Japanese Yen”

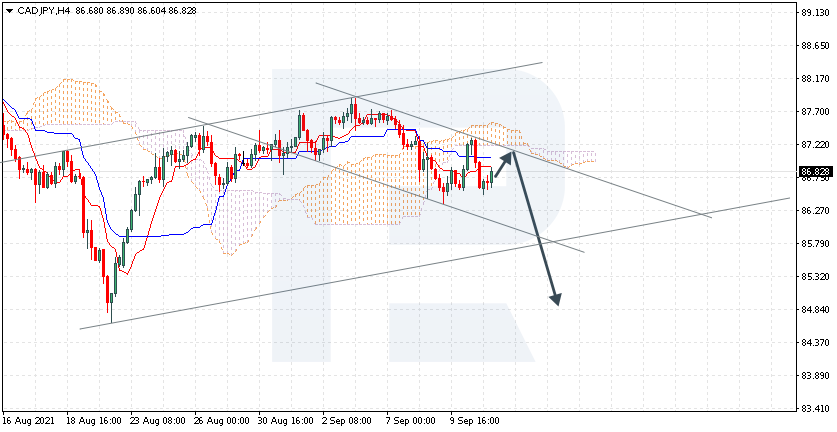
CADJPY is trading at 86.82; the instrument is moving below Ichimoku Cloud, thus indicating a descending tendency. The markets could indicate that the price may test Tenkan-Sen and Kijun-Sen at 87.15 and then resume moving downwards to reach 84.85. Another signal in favor of a further downtrend will be a rebound from the descending channel’s upside border. However, the bearish scenario may no longer be valid if the price breaks the cloud’s upside border and fixes above 87.95. In this case, the pair may continue growing towards 88.85. To confirm further decline, the asset must break the rising channel’s downside border and fix below 85.45.

Article By RoboForex.com

Attention!
Forecasts presented in this section only reflect the author’s private opinion and should not be considered as guidance for trading. RoboForex LP bears no responsibility for trading results based on trading recommendations described in these analytical reviews.